Breath-hold
Respiratory triggered
FOV
400 × 400
360 × 347
Acquisition plane
Axial
Axial
Matrix size
128 × 128
164 × 164
Repetition time (ms)
Min 2,000
1 respiratory cycle
Echo time (ms)
Min
Min
EPI factor
128
158
Phase-encoding direction
AP
AP
Parallel imaging acceleration factor
2
2
Number of averages/excitations/signals acquired
2
>3
Slice thickness (mm)
8
6
Slice spacing (mm)
1.6
1.2
Number of slices
20
30
Direction of motion-probing gradients
Phase, frequency, and slice (3-scan trace)
Phase, frequency, and slice (3-scan trace)
Fat suppression
Yes
Yes
b-values (s/mm2)
0, 1,000
0, 100, 500, 1,000
Acquisition time
20 s
>3 min
The second strategy involves a respiratory-triggered sequence with three or more b-values (e.g., 0, 50–100, 500, and 1,000 s/mm2) and higher spatial resolution.
Free-breathing imaging can be performed either with multiple signal averaging to reduce the effects of motion or with respiratory or cardiac triggering [22, 23]. However, free-breathing technique without respiratory triggering might suffer from motion artifacts and blurring, which may decrease lesion conspicuity and delineation. Although respiratory-triggered DWI (RT-DWI) of the liver may take longer than breath-hold or free-breathing acquisitions (3–6 min of acquisition time), less motion artifacts are observed, and the use of multiple signal averages results in images with higher SNR. Consequently, thinner image sections (5 mm or less) can be obtained, and more b-values can be accommodated within the longer measurement. The choice of breath-hold vs. free-breathing vs. respiratory-triggered acquisition depends on local equipment and allotted time [16].
Several studies have shown an improvement in image quality and focal liver lesion detection with the use of RT-DWI [23–25]. The higher SNR, the longer TR, and the acquisition of multiple b-values obtained with RT sequences also reduce errors in ADC calculation compared to breath-hold sequences [23, 26]. Moreover, in comparison with free-breathing sequence, RT-DWI of the liver has been demonstrated to provide a better relative lesion CNR between malignant liver tumors and adjacent liver, with less scattering of ADC values [24, 27, 28].
SNR can be improved by using a 3 T system, with minimum TE, a higher number of averages, lower spatial resolution (128 × 128, with slice thickness ≥6 mm), and larger field of view [29]. Also, faster imaging techniques, such as parallel imaging, allow the acquisition of b-values in multiple directions, which enables signal averaging and decreased TE that further increases SNR [30]. Ghosting from respiratory movements and chemical-shift artifacts are resolved by robust fat suppression techniques that are now available. T1 effects can be minimized by using longer TR values (usually >2,500 ms, which is 3 times the T1 of a typical liver metastasis). T2 shine-through effects are suppressed by applying high b-values (above 1,000 s/mm2) or by interpreting the ADC map in conjunction with diffusion-weighted images.
41.3.4 DWI for Detection and Characterization of Liver Metastases
41.3.4.1 Detection
Several publications have reported the usefulness of DWI for liver lesion detection [25, 31–36]. Most of these focused on the value of low b-value images (50–100 s/mm2) compared to T2WI and postcontrast T1WI. This distinction is due to the “black-blood” effect inherent in low b-values, which suppresses the background signal of vessels in the liver parenchyma while maintaining high SNR (Fig. 41.1). This is particularly useful in detecting small lesions (<1 cm) localized near small hepatic vessels, since on flow-sensitive FSE T2WI sequence, only the main branches with fast flow appear dark, while small vessels are bright and can mask adjacent small lesions. Moreover, there is reduced blurring with DWI compared to FSE T2WI or HASTE T2WI [37].
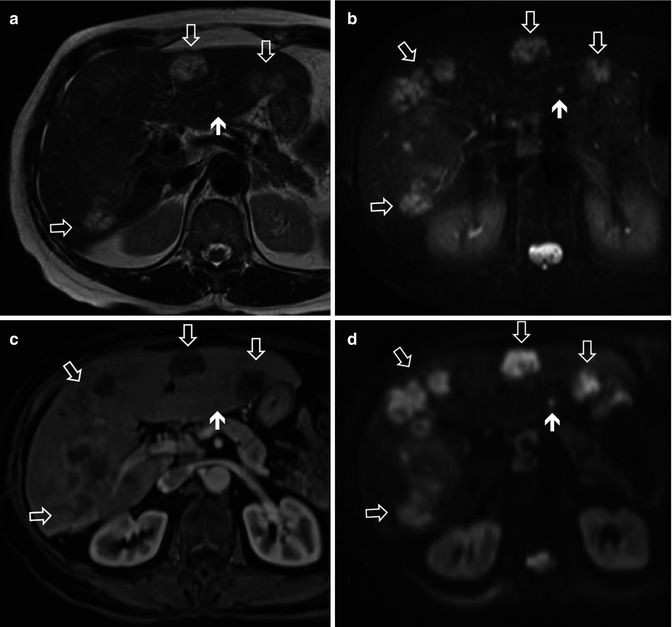
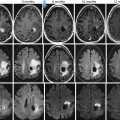
Fig. 41.1
Patient with metastatic colon cancer. (a) Axial T2W HASTE, (b) axial fat-suppressed FSE T2W image, (c) postcontrast T1WI obtained at the portal venous phase, (d) SS EPI for b50, all depicting multiple liver metastases (arrows). However, liver metastases are better demonstrated on DWI, especially compared to T2WI. Note also that the small lesion in the left lobe (short arrow) is more conspicuous on DWI (d)
Coenegrachts et al. [38] showed a higher conspicuity of hemangiomas and metastases with RT-DWI using low b-value compared to conventional unenhanced MRI. Zech et al. [36] compared DWI (b50) with fat-suppressed T2WI and observed better image quality and better sensitivity for lesion detection with DWI (83 % vs. 61 %). Bruegel et al. [31] compared RT-DWI with five different either fat-suppressed T2WI or STIR sequences for the diagnosis of hepatic metastases at 1.5 T and found that DWI was significantly more sensitive (0.88–0.91) and accurate (0.90–0.91) than any of the T2WI sequences (sensitivity 0.45–0.62 and accuracy 0.47–0.67). Moreover, when only small (≤1.0 cm) metastatic lesions were considered, the difference in sensitivity between DWI (0.85) and T2WI (0.27–0.44) was even larger. The combination of these results, especially when combined with other similar studies already published, has led to the claim that low b-value DWI outperforms both fat-suppressed T2WI and STIR in the detection of focal liver lesions (Figs. 41.1 and 41.2). Nasu et al. reported decreased detection of liver metastases in the left hepatic liver lobe due to cardiac-related artifacts [39]; however, this was not observed by Parikh et al. [25].
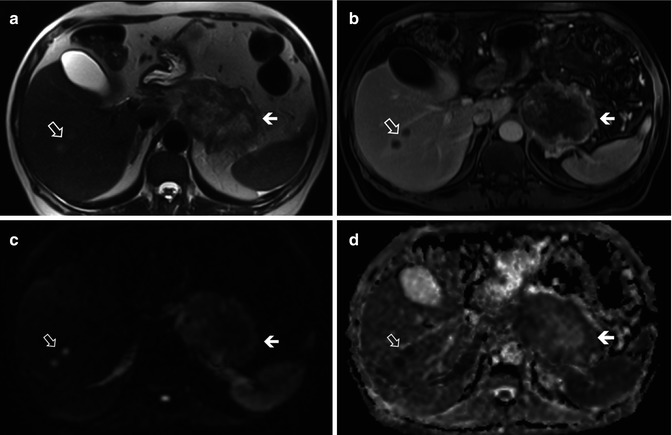
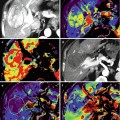
Fig. 41.2
Hypovascular liver metastases in a patient with pancreatic adenocarcinoma. Two small metastatic lesions in the right hepatic lobe (open arrows) are slightly hyperintense in axial 2 W HASTE image (a), rim enhancing with hypovascular center on postcontrast fat-suppressed T1W image obtained at the portal venous phase (b), hyperintense on high b-value SS EPI DWI (c, b = 1,000 s/mm2), and hypointense on ADC map (d), compatible with restricted diffusion (high cellularity). There is also a large pancreatic tumor with central necrosis and solid peripheral center with restricted diffusion (short arrows). Note better conspicuity of lesions with DWI compared to T2WI
Regarding the comparison of DWI with contrast-enhanced imaging, there is evidence to suggest that DWI has a better diagnostic accuracy in the detection of colorectal metastases in conjunction with mangafodipir trisodium [40] and no significant difference in performance on a per-lesion basis compared to nonspecific extracellular gadolinium-enhanced T1WI [41].
At this point, there are only a few published studies directly comparing the accuracy of gadoxetic acid-enhanced MRI to DWI for the detection of metastatic liver lesions [42, 43]. Shimada et al. [43] showed a better diagnostic performance using gadoxetic acid compared to DWI at 3 T (AUC 0.958–0.966 and 0.881–0.906, respectively; p = 0.04 for observer 1 and no significant difference for observer 2 for the detection of small metastatic lesions (≤2 cm), without significant differences in sensitivity and positive predictive values. Compared with previous studies using extracellular agents, Shimada et al reported a higher accuracy, likely due to the combination of gadoxetic acid with 3 T. In the study by Löwenthal et al. [42], performed at 1.5 T, breath-hold DWI was compared to gadoxetic acid-enhanced T1W. The authors demonstrated superiority of gadoxetic acid-enhanced MRI (detection rate, respectively, 94.4 and 100 %, 2 observers) compared to DWI (detection rate 78.3 and 97.5 %) and contrast-enhanced T1WI at the dynamic phase (detection rate 81.5 and 89.9 %). Despite the lack of a low b-value acquisition (b-values 0 and 500) and relatively low in-plane resolution (slice thickness 8 mm), subgroup analysis revealed a substantially higher sensitivity for small lesions (≤1 cm) and lower accuracy of DWI for the left lobe (7 out of 9 misclassified lesions were located in the left lobe).
41.3.4.2 Characterization
The most straightforward approach for characterizing focal liver lesions relies on visual assessment of intermediate/high b-value images (500–1,000) that help distinguish between cystic and solid lesions, the latter usually retaining relative high signal intensity over the background liver. A lesion can be considered likely benign, when it is hyperintense at a low b-value and shows a progressive and substantial signal loss on intermediate/high b-values, with a corresponding higher ADC value. On the other hand, a lesion is more likely malignant, when there is no or minimal signal drop on intermediate/high b-value images, with corresponding ADC values lower or isointense to those of the surrounding liver parenchyma [15, 25, 29] (Figs. 41.1, 41.2, 41.3, and 41.4).
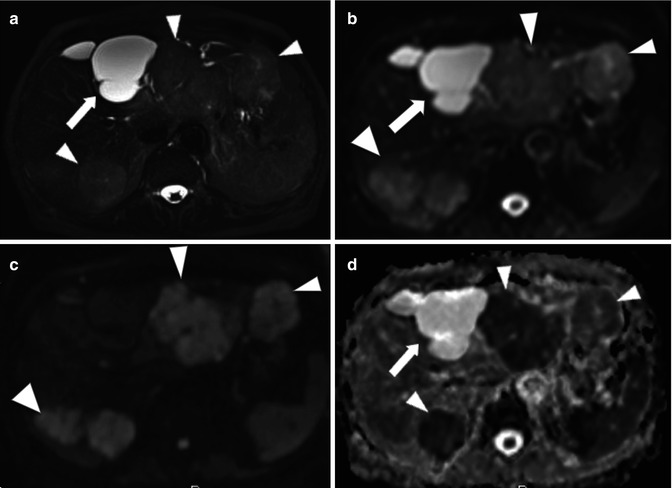
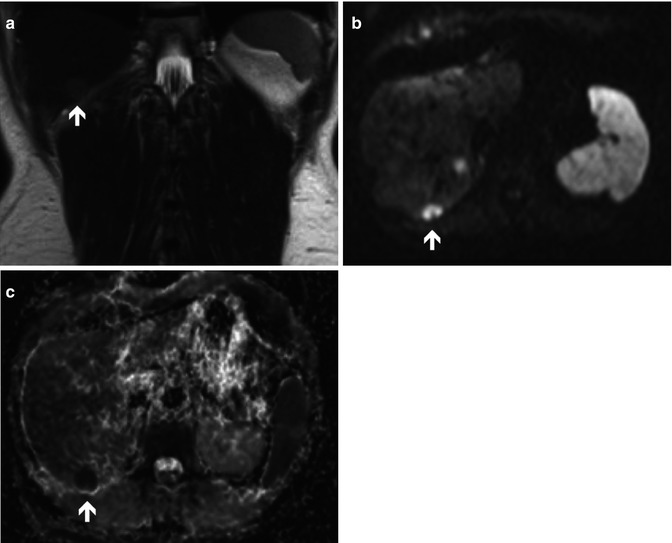
Fig. 41.3
Lesion characterization with DWI. Patient with liver cysts and metastatic pancreatic adenocarcinoma. (a) Fat-suppressed T2W image shows a markedly hyperintense septated cyst in segment IV (arrow) and multiple mildly hyperintense solid lesions in right and left hepatic lobes (arrowheads). The cyst is hyperintense on b0 DW image (b) and demonstrates complete signal attenuation on b1000 image (c). In contrast, metastatic lesions are hyperintense on b50 (b) and appear in high signal intensity in comparison with background liver on b1000 compatible with restricted diffusion (arrowheads) (c). ADC map demonstrates low ADC in metastases (arrowheads), with calculated mean ADC of 0.95 × 10⁻³ mm/s2 (d). The cyst has high ADC of 2.50 × 10⁻³ mm/s2
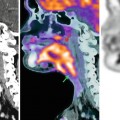
Fig. 41.4
A 57-year-old female with metastatic neuroendocrine carcinoma. T2WI (a), high b-value DWI (b = 1,000 s/mm2) (b), and ADC map of the liver (c) depicting a metastatic lesion in the right lobe (arrows) with restricted diffusion (high cellularity)
As described previously [15, 25, 44, 45], visual characterization of focal liver lesions can be performed with high accuracy and excellent interobserver agreement with DWI. The distinction between benign and malignant lesions is reported to be correct in 89–93.0 % of cases, even though in most of the studies benign lesions were predominantly cysts or hemangiomas. However, inhomogeneous appearance of metastases can reflect different components of tumors (cystic, necrotic, or solid) (Fig. 41.5), such as mucinous malignant lesions that may show a lower restriction to diffusion and high ADC, and can be misdiagnosed as benign lesions [29, 46].
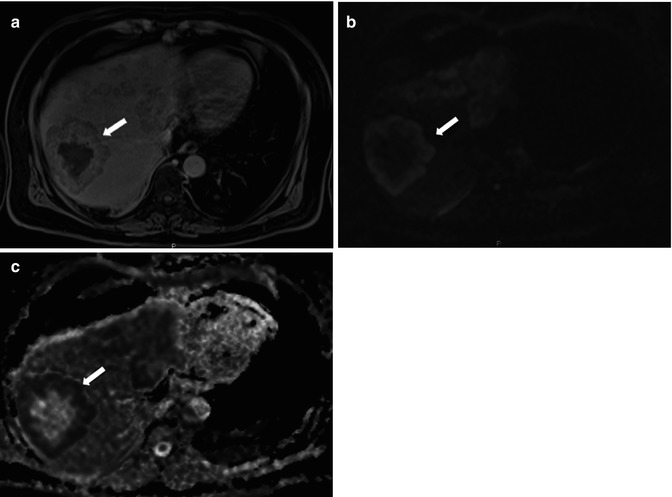
Fig. 41.5
Patient with necrotic colon cancer metastasis. (a) Delayed-phase post-gadolinium fat-suppressed T1W image demonstrates a large metastatic lesion with central necrosis (arrow). The lesion shows peripheral high signal intensity on DWI with b1000 (b) and hypointensity in the ADC map (c), corresponding to the enhancing solid component (high cellularity)
Quantitative ADC measurements may also be used to differentiate between benign and malignant lesions owing to the generally lower ADC values in the latter as compared to the former, probably resulting from greater cellularity or nucleus/cytoplasm ratio. ADC quantification requires minimum of 2 b-values, minimum acceptable SNR at higher b-values, as well as minimal lesion size of 1.5 to 2× the in-plane resolution, so as to avoid partial volume effect. As a general rule, statistically higher ADC values have been demonstrated for benign lesions compared to malignant lesions, with variable degrees of overlap [15, 25, 45, 47, 48]. Although an average ADC cutoff of 1.4–1.6 × 10⁻³ mm/s2 may provide sensitivity as high as 74–100 % and specificity in the range of 77–100 % in the distinction between benign and malignant liver lesions [46], other published ADC values show much wider variation, in the range of 0.94–2.85 × 10⁻³ mm/s2 for metastases [16, 24, 33, 44, 49–52]. There is considerable overlap between the ADC values of cellular benign hepatic lesions, such as focal nodular hyperplasia or adenoma [53], and those of malignant lesions, such as metastases and HCC. Also, although cysts and solid lesions are easily distinguishable on the ADC map, sometimes metastases and hemangiomas can have similar DWI features. Also, cystic, necrotic, or mucinous components in a metastatic lesion may increase ADC values, which can generate false negatives when DWI data alone are considered (Figs. 41.5 and 41.6). Cystic, mucinous, or necrotic metastases (e.g., after systemic chemotherapy) are characterized by a low viscosity in central portion, so they may show relatively high ADC values, while occasionally hemangiomas display portions with low ADC values [48, 49, 54]. Conversely, liver metastases originated by neuroendocrine tumors, histopathologically constituted by highly concentrated small round cells, are usually characterized by low ADC values. In contrast, abscesses or inflammatory lesions show low ADC values, due to their inflammatory and viscous contents, potentially generating false positives (Fig. 41.7).
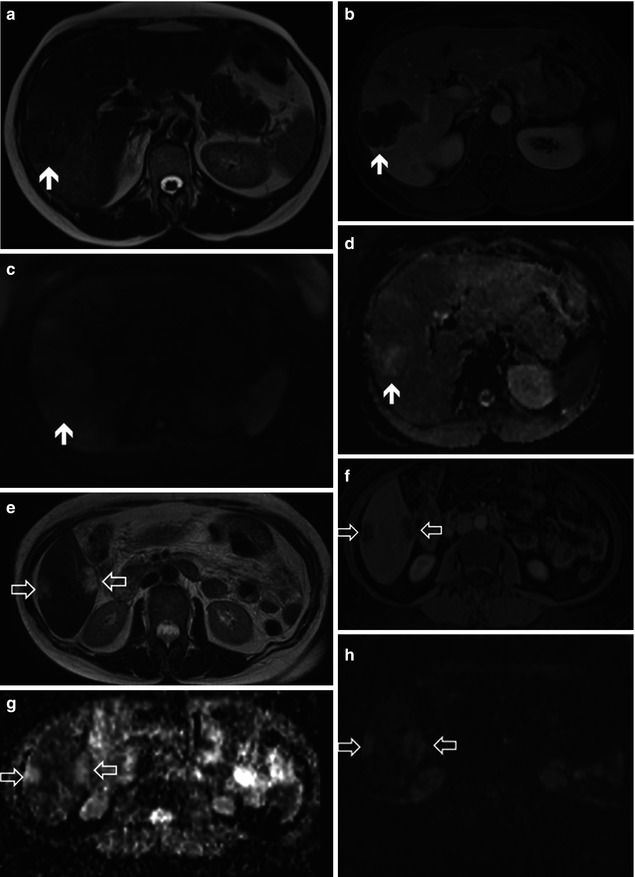
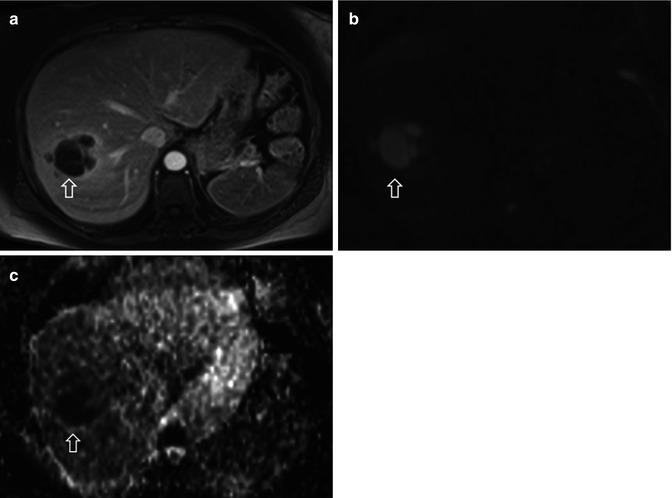
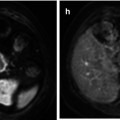
Fig. 41.6
Characterization of malignant mucinous lesions in two different patients with metastatic colon mucinous adenocarcinoma. Top row: Large metastatic lesion (arrows) in the right hepatic lobe has areas of slight hypointensity in T2WI image (a). After contrast injection, the lesion is diffusely hypointense on fat-suppressed T1W image obtained at the portal venous phase (b). High b-value DWI (b1000) shows slight residual signal hyperintensity (c), and ADC map shows areas of high signal intensity in the lesion (d), simulating a benign tumor or necrotic degeneration. Bottom row: Two metastatic lesions in right hepatic lobe are hyperintense on T2WI image (open arrows in e) due to extracellular mucinous content. The lesions are hypovascular on fat-suppressed T1W postcontrast image obtained at the portal venous phase (f), markedly hyperintense on the ADC map (g), and slightly hyperintense in high b-value DWI (b = 1,000, h), compatible with T2 shine-through effect
Fig. 41.7
A 39-year-old patient with hepatic abscess. (a) Portal-phase post-gadolinium fat-suppressed T1W image, (b) high b-value DWI (b1000), and (c) ADC map demonstrate a necrotic liver abscess (arrows). The central cystic component of the lesion shows restricted diffusion, indicating purulent content
Furthermore, each study group uses their own scanning protocols, with different manufacturers, different field strength scanners, different b-values sets, breath-hold or respiratory-triggered techniques, different ADC calculation algorithms, and different measurement techniques, making it difficult to integrate results across studies and propose a standardized ADC evaluation. Therefore, DWI alone is currently not suitable for stand-alone characterization of focal liver lesions, but it shows better accuracy when used in conjunction with contrast-enhanced and conventional MRI sequences.
41.3.5 DWI for Assessment of Tumor Response to Therapy
Conventional morphological imaging criteria have been used to evaluate antitumor therapy [55]. However, when liver metastases are treated with cytotoxic therapy and molecular targeting agents, measuring tumor size is often not adequate, considering that changes in tumor size after therapy with these drugs are either not expected or occur only well after biochemical changes are established. It is known that effective anticancer treatment results in tumor lysis, loss of cell membrane integrity, increased extracellular space, and, therefore, an increase in water diffusion [56]. And because cellular death and vascular changes in response to treatment can both precede changes in lesion size, changes in DWI may be an effective early biomarker for treatment outcome both for vascular disruptive drugs and for therapies that induce apoptosis in liver metastases [57] (Fig. 41.8).
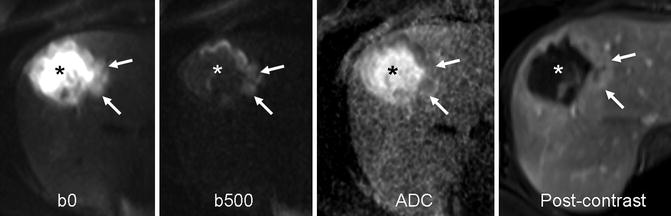
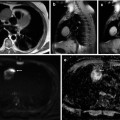
Fig. 41.8
Necrotic breast cancer metastasis. Transverse fat-suppressed breath-hold SS EPI diffusion images in a 43-year-old woman with breast cancer treated with chemotherapy, obtained using b-values of 0 and 500 s/mm2, with corresponding ADC map and postcontrast image. The higher signal intensity necrotic center of the tumor on the b = 0 s/mm2 image shows greater signal attenuation on the b = 500 s/mm2 with higher ADC (asterisk) compared with the cellular enhancing rim which has restricted diffusion and lower ADC (arrows) (With permission from Taouli and Koh [72])
Theoretically, DWI is sensitive to microenvironmental changes that occur after tumor treatment. Studies on the predictive value of DWI in primary cancer sites demonstrated a strong negative correlation between mean pretreatment ADC values and percentage size reduction of tumors after chemotherapy and chemoradiation (Fig. 41.9). And, on the other hand, high pretreatment ADC values in tumors were associated with a poor response to chemotherapy [58, 59]. Regarding liver metastases, a growing number of preclinical and clinical studies have shown that ADC increases are predictive of an improved response to treatment [57, 59]. For instance, in patients with metastatic breast carcinoma treated with chemotherapy, changes in ADC values preceded changes in the size of the metastatic lesions, and increases in ADC values of liver metastases 11 days following initiation of treatment were found to be predictive of at least a partial response, defined as a reduction in tumor size at the end of therapy [60]. In CRC metastases, the mean ADC values increased in lesions that showed at least a partial response to chemotherapy according to the Response Evaluation Criteria in Solid Tumors (RECIST) [59]. This increase in ADC values was not observed in lesions that met criteria for either stable or progressive disease according to the RECIST. In another study [58


Related posts:

Stay updated, free articles. Join our Telegram channel
Full access? Get Clinical Tree
