Fig. 5.1
Surface-rendered SPECT/CT showing high uptake at the injection site in the forehead and a chain of left cervical nodes. Axial SPECT/CT images demonstrate the position of the left preauricular sentinel node and secondary tier level II cervical nodes
5.2.2 Sentinel Lymph Node Positive
Although tempting to image patients with microscopic disease detected on SLNB, the a priori likelihood of nodal involvement is low, and there is a very low yield from imaging in this setting, whether this be by CT or MRI [9] or using FDG PET/CT [10]. With all modalities, there is higher number of false-positive than true-positive results in this clinical setting.
5.2.3 High-Risk Patients with Stage I or II Disease
There may be a role for staging FDG PET/CT in patients with stage I/II disease and high-risk features, such as T4 disease or ulceration. In a study of 52 patients with T4 disease, the melanoma-related treatment plan was altered in 11% of patients. The main benefit of PET in this setting is identification of macroscopic locoregional nodal disease enabling the patient to proceed to lymphadenectomy and obviating the need for sentinel node biopsy.
5.2.4 Stage III and IV Melanoma
FDG PET/CT is the imaging modality of choice when there is clinical suspicion of locoregional or systemic metastases. Indications include:
Clinical suspicion of recurrent or metastatic disease
Prior to planned intervention (e.g. surgery or radiotherapy, with curative intent) in patients with locoregional or oligo-metastatic disease
Response assessment of patients undergoing chemotherapy and targeted or immune-activating therapy
Substantially higher sensitivity and specificity of PET (92 and 94%, respectively) has been demonstrated compared to CT (58 and 45%, respectively) for detection of distant metastatic disease [14] (Fig. 5.2). The patterns of spread of melanoma are unpredictable with metastases seen in virtually any organ including the skin, subcutaneous tissue, lung, liver, brain, bone, gastrointestinal tract (small bowel > large bowel > stomach), muscle, adrenal cardiac, adrenal, gallbladder, breast, pancreas, thyroid and kidneys (Fig. 5.3).

Fig. 5.2
Patient with suspected right adrenal solitary metastasis on CT staging. Despite presence of limited disease on CT, PET/CT clearly demonstrates extensive metastatic disease. The maximum intensity projection (MIP) image (left) provides a whole body overview with high tumour-to-background contrast. A right serratus anterior muscle metastasis is shown (PET, CT and PET-CT images). On the PET-only images, the abnormality cannot be localised. Even with the PET and CT side-by-side interpretation, localisation is difficult. The fused PET-CT images provide confident localisation of a sub-cm metastasis
Fig. 5.3
Other occult sites of metastases seen in Fig. 5.2 including the left sinus and right tonsillar, gastric and osseous metastasis in the sternum. Also note the index right adrenal metastasis
The superior accuracy of PET/CT has been shown to confer a high management impact ranging from 22 to 62% [15–17]. In a study of 134 patients, PET detected 55% additional lesions compared to conventional modalities conferring a 62% management change [18]. In a prospective study of 103 patients with PET performed in high-risk patients prior to planned surgery, addition of PET changed management in 35% of patients, with most of these being cancellation of surgery [19]. In a study of PET/CT in patients with stage III/IV melanoma referred after review by a multidisciplinary team, major clinical impact was seen in 41% [20]. High management impact was predominantly alternation of plan from surgery to systemic therapy after identification of more extensive disease than seen on conventional workup. Although using out-dated, stand-alone PET technology and SPECT rather than SPECT/CT, an early study from our centre indicated that PET is also substantially more sensitive than Ga-67 citrate SPECT, a molecular imaging approach that was previously used for staging advanced melanoma [21]. High management impact was also demonstrated.
5.2.5 Limitations of FDG PET/CT
Stand-alone PET has lower sensitivity for pulmonary metastases, but in the PET/CT era, these are generally detected on the CT component. In a study of 50 patients, no additional benefit was demonstrated with contrast-enhanced CT compared to PET with non-enhanced non-low-dose CT [22]. Dedicated CT of the thorax can detect smaller nodules than low-dose CT, but these are invariably too small to characterise and, in our experience, frequently represent false-positive findings. Even faint FDG uptake in lesions smaller than 8 mm is highly suggestive of malignancy, but lesions of 1–4 mm may generally require surveillance or comparison with prior imaging to differentiate between benign granulomas and small metastases. In our centre, we no longer routinely perform contrast-enhanced CT but use it selectively to further interrogate equivocal findings on PET/CT. Owing to high physiologic brain activity, FDG PET/CT has very limited utility in assessing cerebral metastases, which is better assessed with MRI or by other PET radiotracers discussed later.
Ocular/uveal melanoma. These have a distinctive propensity to metastasise to the liver. A proportion of these also have low metabolic activity [23] despite aggressive behaviour, and correlation with contrast enhanced CT or MRI of the liver is therefore advised.
5.3 Response Assessment
Data has demonstrated that assessing metabolic response on PET/CT after 2–3 cycles of conventional chemotherapy (e.g. dacarbazine) with visual dichotomisation of response as a complete or partial metabolic response versus progressive metabolic disease [24, 25] is a powerful biomarker that has the potential to replace conventional imaging endpoints such as RECIST anatomic criteria.
Management paradigms in metastatic melanoma have rapidly changed with both targeted therapies against BRAF and MEK and immunotherapy including anti-programmed death 1 (anti-PD1) monoclonal antibodies (nivolumab and pembrolizumab) and anti-CTLA4 monoclonal antibody (ipilimumab) now the treatments of choice for metastatic disease. Given the availability of several systemic therapeutic options, accurate response assessment is pivotal to guide management. Early response assessment enables an appropriate change in management thereby avoiding the morbidity and cost associated with ineffective therapy.
FDG PET/CT has been shown to be a useful marker of early biologic response to BRAF inhibition with complete or substantial reduction in metabolic activity observed as early as 15 days after commencement of therapy [26] (see Fig. 5.4). The reduction in glucose utilisation early during BRAF therapy is likely a pharmacodynamic indicator of reduced signalling through the MAP kinase pathway and is a necessary but sometimes insufficient requirement for subsequent clinical response and survival benefit. Reactivation of glucose use by previously responding tumours is a biomarker of reactivation of signalling through this pathway [27].

Fig. 5.4
Patient with extensive metastatic melanoma involving the liver and bone (metabolic volume of 3.1 L) (a). After 14 days of vemurafenib therapy (b), there is a complete metabolic response and partial anatomic response. Reproduced with permission [26]
5.3.1 Pitfalls
Targeted and immune-modulating therapies can result in immune-related inflammatory changes on FDG PET/CT. In our experience, the following features are typical of an inflammatory immune-related response and should not be misinterpreted as disease progression:


Fig. 5.5
Patient with biopsy proven pulmonary metastases from metastatic melanoma. There is a complete metabolic response 14 days after commencement of combined BRAF and MEK inhibitors. Anatomic regression is visualised at 45 days, but there are new hilar and mediastinal nodal uptake. These changes are consistent with an immune-related inflammatory response. Although BRAF/MEKi is not a form of immunotherapy there is emerging evidence that therapy directed against the MAPK pathway exerts immune modulatory effects explaining the PET findings. These changes resolve by 120 days with complete anatomic response evident in the metastases
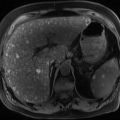
Fig. 5.6
Patient with metastatic melanoma in the left lobe of the liver. Following commencement of combined BRAF and MEK inhibitors, there is an early partial metabolic response at 14 days. FDG PET/CT at 45 days shows further reduction in size of the metastasis but more intense metabolic abnormality. This could be attributed to early progression, but the presence of diffuse splenic uptake is a clue to underlying immune-related response. In this setting, the increase in uptake is not attributed to progression. Subsequently, there was a complete anatomic and metabolic response
5.3.2 Treatment Related Adverse Effects Mimicking Malignancy
Several new drugs have specific adverse effects, which have correlates on FDG PET/CT and that can be mistaken for disease progression. In general, when a “mixed response” is visualised, that is, regression of disease with an apparent new site of disease, consideration should be given to alternative non-malignant explanation.
Interferon is known to cause reactivation of sarcoidosis, a pattern which can mimic malignancy (see Fig. 5.7).

Fig. 5.7
This patient with stage III melanoma had intense but symmetric hilar and mediastinal nodal activity (left) most consistent with sarcoidosis or granulomatosis disease. Following adjuvant interferon therapy, pulmonary and nodal abnormalities progressed but were mostly sub-cm in size with preserved fatty hilum (bottom left and right). As interferon is known to cause exacerbation of underlying sarcoidosis, biopsy was recommended which confirmed non-necrotising granulomatous inflammation. Following cessation of interferon, abnormalities regressed (top right). The case highlights how knowledge of drug effects can minimise false-positive results
BRAFi can promote formation of keratoacanthomas or SCC through paradoxical activation of ERK signalling. These can be FDG-avid and confused with new dermal or subcutaneous metastases (see Fig. 5.8).

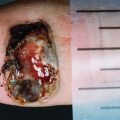
Fig. 5.8


This patient which has extensive axillary nodal disease (a: surface-rendered PET/CT) was treated with a BRAF inhibitor with marked reduction in extent and intensity of abnormality at 3 months (b). Despite this, a new intensely FDG-avid dermal/subdermal nodule was seen in the left leg (c, d, e). This was thought likely to be due to development of a keratoacanthoma/squamous cell carcinoma as an adverse effect of BRAF inhibition, which was confirmed following excision
Related posts:


Stay updated, free articles. Join our Telegram channel
Full access? Get Clinical Tree
