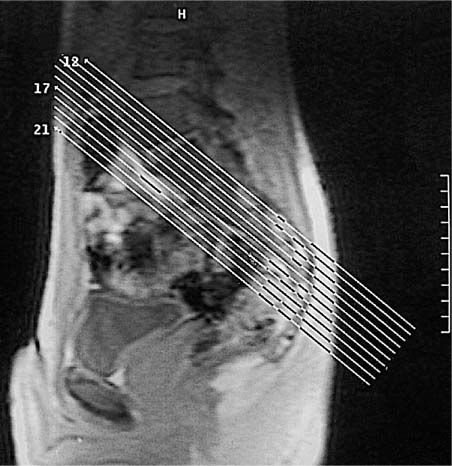
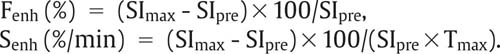
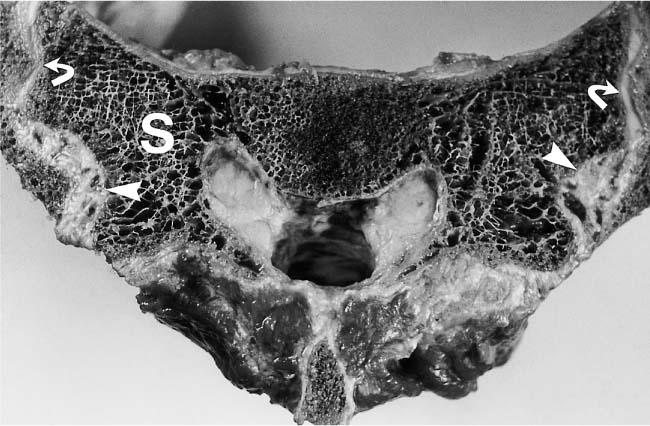
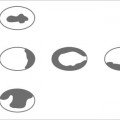
14 Sacroiliac Joints The evaluation of the sacroiliac joints begins with conventional radiography (24, 28, 40). The wide variations in interpreting radiographs of the sacroiliac spine (41, 54, 103), both in the same observer and between different observers, have made it necessary to add other imaging examinations. Depending on availability and preference, the traditional choice has been between bone scintigraphy, conventional tomography, and CT. Scintigraphy is marked by a high sensitivity (36, 77, 84), but its initially high expectation could not be fulfilled because of low specificity (26, 37, 45, 53). Conventional tomography (27, 74, 105) and CT (13, 16, 32, 38, 99, 102), in contrast, have a high sensitivity and a high specificity. Since scintigraphy, conventional tomography, and CT are associated with radiation exposure and deliver a relatively high dose to pelvic organs, especially to the female gonads, they were often used restrictively for the initial diagnostic work-up in children with sacroiliac complaints and for following young patients with known rheumatoid arthritis of the sacroiliac joints. MRI offers imaging without ionizing radiation for diagnosing inflammatory, degenerative, septic, traumatic, and neoplastic changes of the sacroiliac joints. Using an optimal field strength of 1.5 T and a body array coil or a body coil, the patients are examined supine with the legs elevated. The initial acquisition is obtained in the sagittal plane with the following parameters: TR = 200 msec/TE = 15 msec, matrix [MA] = 128 × 128, FOV = 400 mm, number of sections [No] = 5, section thickness [SL] = 8 mm, image averaging = acquisition [Ac] = 1. This is followed by oblique axial sections that are angulated 30–40 degrees to the body axis and parallel to the long axis of the sacrum (Fig. 14.1). T1- weighted SE sequences (TR = 500 msec/TE = 15 msec, MA = 256 × 256, FOV = 220–300 mm, No = 12, SL = 5 mm, Ac = 2, acquisition time about 4 minutes) and T2- weighted (TR = 125 msec/TE = 12 msec, flip angle = 30 degrees, MA = 256 × 256, FOV = 220–300 mm, No = 12, SL = 5 mm, Ac = 4, acquisition time about 4 minutes) are used. To avoid artifacts, the signal processing uses a left-to-right phase-encoding gradient. Fig. 14.1 Sagittal scout view with markings of ten oblique axial sections parallel to the longitudinal axis of the sacrum, nearly perpendicular to the sacroiliac joint surfaces (Fig. 14.3). After selection of a representative section through the center of the joint, a dynamic study can be obtained with a T1-weighted opposed phase GRE sequence (TR = 50 msec/TE = 12 msec, flip angle = 70 degrees, MA = 256 × 256, FOV = 220–300 mm, No = 1, SL = 5 mm, Ac = 4). By averaging 4 acquisitions per image, it will take 50 sec to acquire this sequence (delay time 2 sec). After an interval of 52 sec (delay time 2 sec), the dynamic study is obtained with eight repetitions and a total acquisition time of 7 minutes. Between the first and second measurements, 0.1 mMol Gd-DTPA/kg body weight is injected as a bolus through an indwelling catheter and flushed with a 0.9% NaCl solution. Quantitative Evaluation. The dynamic acquisition is quantitatively evaluated by measuring the signal intensity of circular (1–10 mm2) or user-drawn regions of interest (ROIs) placed over the articular cartilage, joint capsule and periarticular bone marrow. The ROIs are optimally placed over the areas of maximum enhancement, which are selected by subtracting the pre-contrast image from the last post-contrast image. An enhancement-time curve is obtained for the cavity and capsule of each sacroiliac joint as well as for the respective subchondral iliac and sacral bone marrow, and is used for calculating the percentage of maximal enhancement above the pre-contrast signal intensity, the enhancement factor Fenh, and the rate of enhancement, the enhancement slope Senh: SIpre corresponds to the pre-contrast signal intensity and SImax to the curve point of the peak post-contrast signal intensity before entering the plateau. Tmax is the time interval in minutes from the injection of contrast medium to SImax . The sacroiliac joints are composed of two parts, the true joint and a strong retroarticular ligamentous attachment between the two bones (Fig 14.2). The true joint, a synovial joint, comprises the anteroinferior half to two-thirds of the joint. The articular surfaces are covered with cartilage and separated by a joint space. The exclusively hyaline cartilage layer of the sacral surface measures about 3 mm in thickness and the mixed hyaline and fibrocartilage layer of the iliac surface only 1 mm. The relative thickness of the overlying cartilage explains why disease processes tend to involve the iliac subchondral bone first. Posterosuperiorly the retroarticular space between the ilium and sacrum contains adipose and loose connective tissue. Through this run strong interosseous ligaments joining the two bones together. There is no overlying cartilage covering the bony surfaces at this point. The joint is further strengthened anteriorly by anterior sacroiliac ligaments and posteriorly by the sacrospinous and sacrotuberous ligaments. The sacroiliac joint is innervated by dorsal branches of the S1 and S2 spinal nerves (28, 27). The dorsal ligaments also receive dorsal branches of the S3 and S4 spinal nerves. After leaving the dorsal sacral foramina, the dorsal branches of the S1–S4 spinal nerves pierce the dorsal ligamentous complex, give off tiny branches to the sacral origin of the gluteus maximus and continue as medial cunial branches to the skin. The sacroiliac joints receive their vascular supply from branches of the iliolumbar artery, lateral sacral arteries, and superior and inferior gluteal arteries (28). Within the posterosuperiorly located retroarticular space, MRI (1, 8, 9, 10, 42, 75) shows punctate areas of low-signal intensities amidst high-signal tissue (Fig. 14.3), corresponding to interosseous ligaments traversing adipose connective tissue. The synovial compartment of the sacroiliac joint, which is anterior and extends inferiorly, has a characteristic morphology on MRI: the T1-weighted images display the ilial and sacral cartilage as a smoothly outlined, homogeneous structure of intermediate signal intensity along the signal-void subchondral cortex. Owing to its fat content, the periarticular bone marrow has an intermediate to high signal intensity (34). The articular cartilage is visualized as a relatively smoothly delineated, homogeneous structure of high signal intensity on the T2 *-weighted GRE images and is distinguished by its high contrast relative to the subchondral and juxta-articular regions on the opposed-phase images. The joint space may be partially visualized (Fig. 14.4) between the 3 mm thick sacral and 1 mm thick iliac cartilage layer. Small triangular signal voids on the iliac side of the anterior joint space (Fig. 14.4) represent physiologic hyperostoses of the ilium, most likely as adaptation to the localized weight load on the sacroiliac joints in the upright position. Fig. 14.2 Transverse section of an anatomic specimen of the pelvis at the level of the first sacral element: the sacroiliac joints are formed by the lateral masses of the sacrum (S) and by the ilium. The joint is composed of the anteroinferiorly located synovial compartment (curved arrows) and the posterosuperior located fibrous retroarticular space (arrowheads). Fig. 14.3a–f The MR anatomy of a 34-year-old male subject, as seen on T1-weighted images (left) and corresponding T2 *-weighted images (right), cranial (section level 14 in Fig. 14.1) to caudal (section level 19 in Fig. 14.1), using contiguous 5 mm sections. 1 = Gluteus maximus 2 = Gluteus medius 3 = Gluteus minimus 4 = Iliacus 5 = Psoas 6 = Piriformis 7 = Common iliac artery 8 = Common iliac vein 9 = Inferior gluteal artery and vein C = Coccyx I = Ilium L = L5 vertebral body M = Sacral lateral mass S = Sacrum with four sacral elements and four neural foramina with visualization of the nerve roots S1–S4
Introduction
Examination Technique
Anatomy
 General Anatomy
 Specific MRI Anatomy
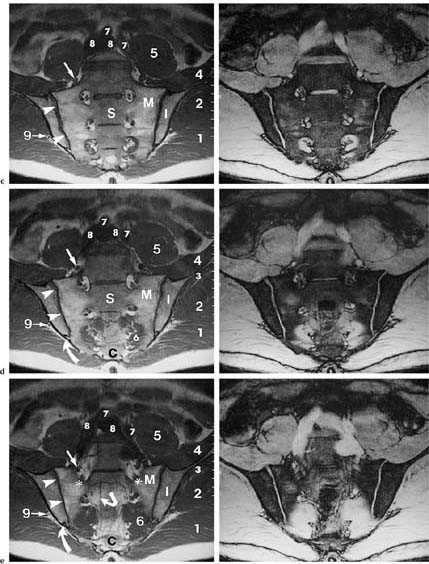
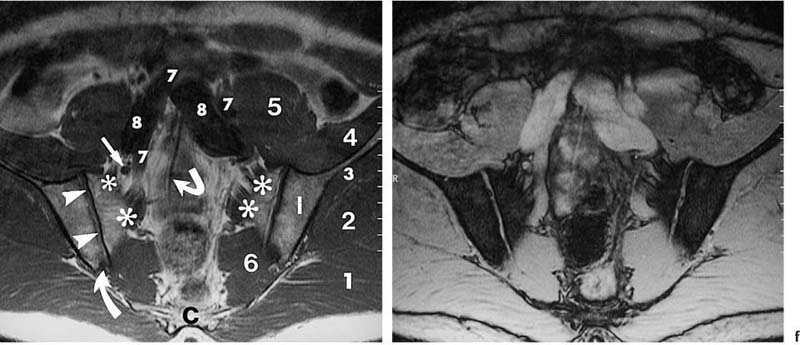
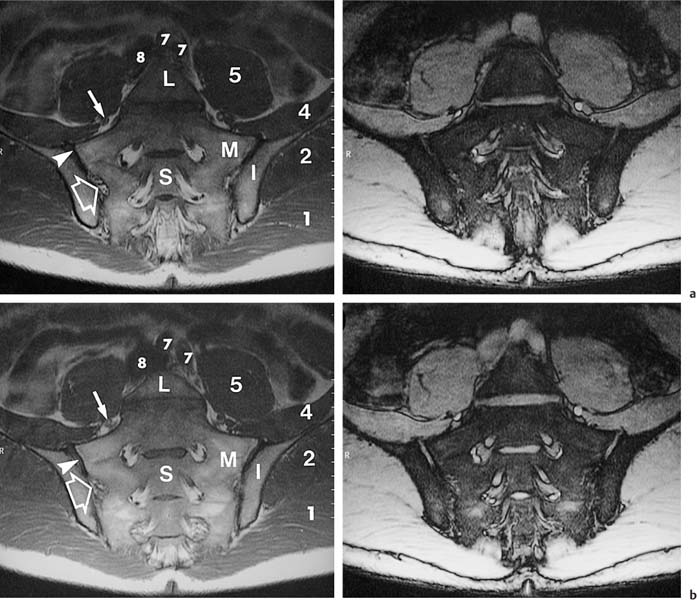
Asterisks | = Sacral plexus: the sacral branches S1–S3 exit the sacral foramina anteriorly and, together with the lumbosacral trunk (portion of the fourth and fifth lumbar branches), form the sacral plexus, from which the sciatic nerve arises as the major nerve. |
Arrows | = Femoral nerve |
Curved arrows | = Median sacral artery |
Angulated arrows | = Inferior paraglenoid sulcus (synonym: juxta-articular sulcus): insertion of the fibrous anterior joint capsule at the ilium and sacrum; a superior sulcus is less frequently visualized. |
Open arrows | = Fibrous compartment of the sacroiliac joints: fatty retroarticular space traversed by low signal interosseous ligaments. |
Arrowheads | = Synovial cartilage compartment of the sacroiliac joints, seen as intermediate signal intensity on T1-weighted images and high signal intensity on T2-weighted images; the caudal sections show low signal defects corresponding to the joint space. |
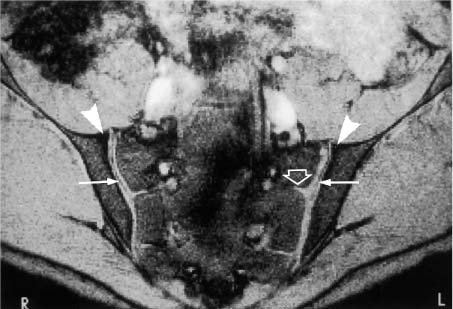
Fig. 14.4 Normal MR anatomy of the sacroiliac joints in a 14-year-old boy (pre-contrast T2 *-weighted GRE sequence TR = 125 msec, TE = 12 msec, flip angle = 30 degrees). The joint space is seen bilaterally as a low-signal line (arrows). Physiologic triangular hyperostotic area of the ilium bilaterally (arrowheads). The epiphyseal junctions of the sacral alae (open arrows) show partial ossification medially.
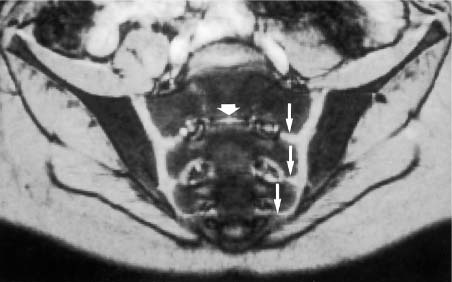
Fig. 14.5 Normal MR anatomy of the sacroiliac joints of a 10-year-old boy (pre-contrast T2 *-weighted GRE sequence TR = 125 msec, TE = 12 msec, flip angle = 30 degrees): Broad cartilaginous junctions (arrows) of the joints to the disk remnants of the sacrum (small thick arrow). These junctions correspond to the segmental apophyses, which arise from the costal ossification centers of the sacral segments S1 through S3 and are incorporated into the sacral ala.
Children have a different MRI morphology of the sacroiliac joints than adults. In children under the age of 16 years, a cartilaginous connection exists between the sacroiliac joints and the neural foramina of the sacral alae at the level of the sacral disk spaces (Fig. 14.5). These connections correspond to cartilaginous lines between the conjoined epiphyseal ossification centers of the S1–S3 costal elements (28, 63). After fusion with the corresponding transverse processes, they form the sacral alae. The S1 and S3 costal ossification centers are incorporated in the articular surface of either sacral ala.
This ossification process of the epiphyses of the lateral sacral elements is not completed until late adolescence. The articular cartilage of normal sacroiliac joints is avascular and nourished by diffusion. It lacks any relevant contrast enhancement on dynamic Gd-enhanced studies using the opposed-phase technique (8, 9, 10). The enhancement-time curves of normal bone marrow in the adult sacrum and ilium even show a phase-related initial decrease in signal intensity of about 20% followed by a slow return to the original values (12). After administration of contrast medium, the joint capsule, which is obscured by isointense surrounding structures on the pre-contrast image, can be seen in children as delicate linear structure due to enhancement (Fig. 14.6). No enhancement is generally observed in adults.
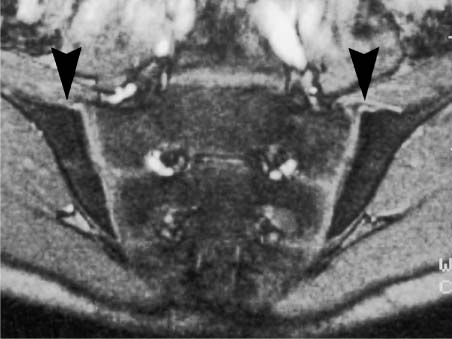
Fig. 14.6 Normal anatomy of a 12-year-old boy (post contrast T1-weighted GRE sequence TR = 50 m sec, TE = 12 m sec, flip angle = 70 degrees): After administration of contrast medium, the joint capsule is seen as a delicate linear enhancement (arrowhead). The anterior capsule can extend for several centimeters along the iliac periosteum.
Inflammatory Rheumatoid Conditions
 Classification and Clinical Findings
Spondyloarthropathy. Patients with known or suspected seronegative spondyloarthropathy constitute the largest group, some 95%, of all patients referred for MRI evaluation of the sacroiliac joints. Seronegative and HLA-B27-associated spondyloarthropathy (Fig. 14.7) is a heterogenic clinical entity of undetermined etiology (33, 64, 107). It includes well-defined subcategories, such as ankylosing spondylitis (23, 69, 70), psoriatic arthropathy (62, 101), arthropathy associated with chronic inflammatory intestinal diseases (enterocolic spondyloarthropathy) (88), reactive arthritis (e.g., Reiter syndrome) and unclassified spondyloarthropathy (33, 107). Ankylosing spondylitis is the most frequent and most characteristic spondyloarthropathy (23, 28, 69, 70). This chronic inflammatory systemic disease consists of an array of destructive and proliferative changes involving the axial skeleton, eventually leading to complete ankylosis. In 99% of the patients, ankylosing spondylitis begins with radiographic changes of the sacroiliac joints (28). To establish the diagnosis of ankylosing spondylitis in the presence of sacroiliitis, at least one of the three modified New York criteria must be present (69) (inflammatory spinal pain, limited motion in the lumbar spine, limited chest expansion) together with definite radiographic evidence of sacroiliitis that is higher than grade 2 and bilateral or higher than grade 3–4 and unilateral. The inflammatory sacroiliitis is consistently bilateral and symmetrical in ankylosing spondylitis and usually bilateral and asymmetric in psoriatic arthropathy. Reactive arthritis invariably presents with unilateral inflammatory involvement. In rare cases, radiographic changes of inflammatory sacroiliitis can be seen in rheumatoid arthritis (22, 28), Behçet disease (80), Lyme arthritis (97), and collagenous diseases (28), such as systemic lupus erythematosus, polyarteritis nodosa, polymyositis, dermatomyositis, and progressive scleroderma. Erosions, subchondral sclerosis and joint space narrowing including ankylosis of the sacroiliac joints frequently develop in so-called neurogenic paraosteoarthropathies (28) as part of hemi-, para-, and tetraplegia and rarely in metabolic diseases: gout, articular chondrocalcinosis (pseudogout), polychondritis, ochronosis, Gaucher disease, multicentric reticulohistiocytosis (lipoid dermatoarthritis), primary and secondary hyperparathyroidism, and Cushing disease (28).
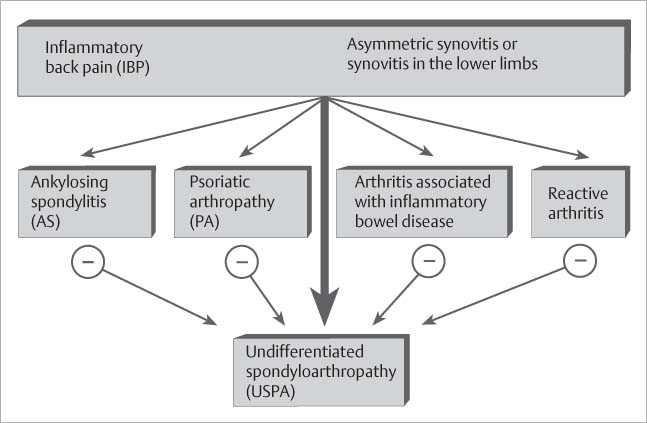
Fig. 14.7 Diagnostic diagram of seronegative spondyloarthropathy on the basis of criteria proposed by the European Spondylarthropathy Study Group.
Ankylosing Spondylitis (3, 29, 30). This can be seen as a special manifestation of spondyloarthropathy (Fig. 14.8). The reactions that induce the ‘variegated picture’ (28, 30) of erosions, subchondral sclerosis, and interarticular ankylosing buds fade in the second half of life. ‘The ossification of the sacroiliac joint capsule and anterior sacroiliac ligaments dominates at this stage’ (30).
Typical Clinical Presentation of Spondyloarthropathy. Spondyloarthropathies are characterized by synovitis, primarily involving the lower limbs, and so-called ‘inflammatory back pain’ (Fig. 14.7), which is defined as insidious onset of pain at rest and improved with exercise.
 MRI Findings
Subchondral Sclerosis (Figs. 14.9 and 14.10). This is seen as a rim of low signal intensity or signal void on all sequences and shows no contrast enhancement. During the early stages, the sclerotic changes are primarily on the iliac side and appear only later in the disease on the sacral side. With progression of the sclerosis, the joint space becomes increasingly indistinct. Further progression of the sclerosis leads to irregular joint space narrowing and eventually to ankylosis. Histopathologically, the sclerosis represents new bone formation as a reaction to persistent inflammation (14).
Juxta-articular Fat/Accumulation (Figs. 14.9 and 14.10). The juxta-articular bone marrow shows a patchy to diffuse accumulation of fat replacing active hematopoietic marrow. More fat is deposited in the iliac than in the sacral juxta-articular bone marrow, generally commensurate with the degree of chronicity. The deposited fat has a high signal intensity on the T1-weighted and an intermediate signal intensity on the T2 *-weighted images. With progressing chronicity, the fat tends to spread more diffusely and crosses the former joint space after complete ankylosis of the joint.
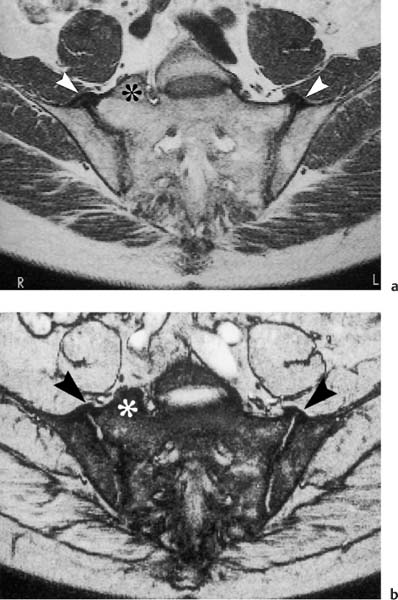
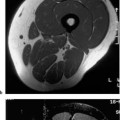
Fig. 14.8a, b a T1-weighted image (TR = 500 msec, TE = 15 msec, flip angle = 90 degrees) and b T2 *-weighted image (TR = 125 msec, TE = 12 msec, flip angle = 30 degrees). In a 57-year-old man with a five-year history of inflammatory back pain. The images are at the level of the transition of the retroarticular space to the synovial joint compartment, which is transected anteriorly and posteriorly (see anatomy, Fig. 14.3). Visualized bilateral ossification of the anterior joint capsule and the anterior sacroiliac ligaments (arrowhead). No relevant enhancement of either joint or joint capsule. Incidentally noted is a hemisacralization of the L5 vertebra on the right (asterisk). In addition to senile spondyloarthropathy, hyperostotic spondylosis should be considered in the differential diagnosis.
Erosions (Figs. 14.10–14.12). These enhance and show low signal intensity on the T1-weighted and a high signal intensity on the T2 *weighted images before administration of contrast medium. They interrupt the subchondral cortex and represent extensions of the joint space. Large (> 2 mm) or confluent erosions appear as so-called pseudo-widening of the joint space. Immunohistologic studies have documented that destructive pannus-like infiltrates fill the erosions (14).
Juxta-articular Osteitis (Figs. 14.10–14.12). The juxtaarticular bone marrow, which has a low signal intensity on unenhanced T1-weighted and intermediate signal intensity on T2
Related posts:


Stay updated, free articles. Join our Telegram channel

Full access? Get Clinical Tree


