Stage
Description
Primary tumor (T)
TX
Primary tumor cannot be assessed
T0
No evidence of primary tumor
T1a
Superficial tumor ≤5 cm in greatest dimension
T1b
Deepa tumor ≤5 cm in greatest dimension
T2a
Superficiala tumor >5 cm in greatest dimension
T2b
Deepa tumor >5 cm in greatest dimension
Regional lymph nodes (N)
NX
Regional lymph nodes cannot be assessed
N0
No regional lymph node metastasis
N1
Regional lymph node metastasis
Distant metastasis (M)
MX
Distant metastasis cannot be assessed
M0
No distant metastasis
M1
Distant metastasis
Grade (G)
GX
Primary tumor cannot be assessed
G1
Well differentiated
G2
Moderately differentiated
G3
Poorly or undifferentiated
Table 2
Stage grouping of STS
Group | Stage (group) | |||
T | N | M | G | |
IA | 1a plus 1b | 0 | 0 | 1 |
IB | 2a plus 2b | 0 | 0 | 1 |
IIA | 1a plus 1b | 0 | 0 | 2 or 3 |
IIB | 2a plus 2b | 0 | 0 | 2 |
III | 2a plus 2b | 0 | 0 | 3 |
Any T | 1 | 0 | Any G | |
IV | Any T | Any N | 1 | Any G |
Another problematic issue with the current staging system is that it is judged to offer little prognostic value for retroperitoneal sarcomas (Nathan et al. 2009). A review of outcome based on patients in the SEER database who had undergone resection for retroperitoneal sarcoma (RPS) suggested that histological subtype, histological grade, and tumor invasion of adjacent structures were associated with survival on multivariable analysis while tumor size had no prognostic value. Consequently, the AJCC T classification system demonstrated poor discriminatory ability. The authors concluded that the AJCC staging system for RPS is in need of revision.
3 Prognostic Factors
3.1 Histologic Grade
Histologic grade and tumor size are the primary determinants of clinical stage. In turn, overall TNM stage grouping has been shown to be predictive of outcome. Based on data from Memorial Sloan-Kettering Cancer Center (MSKCC), pathologic group stage was correlated with decreased disease-free survival (DFS) and overall survival (OS) for increasing stage in patients with extremity and trunk soft tissue sarcoma. Five-year DFS for Stages I, II, and III were 86, 72, and 52 %. Corresponding values for OS were 90, 81, and 56 % (Edge et al. 2010).
Another change to the 2010 7th edition of the AJCC Staging Manual is the move from a four-tier to a three-tier histologic grading system based on the degree of differentiation, mitotic activity, and necrosis. Investigators at the University of Texas M. D. Anderson Cancer Center (MDACC) reviewed the cases of 1,225 patients with localized sarcoma treated with conservative surgery and radiation (Zagars et al. 2003a, b). Tumor grade was stratified according to a three-tier system. High tumor grade was found to be a negative prognostic factor for local recurrence, metastatic recurrence, and disease specific survival. Patients with high grade tumors of greater than 5 cm fared worse than those with smaller tumors of similar grade (5-year metastatic control was 53 vs. 79 %, respectively).
3.2 Tumor Size
Investigators at Massachusetts General Hospital (MGH) retrospectively analyzed the cases of 220 patients with soft tissue sarcoma managed by radiation and surgery (Suit et al. 1988). They were also able to correlate size and grade with prognosis. For patients with grade 2 or 3 sarcomas, there was an increase in the frequency of distant metastases with size of the primary lesion; 6 % at less than or equal to 2.5 cm, 60 % at 15–20 cm, and 80 % at greater than 20 cm.
3.3 Anatomic Location
Anatomic site is also an important determinate of outcome. Patients with retroperitoneal, head and neck, and visceral sarcomas have an inferior overall prognosis compared with patients with extremity tumors. These were the findings by researchers at The Princess Margaret Hospital (PMH) where the cases of 389 patients with STS where reviewed (Levay et al. 1993). Extremity lesions fared more favorably compared to head and neck and torso lesions (p = 0.02) with respect to survival. Extremity and torso lesions had significantly better local control (p < 0.0001) than in the head and neck region where local failure was a common cause of death.
Investigators at MDACC also found site of disease to be a determinate of outcome (Pisters et al. 1996). Overall local control rates for STS of the extremity and superficial trunk, combined were 85 and 81 % at 5 years and 15 years, respectively, and were significantly superior to those for STS of the head and neck and the deep trunk (68 and 64 %, respectively). Interestingly, these findings could not be fully explained by margin status alone.
3.4 Lymph Node Status
Regional lymph node metastases (RLNM) are infrequently seen in patients with STS’s; on the order of 5 % (Mazeron and Suit 1987). There are, however, certain histologic subtypes with a greater propensity for nodal spread, remembered as the SCARE histologies (synovial, clear cell, angiosarcoma, rhabdosarcoma, epithelioid). The prognostic significance of RLNM has been debated (Fong et al. 1993).
Investigators at the Royal Marsden Hospital, U.K., studied the significance of RLNM’s in sarcoma patients entered in their prospective database (Behranwala et al. 2004). A total of 73 (3.4 %) of 2,127 patients had RLNM. The 1-year survival for patients with isolated RLNM was 77 %, compared with 36 % for patients who presented with RLNM and distant metastasis (p = 0.005). The 1-year survival for metachronous and synchronous RLNM was 94 and 68 % respectively (p = 0.05).
The MSKCC group published a similar analysis from their prospective database (Fong et al. 1993). From the 1,772 sarcoma patients evaluated, 46 (2.6 %) were identified with lymph node metastasis. Median follow-up of all patients from diagnosis of lymph node metastasis was 12.9 months. Median survival for non-survivors was 12.7 months. Thirty-one patients underwent radical, therapeutic lymphadenectomy with curative intent, whereas 15 patients had less than curative procedures, in most cases biopsy only. Patients not treated with radical lymphadenectomy had a median survival of 4.3 months, whereas radical lymphadenectomy was associated with a 16.3 month median survival and the only long-term survivors (46 % 5-year survival by Kaplan–Meier). The authors conclude that radical lymphadenectomy is appropriate treatment for isolated metastasis to regional lymph nodes and may provide long-term survival.
3.5 Age
It has long been postulated that older patients with STS have inferior outcomes because they present with larger, higher grade tumors, and tend to receive definitive surgery, chemotherapy, and RT less often (Farshadpour et al. 2005). However, at least some data suggest that older patients have higher rates of local recurrence and distant metastases not entirely accounted for by worse tumor characteristics at presentation or less aggressive treatment (Biau et al. 2011). In future sections, we will see that increasing age is a negative prognosticator for outcome.
3.6 Histologic Subtype
In a review of their prospective database, the MSKCC group found that patients with histologic subtypes fibrosarcoma and malignant peripheral-nerve tumor (MPNST) were at higher risk for local recurrence. Worse tumor-related survival was seen in patients with leiomyosarcoma (LMS) and MPNST (Pisters et al. 1996). Other investigators have found the subtype angiosarcoma to be associated with inferior survival, as well (Canter et al. 2010).
3.7 Depth of Invasion
In the most recent 2010 7th edition of the AJCC Staging Manual, superficial and deep tumors of equal size are now included in the same stage, eliminating the risk stratification for tumor depth seen in previous editions. This change is controversial, given the fact that numerous studies have revealed depth of invasion to be a risk factor for outcome (Pisters et al. 1996).
3.8 Margin Status
Given that surgical resection of the primary tumor is the mainstay of treatment for STS’s, the significance of margin status is an area of active clinical investigation. This topic is worthy of an in-depth discussion, which will take place in the next section on local control.
3.9 Nomogram for Sarcoma-Specific Death
In 2002, investigators at MSKCC published a post-operative nomogram they developed to predict the probability of 12-year sarcoma-specific death (Kattan 2002). Variables for the nomogram were identified from the cases of over 2,000 patients prospectively followed in their adult STS database. All patients were treated with surgical resection. Some patients received chemotherapy or radiation therapy. The variables considered for the basis of the nomogram were age at diagnosis, tumor size (≤5, 5–10, or >10 cm), histologic grade (high or low), histologic subtype (fibrosarcoma, leiomyosarcoma, liposarcoma, malignant fibrous histiocytoma, malignant peripheral nerve tumor, synovial, or other), depth (superficial or deep), and site (upper extremity, lower extremity, visceral, thoracic or trunk, retro intraabdominal, or head or neck).
Three nomogram development approaches were compared. With the first approach, Kaplan–Meier curves were plotted for all possible strata combinations. The second method utilized recursive partitioning. Because of limitations identified with these approaches, a third approach, Cox regression was explored. The advantage of this technique, according to the authors, is that all patients in the data set are potentially considered for each prediction.
The median follow-up overall, and for those patients still alive was 3.2 and 4 years, respectively (maximum follow up of 18 years). The 5- and 10-year disease-specific death probabilities were 25 and 35 %, respectively. The time interval of 12-year disease-specific death was chosen based on the maturity of the data (number of patients at risk). This appeared to be the most distant time point with many patients at risk (n = 176). The three modeling approaches were compared for their ability to reliably predict disease-specific death at 12 years. The bootstrap-corrected concordance indices (CI) were as follows: Kaplan–Meier, 0.69; recursive partitioning, 0.74; and Cox regression, 0.77.
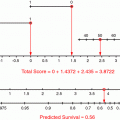
Because the Cox regression model seemed to predict disease-specific death most accurately, it was the basis for the prognostic nomogram. Each variable in the Cox model was associated with sarcoma-specific survival (p ≤ 0.01). The nomogram predicts the probability that the patient will die of sarcoma within 12 years of his initial surgery, assuming he or she does not die of another cause first (Fig. 1).
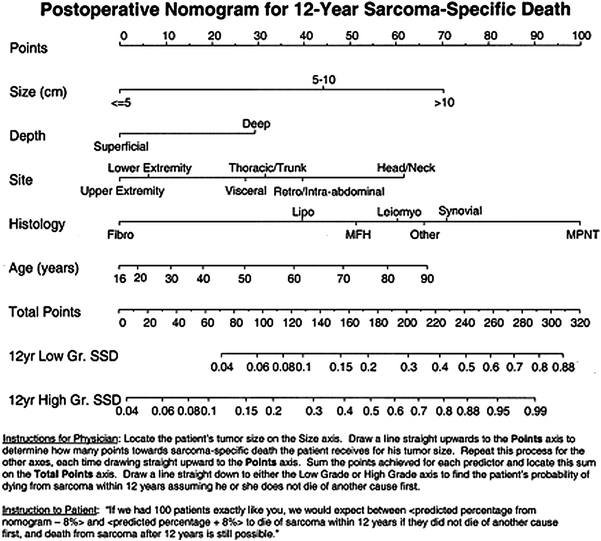

Fig. 1
Postoperative nomogram for 12-year sarcoma-specific death based on 2,163 patients treated at Memorial Sloan-Kettering Cancer Center. Abbreviations: Fibro indicates fibrosarcoma; Lipo, liposarcoma; Leiomyo, leiomyosarcoma; MFH, malignant fibrous histiocytoma; MPNT, malignant peripheral-nerve tumor; GR, grade; SSD, sarcoma-specific death. Kattan (2002)
Not only can the nomogram assist in decision-making regarding the use of adjuvant therapy and enrollment on clinical trial, it can also be employed when formulating a follow-up schedule. Those patients with lower risk disease may require less stringent surveillance. Reducing the number of follow ups and procedures may reduce stress levels for patients and health care costs for society. In their discussion, the authors note the inherent difficulty in studying one predictive variable at a time. In fact, moving a patient on one axis of the nomogram may also move him on another axis as well. Changing one variable, while holding the other constant may not be realistic and requires caution by the interpreter. The authors emphasize that the nomogram is not perfectly accurate, with an 8 % margin of error, on average. They indicate that better accuracy might be achieved with longer follow up, the addition of more patients, and the inclusion of novel predictive factors.
Investigators at UCLA applied the MSKCC nomogram to their own patient cohort in an attempt to validate predictive accuracy (Eilber et al. 2004). A population of 929 patients treated for primary STS at UCLA was used for the validation study. With median follow-up intervals of 48 months for all patients and 60 months for surviving patients, the 5- and 10-year disease-specific survival rates were 77 and 71 %, respectively. Application of the nomogram to the UCLA data set yielded a concordance index of 0.76.
It should be noted that the MSKCC nomogram was constructed using a binary tumor grading system (high grade, vs. low grade). Pathologic specimens at UCLA, however, are graded according to a three tier system. So in the current study, investigators entered patients with intermediate-grade disease into the nomogram twice—once as patients with low-grade disease, and then as patients with high-grade disease. For each patient, the two resulting predictions were averaged to obtain an ‘intermediate’ value. The implications of this methodology are unclear.
3.10 Retroperitoneal Sarcoma
Approximately 10–15 % of all STS’s arise in the peritoneum (Mendenhall et al. 2005). Because the retroperitoneum can often accommodate large tumors without symptoms, tumors tend to be large. In addition to tumor size, invasion into nearby structures makes complete resection difficult. Approximately 10–20 % of patients are found to have distant metastases on initial presentation (Stoeckle et al. 2001). Approximately two-thirds of tumors are either liposarcomas (LS) or leiomyosarcomas, with the remaining tumors distributed among a large variety of histologic subtypes (Lewis et al. 1998). Retroperitoneal liposarcomas are further classified into well-differentiated, dedifferentiated, and myxoid/round cell subtypes (Singer et al. 2003).
MSKCC published the largest series for retroperitoneal sarcoma (Lewis et al. 1998). Five hundred patients with retroperitoneal STS were treated and followed prospectively. Patient, tumor, and treatment variables were correlated with survival endpoints. The median age of patients was 58 years. Two hundred fourteen patients (43 %) were women and 286 (57 %) were men. The median follow-up was 22 months overall (40 months for survivors). Median survival was 72 months for those with primary disease, 28 months for those with local recurrence, and 10 months for those with metastasis. Most tumors (n = 319, 64 %) were high grade, and most (n = 301, 60 %) were >10 cm. The most common histologic subtype was liposarcoma (n = 206, 41 %), followed by leiomyosarcoma (n = 133, 27 %).
The analysis of local recurrence-free survival was confined to the 231 patients who presented to MSKCC with primary disease and then underwent resection. Local recurrence-free survival was 81 % at 2 years and 59 % at 5 years. Factors predictive for local recurrence included high histologic grade (p = 0.01) and liposarcoma histologic subtype (p = 0.01). Median survival after local recurrence was 28 months. Of the 61 patients in whom a first local recurrence developed, 35 (57 %) underwent complete resection. In the remaining 26 patients, there was residual gross disease after resection or their disease was unresectable. Complete resection was a significant variable predicting survival after local recurrence. The resection rate decreased after each subsequent local recurrence. After the second local recurrence the resection rate was 22 %, and after the third local recurrence it was 10 %.
Metastasis-free survival was 88 % at 2 years and 79 % at 5 years. Sites of metastasis included lung in 14 patients, liver in 10 patients, and lung and liver in four patients. Factors predictive for metastasis include high histologic grade (p = 0.01) and positive gross and microscopic margins of resection (p = 0.01). Median survival after metastasis was 13 months. On both univariate and multivariate analysis, unresectable disease (p = 0.001), incomplete resection (p = 0.001), and high histologic grade (p = 0.001) were predictive of disease-specific death.
For the group of patients where complete resection was achieved with gross negative margins (n = 185), median survival was 103 months. In contrast, the median survival in patients (n = 46) undergoing incomplete resection was 18 months. There was no significant difference in survival between patients whose disease was unresectable and those who underwent incomplete resection (p = 0.4). Patients with high-grade tumors had a median survival of 33 months, versus 149 months for those with low-grade tumors. The survival of patients with tumors >10 cm was consistently lower than those with smaller ones.
The MSKCC group carried out an additional analysis of 177 patients with primary retroperitoneal liposarcomas undergoing resection with curative intent (Singer et al. 2003). Breakdown of the histologic subtypes for the patients evaluated was as follows: 99 (56 %) with well-differentiated, 65 (37 %) with dedifferentiated, nine (5 %) with myxoid, and four (2 %) with round cell morphology. Multivariate analysis showed that dedifferentiated liposarcoma subtype was associated with a sixfold increased risk of death compared with well-differentiated histology (p < 0.0001). Retroperitoneal dedifferentiated liposarcoma was associated with an 83 % local recurrence rate and 30 % distant recurrence rate at 3 years. Incomplete resection (p < 0.0001), contiguous organ resection (excluding nephrectomy; p = 0.05), and age (p = 0.03) were also important independent prognostic factors for survival in retroperitoneal liposarcoma.
The MSKCC group also published a subtype-specific nomogram for patients with primary liposarcoma of the retroperitoneum extremity, or trunk (Dalal et al. 2006). Like the general postoperative sarcoma (GPS) nomogram discussed above, this one was developed using a Cox regression model. The independent predictors of disease-specific survival (DSS) were age, presentation status, histologic variant, primary site, tumor burden, and gross margin status. When DSS was stratified by primary site, patients with retroperitoneal tumors had a significantly inferior 12-year DSS, compared to tumors in other locations (upper extremity, 87 %; lower extremity, 82 %; truncal, 77 %). For those with LS of the retroperitoneum, the lowest DSS was seen in patients requiring resection of one or more contiguous organs (DSS of 32 %). While patients with retroperitoneal tumors not requiring contiguous organ resection had a 12-year DSS of 53 % (p = 0.0008). DSS was not significantly different between patients with microscopically negative and microscopically positive margins, suggesting that even patients in whom the sampled margins were histologically negative likely had tumor cells at the margins of resection if all margins could be histologically assessed with accuracy (12-year DSS of 74 and 68 %, respectively). Patients with grossly positive margins, however, fared worse (12-year DSS of 25 %; p < 0.0001). On multivariate analysis, independent predictors of DSS for the entire cohort (all tumor locations) were age (p = 0.008), presentation status (biopsy, no prior treatment, prior excision) (p = 0.004), primary site (p = 0.0008), histologic variant (p < 0.0001), tumor burden (p = 0.0001), and gross margin status (p < 0.0001).
Recall, that when the dataset was applied to the previously established GPS nomogram, the bootstrapping concordance index was 0.776. With the liposarcoma-specific nomogram (Fig. 2), the CI was 0.827. The authors attributed this improved predictive ability to several factors. First, in the LS nomogram, tumor burden was modeled as a continuous variable, as opposed to the three discrete categorical variables (less than 5, 5–10 cm, greater than 10 cm) used in the GPS nomogram. Second, in the LS model, tumor grade was determined by histologic subtype. Well-differentiated and myxoid LS subtypes were classified as low-grade; dedifferentiated, round cell, and pleomorphic LS subtypes were considered to be high grade. Revealed in the analysis, and displayed in the nomogram, is that myxoid LS has a worse prognosis than well-differentiated LS even though both are considered low grade. For high grade LS, the magnitude of worsening prognosis increases as subtype changes from dedifferentiated to round cell to pleomorphic. A third factor thought to be responsible for the improved predictive accuracy in the LS model, is that retroperitoneal LS’s were separated according to if contiguous organs were resected. As previously mentioned, patients undergoing these more extensive surgeries tended to fare worse. The inclusion of presentation status was also discussed. Patients with primary liposarcoma who presented with a previous resection/excisional biopsy had a significantly improved DSS. The authors suggested that this reflected a selection bias in that patients who underwent marginal resection due to technical reasons prior to referral to MSKCC were easier to remove completely; thus, reexcision may have been associated with a more favorable prognosis than those patients treated with core/incisional biopsy or referred without prior biopsy. Thus, inclusion of this variable potentially improved the concordance index of the model.
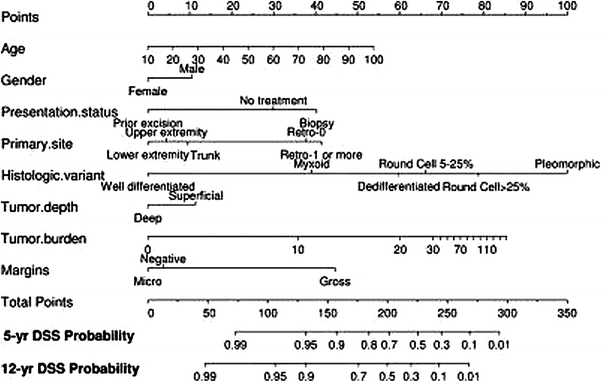

Fig. 2
Nomogram for predicting 5- and 12-year liposarcoma-specific survival probabilities. Dalal et al. (2006)

