Although electromyography is the gold standard for diagnosing muscle denervation, the role of muscle magnetic resonance (MR) imaging in the diagnosis of muscle denervation has gained clinical relevance. The MR imaging examination of newly denervated musculature shows edema. Conventional and quantitative muscle MR imaging techniques allow for the detection of subclinical disease progression as well as amelioration of the secondary features of nerve damage. In this review article, we present and discuss recent data on the role of conventional and quantitative MR imaging in the diagnosis and monitoring of muscle denervation as sequela of nerve damage.
Key points
- •
Anatomic knowledge of innervation of skeletal musculature is essential for identifying typical patterns of focal muscular denervation and/or muscle atrophy.
- •
The assessment and quantification of muscle involvement in neural diseases can identify specific patterns of involvement thus narrowing differential diagnosis and supporting clinical diagnosis.
- •
Compressive and entrapment neuropathies typically lead to localized changes, while systemic or inflammatory disease of the peripheral nervous system lead to multifocal muscular changes.
- •
An incomplete lesion of a nerve, without involvement of all its target muscles by signs of muscle denervation, may mimic a more distally located lesion.
Introduction
The aim of this review article is to give an overview of typical imaging patterns of muscle denervation in the context of clinical manifestations and electrophysiology. Of note, the focus of this article will be on imaging the muscular changes in the context of denervation, not on imaging the causative nerve lesions themselves. Neuromuscular imaging is increasingly being used for the diagnostic workup of patients with suspected acquired or inherited nerve damages as well as for identifying muscle denervation as sequela. , Recent review articles stressed the importance of dedicated imaging modalities such as ultrasound , and magnetic resonance (MR) imaging in the detection of muscle pathology such as muscle edema or edema-like changes, fatty degeneration, and atrophy, in order to support the clinical diagnosis and aid further diagnostic steps, such as guiding muscle biopsies. It has conclusively been demonstrated that neuromuscular imaging techniques can identify involvement patterns of muscle pathology (eg, fatty degeneration and atrophy) that are to a certain degree specific for certain disease entities coining the term “pattern recognition.” In particular, the diagnostic value of this approach has been demonstrated in the differential diagnosis of inherited muscle diseases, , as well as in providing a correct diagnosis or at least a narrowing down of possible differential diagnoses in suspected nerve damage. , Recent data suggest that the role of neuromuscular imaging goes far beyond the diagnostic stage and includes disease monitoring purposes, such as monitoring of disease progression as well as treatment efficacy and safety monitoring. , ,
Anatomic basics of the innervation of skeletal muscles
Voluntary movements through contraction of skeletal muscles are caused by the transmission of electrical action potentials from neurons of the cerebral motor cortex via descending corticospinal and corticobulbar pathways of the central nervous system and somatomotor fibers of the peripheral nervous system to the neuromuscular end plates. There, the synaptic transmission of the action potentials of the motor neuron to the muscle fiber takes place via neurotransmitters. , To assess motor neuropathies, knowledge of the innervation of the affected muscles is necessary, or appropriate literature must be consulted for this purpose. , , Tables 1 and 2 provide an overview of the radicular origin and target muscles of the most important motor nerves of the upper and lower extremities.
| Segments | Peripheral Nerve | Target Muscles |
|---|---|---|
| C4, C5 | N. dorsalis scapulae | M. levator scapulae M. rhomboideus minor M. rhomboideus major |
| C4, C5 | N. subclavius | M. subclavius |
| C4–C6 | N. suprascapularis | M. supraspinatus M. infraspinatus |
| C5, C6 | N. subscapularis | M. subscapularis (M. teres major) |
| C5–C7 | N. thoracicus longus | M. serratus anterior |
| C6–C8 | N. thoracodorsalis | M. latissimus dorsi M. teres major |
| C5–T1 | N. pectoralis lateralis (C5–C7) N. pectoralis medialis (C8, T1) | M. pectoralis major M. pectoralis minor |
| C5–C7 | N. musculocutaneus | M. coracobrachialis M. biceps brachii M. brachialis |
| C5–T1 | N. medianus (N. interosseus antebrachii anterior) | M. flexor digitorum profundus (II + III) M. flexor pollicis longus M. pronator quadratus |
| C5–T1 | N. medianus | M. pronator teres M. flexor carpi radialis M. palmaris longus M. flexor digitorum superficialis M. abductor pollicis brevis M. flexor pollicis brevis (Caput superficiale) M. opponens pollicis Mm. lumbricales (I + II) |
| C8, T1 | N. ulnaris | M. flexor carpi ulnaris M. flexor digitorum profundus (IV + V) |
| C8–T1 | N. ulnaris (Ramus superficialis) | M. palmaris brevis |
| C8–T1 | N. ulnaris (Ramus profundus) | M. adductor pollicis M. flexor pollicis brevis (Caput profundum) M. abductor digiti minimi M. flexor digiti minimi brevis M. opponens digiti minimi Mm. lumbricales (III + IV) Mm. interossei dorsales Mm. interossei palmares |
| C5–C7 | N. axillaris | M. deltoideus M. teres minor |
| C5–T1 | N. radialis | M. triceps brachii M. anconeus M. brachioradialis M. extensor carpi radialis longus |
| C5–T1 | N. radialis (Ramus profundus) | M. extensor carpi radialis brevis M. extensor digitorum M. extensor digiti minimi M. extensor carpi ulnaris M. supinator M. abductor pollicis longus M. extensor pollicis brevis M. extensor pollicis longus M. extensor indices |
| Segments | Peripheral Nerve | Target Muscles |
|---|---|---|
| L1–L4 | N. femoralis | M. iliopsoas (M. psoas + M. iliacus) M. pectineus (partially) M. sartorius M. quadriceps femoris (M. rectus femoris, M. vastus lateralis, M. vastus intermedius, M. vastus medialis) |
| L2–L4 | N. obturatorius (Ramus anterior) | M. pectineus (partially) M. adductor longus M. adductor brevis M. gracilis |
| L2–L4 | N. obturatorius (Ramus posterior) | M. obturatorius externus M. externus M. adductor magnus M. adductor minimus |
| L4–S1 | N. gluteus superior | M. gluteus medius M. gluteus minimus M. tensor fasciae latae |
| L5, S1 | N. musculi piriformis | M. piriformis |
| L5, S1 | N. obturatorii interni | M. obturatorius internus M. gemellus superior M. gemellus inferior |
| L4–S1 | N. musculi quadrati femoris | M. quadratus femoris |
| L5–S2 | N. gluteus inferior | M. gluteus maximus |
| L4–S3 | N. ischiadicus | M. biceps femoris (Caput breve) |
| L4–S3 | N. fibularis superficialis | M. fibularis longus M. fibularis brevis |
| L4–S3 | N. fibularis profundus | M. tibialis anterior M. extensor digitorum longus M. fibularis tertius M. extensor hallucis longus M. extensor hallucis brevis M. extensor digitorum brevis |
| L4–S3 | N. tibialis | M. semitendinosus M. semimembranosus M. biceps femoris (Caput longum) M. adductor magnus (partially) M. triceps surae (M. soleus and M. gastrocnemius) M. plantaris M. popliteus M. tibialis posterior M. flexor digitorum longus M. flexor hallucis longus |
| L4–S3 | N. plantaris medialis | M. abductor hallucis M. flexor hallucis brevis (Caput mediale) M. flexor digitorum brevis Mm. lumbricales (I + II) |
| L4–S3 | N. plantaris lateralis | M. abductor hallucis M. quadratus plantae M. flexor hallucis brevis (Caput laterale) M. abductor digiti minimi M. opponens digiti minimi M. flexor digiti minimi brevis Mm. lumbricales (III + IV) Mm. interossei dorsales Mm. interossei plantares |
Definition of neurogenic myopathies
Neurogenic myopathies are, in contrast to myogenic myopathies, secondary diseases of the muscles caused by a primary pathology of the innervating nerves, regardless of the etiology of the nerve damage. Thus, the so-called neurogenic myopathies are also an extremely heterogeneous group, the common feature of which is denervation, that is, the impairment of the neural innervation of the respective target muscles. In contrast to immunogenic myositis and hereditary myopathies, muscle biopsy is not indicated to confirm the diagnosis of neurogenic myopathies. Neurogenic myopathies manifest themselves as weakness of the muscles innervated by damaged nerves. Focal neurogenic muscle weaknesses can occur acutely as part of focal neural injuries or slowly progressive as part of compression neuropathies. Diffuse slowly progressive, possibly bilateral muscle weaknesses can occur as part of systemic and/or metabolic disorders, for example, diffuse polyneuropathies. Inflammatory or neoplastic processes of nerves can also lead to paresis of the target muscles.
Pathophysiology of muscle denervation and reinnervation
The denervation of a skeletal muscle can be complete (eg, if the entire innervating peripheral nerve is damaged) or partial. Partial denervation can be regional or diffuse. The extent of the functional limitation, that is, the clinical manifestation of the loss of strength, ultimately depends on the degree of damage to the innervating nerve, so that in the case of minor and partial damage, this can be subclinical or, in the case of complete transection of the nerve, can lead to complete denervation with paralysis. , The muscle edema in denervation is caused by widening of intramuscular capillaries and a consecutive increase of extracellular fluid, and it can be detected after denervation using MR imaging as early as 24 hours, reaching its maximum about 4 weeks after denervation. In addition to conventional fluid-sensitive sequences, diffusion-weighted imaging is also useful for assessing muscle denervation with the increase in apparent diffusion coefficient that corresponds to the increase of extracellular water. , Furthermore, denervated musculature shows gadolinium-enhancement, which can be detected about 24 hours after the denervating event as well. MR perfusion imaging is capable of detecting increased perfusion in denervated muscles, compared to normal musculature.
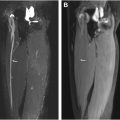
If reinnervation is successful, the muscular signal alterations regress ( Fig. 1 ). For example, Viddeleer and colleagues conducted MR imaging follow-up examinations on patients with complete traumatic transection of the median or ulnar nerves 1 month and 3, 6, 9, and 12 months after surgical nerve reconstruction. The STIR signal intensities of the target muscles were correlated with the functional outcome after 12 months. It was shown that after 6, 9, and 12 months, there were significant differences between the group with good and poor outcome: In the group with good functional outcome, the STIR signal hyperintensities of the target muscles regressed, but in the group with poor functional outcome, they persisted.

Conventional MR imaging protocols
Numerous MR imaging studies on rather frequently inherited and acquired muscle disease entities have conclusively demonstrated the value of conventional MR imaging techniques as a tool for diagnostic and disease purposes. In the early years, MR imaging acquisition was limited to certain anatomic regions, preferably the lower extremities. Driven by the advantages of MR imaging acquisition techniques including higher magnetic field strengths and innovations in coil technology such as multichannel coils, as well as parallel imaging techniques that altogether enable a whole-body MR acquisition with a high temporal and spatial resolution, the role of MR imaging in muscle disorders has evolved. In order to achieve a high degree of reproducibility particularly for longitudinal assessments of disease progression and treatment efficacy monitoring, a clinically relevant issue is the standardization of image acquisition that includes the selection of pulse sequences, spatial resolution, and the repositioning of the patients. , In Germany, a consensus on how to use MR imaging for the assessment of inherited and/or acquired muscle diseases has been published recently. Most studies and clinical protocols mainly include MR acquisition in the axial plane including T1-weighted (fast/turbo spin echo) sequences for the assessment of muscle morphology (eg, atrophy and fatty degeneration) and fat suppressed T2-weighed (fast/turbo spin echo) sequences for the assessment of muscle edema or edema-likes changes such as inflammation. Contrast-enhanced T1-weighted fat-suppressed images are not recommended on a regular basis and should be limited to certain indications such as suspected infectious or neoplastic. , The spatial resolution has to be adjusted according to the specific clinical situation. For the assessment of dystrophic and edema-like muscle changes, which are, for instance, typically encountered in patients with acute muscle denervation, a slice of thickness 5 to 8 mm, interslice gap 1 to 2 mm, and in-plane resolution of 1 to 2 mm may be sufficient. Therefore, the use of the standard body coil can be sufficient to obtain adequate image quality. However, surface coils are useful in order to increase signal-to-noise ratio and improve the image quality. ,
Quantitative MR imaging protocols
In addition to the use of visual rating scales, muscle MR imaging can assess the degree of muscle degeneration by quantitative measures. Quantitative MR imaging (qMR imaging) measures are valuable for monitoring disease progression and to guide nonoperative and operative management. , The detection of subclinical disease progression, especially for those muscles that are not easily accessible to clinical examination, the monitoring of the natural history of disease, and monitoring potential therapeutic effects by using qMR imaging may be especially valuable in clinical trials. In addition to conventional MR imaging, qMR imaging techniques are increasingly involved in the quantification of muscle disease burden. The reliable fat quantification is crucial for disease monitoring purposes. One qMR imaging technique is the DIXON technique or multiecho chemical-shift encoded water-fat imaging. In 1984, Dixon published a first article on a simple spectroscopic imaging technique for water and fat separation. The technique acquires 2 separate images with a modified spin-echo pulse sequence. One is a conventional spin-echo image with water and fat signals in-phase and the other is acquired with the readout gradient slightly shifted so that the water and fat signals are 180° out-of-phase. Dixon showed that from these 2 images, a water-only image and a fat-only image can be generated. The water-only image by the Dixon’s technique can serve the purpose of fat suppression, an important and widely used imaging option for clinical MR imaging. Additionally, the availability of both the water-only and fat-only images allows for direct image-based water and fat quantitation.
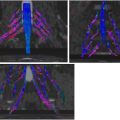
The potential that the Dixon technique is highly insensitive to magnetic field inhomogeneity and allows for water and fat quantitation has generated substantial research interests and efforts from many investigators. Using Dixon-type sequences (eg, a multiecho chemical-shift-encoded water-fat imaging sequence with repetition time/echo time in milliseconds of 50/2.46 and 3.69), the muscle fat fractions (MFFs) can be calculated by positioning region of interests (ROIs) on different muscles on the Dixon-type images. After conducting ROI analysis on both water ( w in the following equation) and fat ( f in the following equation) images, the MFF (in the following equation) can be calculated as follows: MFF = f/(f + w). In periodic paralyses, a strong correlation between the degree of muscular edema and MFF has been reported when compared with muscular 23 Na concentration and normalized 35 Cl signal intensity substantiating the link between ion overload and cell damage in muscle tissue. , A second approach used to reliably assess disease activity and fatty degeneration includes T2 mapping of skeletal muscle without fat suppression (global T2) and with fat suppression techniques (water T2). , Other promising techniques besides the quantitative T2-relaxation measurements using multicontrast turbo-spin-echo sequences, are diffusion tensor imaging, blood oxygen level-dependent imaging, and multinuclear imaging including 35 Cl and 23 Na MR imaging. , , These techniques have been applied in healthy and diseased skeletal muscle tissue recently, but require further validation in larger studies. These sensitive quantitative techniques could be of particular interest in nondystrophic muscle disease, such as periodic paralysis, with normal conventional MR imaging findings, but also in Duchenne muscular dystrophy to detect altered ion homeostasis in dystrophic muscle cells. , , The role of nonproton MR imaging in muscle denervation has not been published.
MR imaging reading and interpretation
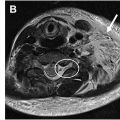
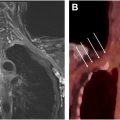
The image analysis of neuromuscular MR imaging for the diagnosis and monitoring of acute or chronic muscle denervation ( Fig. 2 ) as secondary imaging features of nerve damage includes the following aspects, which are basically the same as when evaluating myopathies in general:
- •
Muscle shape: for example, normal configuration and deformation
- •
Muscle size: for example, normal, atrophic, and hypertrophic
- •
Focal or diffuse muscle tissue changes: for example, signs of (fatty) degeneration and muscle edema
- •
Focal lesion(s): calcifications and soft/mixed tissue lesions

Related posts:
 Plexus and Peripheral Nerve MR Imaging: Advances and Applications
 Whole-Body Magnetic Resonance Neurography—Technique, Current Perspectives, and Future Directions
 Classification of Peripheral Nerve Injury
 MR Imaging of Diffuse Peripheral Neuropathy
 MR Imaging of Peripheral Nerve Sheath Tumors
 Head and neck
Stay updated, free articles. Join our Telegram channel

Full access? Get Clinical Tree


