Fig. 24.1
Summary diagram of primate serotonergic system. Main nuclei are indicated by initial letters and fibre pathways are shaded. Am amygdaloid nucleus, C cerebellum, Hip hippocampus, Hyp hypothalamus, Sep septum, SN substantia nigra, Str striatum, Tha thalamus (Jacobs and Azmitia 1992)
24.1.2.1 Release and Extracellular Concentrations
Exocytotic release of 5HT from the storage vesicles upon nerve firing is regulated by inhibitory 5HT1A (somatodendritic) and 5HT1B (located on nerve terminals) autoreceptors. It is possible that 5HT1B and/or 5HT1D receptors in the midbrain raphe nuclei also contribute to the regulation of the rate of nerve firing (Stenfors and Ross 2004).
Based on the turnover rate and the measured extracellular concentration of 5HT in the rat striatum (Kalen et al. 1988), very little of the released 5HT is present in the extracellular space. The main factors that regulate the 5HT concentration in the synaptic cleft at the serotonergic nerve terminals and thereby also the concentrations of extracellular 5HT are shown in Fig. 24.2.
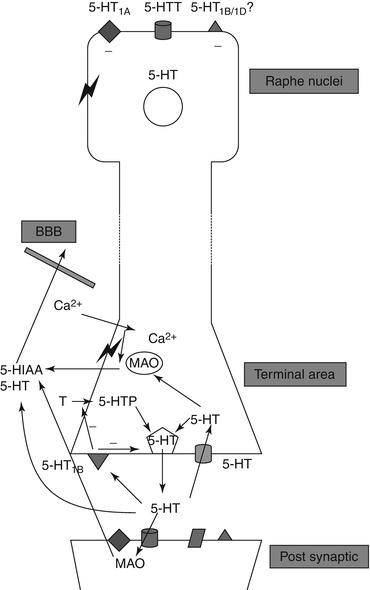
Fig. 24.2
Schematic illustration of factors that determine 5HT concentration in the extracellular space (Stenfors and Ross 2004)
Most of the released 5HT is transported back into the nerve terminals by transporter proteins in the cell membrane. This 5HT transporter is the target for the widely prescribed drug class of SSRIs that increase 5HT neurotransmission but decrease the activity of the 5HT neuron itself (Fuller 1994; White et al. 2005). Both effects occur because the increased concentration of 5HT in the synapse is increased by the uptake inhibition, resulting in increased activation of postsynaptic receptors on target neurons (leading to various functional changes) and increased activation of presynaptic autoreceptors (which leads to decreased 5HT synthesis and firing of the 5HT neuron itself, presumably also to decreased 5HT release).
The 5HT molecules, which have been transported back into the neuron, are either stored in vesicles or captured by mitochondrial monoamine oxidase (MAO) and deaminated to 5-hydroxyindoleacetic acid (5HIAA). This metabolite is not stored in the neurons but passes to the extracellular space and leaves the brain via an active acid transport mechanism.
5HT and 5HIAA in the extracellular space originate mainly from serotonergic nerves (Kalen et al. 1988; Sharp et al. 1989; Sharp and Foster 1989). Changes in the extracellular 5HT concentrations are therefore regarded as reflecting changes in 5HT release. The effect of 5HT-releasing drugs, such as fenfluramine (which increases both 5HT release and extracellular 5HT concentrations), is assessed as a balanced effect since the compounds increase extracellular 5HT concentrations while resulting in an adaptive decrease in 5HT release.
24.1.2.2 Biosynthesis
5HT is formed in a two-step reaction starting with tryptophan being taken up in neurons by an amino acid carrier-mediated transport mechanism (Pardridge 1998). The barrier across cell membranes, including the BBB, expresses the sodium-independent L system transporter (Pardridge and Oldendorf 1977).
The amino acid is then hydroxylated into 5-hydroxytryptophan (5HTP) by the action of tryptophan hydroxylase-2, expressed predominantly in serotonergic neurons of the raphe nuclei (Walther et al. 2003; Zhang et al. 2004). The overall tryptophan concentration in the human brain of 30 μM (Fernström and Wurtman 1971; Young and Gauthier 1981; Young et al. 1977) is about equal to the half-saturation concentrations (K m) for the enzyme (Friedman et al. 1972).
Finally, 5HTP is decarboxylated into 5HT by aromatic L-amino acid decarboxylase (AADC). AADC is mainly localised in 5HT- and catecholamine-containing neurons in the CNS (Hokfelt et al. 1973). The recombinant human AADC also catalyses the decarboxylation of L-DOPA to dopamine (Sumi et al. 1990). The K m for the enzyme is 5–270 μM (Ota et al. 1990; Zhu and Juorio 1995) and is much higher than the overall 5HTP concentration in the monkey brain of 3–30 nM (Brown et al. 1979).
AADC activity is present in brain extracts in far greater amounts than tryptophan hydroxylase (Ichiyama et al. 1968), and for this reason, the hydroxylation of tryptophan rather than the decarboxylation of 5HTP is presumed to be the rate-limiting step in 5HT formation. The fact that 5HTP is found only in trace amounts in brain tissue (Tappaz and Pujol 1980) indicates that it is decarboxylated almost as rapidly as it is formed and also suggests that the hydroxylase step is rate limiting in 5HT formation.
24.1.3 Methods to Study Biosynthesis
There are in vitro models of the 5HT system that allows measurement of 5HT synthesis or enzyme activities. These models use, e.g., homogenates, tissue slices or synaptosomes. In vivo methods are preferable for quantitative measurements as release and biosynthesis take place at multiple sites within the CNS and also seem to be regulated in a complex manner.
One quantitative in vivo method that has been used for studying both neurotransmitter release and biosynthesis is PET.
24.1.3.1 Methodological Considerations
The design of a successful imaging probe is critical and can be a bottleneck (Laruelle et al. 2003). Several aspects need to be considered before performing a PET experiment in order to obtain quantitative measurements in the brain.
From the viewpoint of radiochemistry, the half-life of the positron-emitting isotope must be chosen to match the timescale of the process being probed. A rapid tracer synthesis by the chemists must also be feasible, due to the short half-lives of most positron-emitting nuclides. Typically one molecule out of 1,700–34,000 is made radioactive in the labelling of a probe with [11C]. In most applications, the tracer dose (i.e. sum of labelled and unlabelled molecules) introduced to the system is assumed to be negligible so that it does not affect or perturb the system by changing endogenous biomolecule concentrations. It is important that the candidate probe can be radiolabelled with as high amount of radioactivity per amount of probe substance (specific radioactivity) as possible. A high specific radioactivity means that a low mass of the probe can be administered and can still provide a sufficient strong radioactivity signal.
From a pharmacokinetic perspective, the labelled probe should cross the BBB but its metabolism should not result in the formation of radiolabelled compounds that enter the brain. Otherwise, the background signal from accumulating metabolites may interfere with the desired signal from the parent molecule. To determine the time-dependent amount of intact tracer available for brain uptake, blood samples can be drawn during the PET scan. These samples are typically analysed using liquid chromatography allowing the radioactivity from the parent compound to be separated from metabolites. The ratio of parent tracer radioactivity to total plasma radioactivity as a function of time reflects the amount of intact probe available for brain uptake which is important information for further quantification. Metabolism within the brain can be measured in samples of excised brain tissue or be assessed in vivo by studying the impact of pharmacological challenges.
The ratio of target to nontarget localisation of the radiotracer within tissue is critical. The higher the ratio, the more likely it is that the signal can be used to measure changes in receptors or transporters available caused by disease or drug treatment. Non-specific binding is one crucial factor that affects the target to nontarget ratios. Usually, radioactivity in a brain region devoid of target receptors is used as an estimate of non-specific binding. The ideal reference region should have similar free and non-specific binding properties as brain regions with specific binding. These properties are tracer dependent and will vary depending on the characteristics of the macromolecules in the brain that non-specifically bind the radioligand.
Finally, the affinity of a radiotracer must represent a compromise between the need to acquire a high signal-to-noise ratios and the need to finish the measurements (exclude) in a reasonable period of time (Laruelle et al. 2003).
24.2 Modelling in PET
PET tracer kinetic data could be evaluated by techniques that broadly can be divided into model-driven methods and data-driven methods (Gunn et al. 2002). The clear distinction is that data-driven methods such as graphical analysis require no a priori decision about the most appropriate model structure. Instead, this information is obtained directly from the kinetic data.
24.2.1 Models
Because of the statistical limits of the data, and because PET measures only the sum of the radioactivity across all compartments, the models for data analysis must be simple (Koeppe 2002). Most PET radioligands can support models with two to maximally six parameters under the best of circumstances.
Well-established models in PET include those for quantification of blood flow (Kety and Schmidt 1948), cerebral metabolic rate of glucose (Sokoloff et al. 1977) and neuroreceptor ligand binding (Mintun et al. 1984). Those are plasma input models which in PET often are considered related as a gold standard (Gunn et al. 2001). Further developments have created a series of reference tissue models that avoid the need for blood sampling (Blomqvist et al. 1989; Cunningham et al. 1991; Hume et al. 1992; Lammertsma et al. 1996; Lammertsma and Hume 1996) (Fig. 24.3).
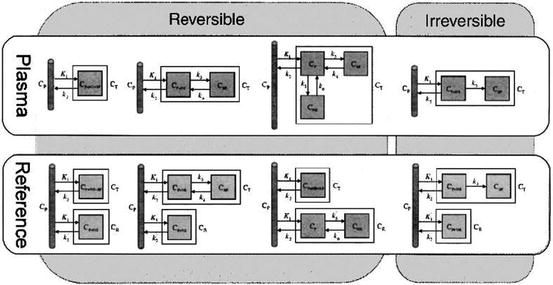
Fig. 24.3
Compartment models commonly used to quantify PET radiotracers. These include models for tracers that exhibit reversible and irreversible kinetics and models that use either a plasma or reference tissue input function (Gunn et al. 2002)
24.2.2 Graphical Analysis
Graphical analysis (Gjedde 1982; Logan et al. 1990, 1996; Patlak and Blasberg 1985; Patlak et al. 1983) is a data-driven method that derives macro-system parameters from a less constrained description of the tracer kinetics. One graphical approach used with irreversible radiotracers is called a Patlak plot. The method uses a transformation of the data such that a linear regression of the transformed data yields the parameter of interest. The linear fitting procedure provides excellent stability against the noise from the dynamic PET measurements (Koeppe 2002). Visual examination of a Patlak plot provides an indication of whether the irreversibility assumption is valid. The Patlak approach is valid for an arbitrary number of compartments for both plasma and reference tissue input models (Patlak and Blasberg 1985; Patlak et al. 1983). Graphical analysis is attractive due to its simplicity but requires determination of the moment when the plot becomes linear; it does not give information about the underlying compartment structure and may be biased by statistical noise (Slifstein and Laruelle 2000).
Graphical parameters in the analysis of 5-(11C)HTP data were derived by Patlak analysis (Patlak and Blasberg 1985; Patlak et al. 1983). This was accomplished by performing linear regression on the tissue concentration divided by the model input concentration as a function of the integral of the model input concentration divided by the model input concentration. This Patlak plot becomes linear over time with a slope that yields an estimate of the net rate of radiotracer accumulation in an irreversible compartment (Lundquist et al. 2006, 2007).
Similar to the kinetic modelling, the radioligand binding in the brain was described by fractional rate constants, however, now lumped in macro-parameter estimates obtained from the Patlak slopes. Models comprising input from plasma (slope K pPat) and cerebellum tissue, without (slope K rPat) or with (slope K cPat) irreversible binding, were considered.
24.3 PET Imaging of 5HT Synthesis
Two radiolabelled compounds have been used for probing the first and second enzymatic steps in the biosynthesis of 5HT.
The studies that were carried out targeting the first enzyme, tryptophan hydroxylase, used [11C]AMT, a radiolabelled methyl analogue of tryptophan (Chandana et al. 2005; Chugani et al. 1998a; Fedi et al. 2003; Juhasz et al. 2003; Kagawa et al. 2005; Muzik et al. 1997; Natsume et al. 2003; Nishikawa et al. 2005). Only partial conversion of this probe to α-methylserotonin in the brain was demonstrated (Diksic et al. 1990; Gharib et al. 1999; Shoaf et al. 2000).
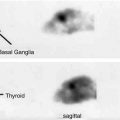
The second enzyme, AADC, has also been employed as probe target. The tracer used was the radiolabelled substrate 5-hydroxytryptophan, [11C]5HTP (Agren and Reibring 1994; Agren et al. 1993; Hagberg et al. 2002; Reibring et al. 1992). The time-dependent accumulation of radioactivity in the basal ganglia using this tracer was mainly a consequence of the trapping of decarboxylated tracer products, thus providing an in vivo index of the activity of the decarboxylating enzyme (Lindner et al. 1997). The ubiquitous distribution of AADC results in that the enzyme activity measurements are not restricted to 5HT-producing cells.
24.4 Perturbation Studies Using 5HT and AMT
The data in papers by Lundquist et al. (2006) and Lundquist et al. (2007) were analysed by compartment and graphical analysis using in-house-developed software implemented in MATLAB 6.5 (The MathWorks Inc., Natick, MA, USA). In this analysis, absolute values of radioactivity plasma, blood and tissue concentrations were used (nCi/cc).
A few operations were performed to extract the plasma and blood data required for modelling. The initial continuous whole blood withdrawal (on-line detection in the first 2–3 min) was corrected for detector dead time and background radioactivity. The density of blood and plasma was fixed to 1.03 g/cc to convert the radioactivity of the manual plasma and blood samples measured in the γ-counter (Bq/g tissue) to the same units as camera data. A full plasma curve (only blood radioactivity measured at early time points) was generated from the blood curve using the ratio of plasma to whole blood concentrations of the manual samples. These arterial plasma concentrations were modelled after correction for the individual estimates of tracer metabolism (ratio of tracer to total radioactivity concentrations) obtained by metabolite analysis.
The total brain radioactivity concentrations in the ROIs were corrected for a 3–5 % blood-borne radioactivity. The midpoint of each PET (time frame) was used as the time of observation. Data from each individual was modelled and the parameters estimated were presented as means (± SD).
The radioligand binding in the brain was parameterised in terms of fractional rate constants. Models comprising one or two compartments in the brain were considered. Parameters were derived by nonlinear regression using the Marquardt-Levenberg least-square minimisation procedure.
Graphical parameters in the analysis of 5HTP data were derived by Patlak analysis (Patlak and Blasberg 1985; Patlak et al. 1983). This was accomplished by performing linear regression on the tissue concentration divided by the model input concentration as a function of the integral of the model input concentration divided by the model input concentration. This Patlak plot becomes linear over time with a slope that yields an estimate of the net rate of radiotracer accumulation in an irreversible compartment (Lundquist et al. 2006, 2007).
Similar to the kinetic modelling, the radioligand binding in the brain was described by fractional rate constants, however, now lumped in macro-parameter estimates obtained from the Patlak slopes. Models comprising input from plasma (slope KpPat) and cerebellum tissue, without (slope KrPat) or with (slope KcPat) irreversible binding, were considered.
24.4.1 Comparison of the Two Substrates in 5HT Biosynthesis
Although none of the tracers [11C]AMT and [11C]5HTP can be used to measure absolute 5HT synthesis rates, their net accumulation rate constants (K acc) have been suggested as indexes of 5HT synthesis (Chugani and Muzik 2000; Hagberg et al. 2002). It has also been suggested that K acc values for these tracers are correlated (Hagberg et al. 2002; Leyton et al. 2005) (Figs. 24.4 and 24.5).
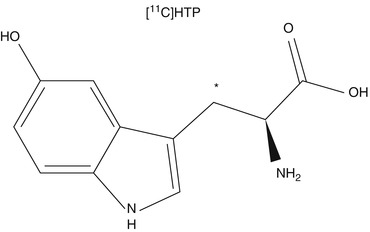
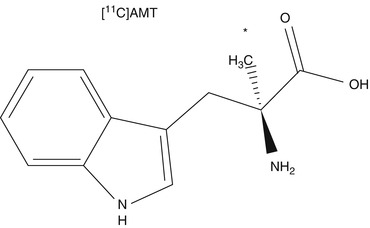
Fig. 24.4
Chemical structure of (11C)-5-hydroxytryptophan (5HTP). The asterisk indicates the position of the 11C label
Fig. 24.5
Chemical structure of (11C)-alpha-methyl-tryptophan (AMT). The asterisk indicates the position of the 11C label
Modelling of data taking peripheral tracer metabolism into account showed that transfer influx of the tracers into the brain was similar or higher for [11C]5HTP (in the striatum and thalamus) when comparing [11C]AMT and [11C]5HTP tracers targeting the first and second enzymatic steps in 5HT synthesis. The rank order of K acc measured with [11C]5HTP PET was in agreement with previous post-mortem regional 5HTP accumulation rates in the Rhesus monkey brain (Brown et al. 1979), namely, highest in the striatum, intermediate in the thalamus and lowest in cortical areas (Fig. 24.6). While there were no substantial differences in K acc for [11C]AMT among the outlined brain regions, this was consistent with the results of earlier PET studies in Rhesus monkeys (Shoaf et al. 2000). The compartmental analysis results of K acc were quite similar to or somewhat lower than the graphically obtained estimates. Thus, in contrast to two previous reports (Hagberg et al. 2002; Leyton et al. 2005), K acc of [11C]5HTP and [11C]AMT were not seen to be well correlated (Shoaf et al. 2000).
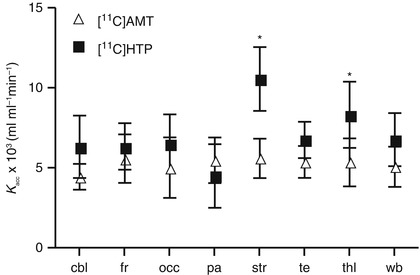
Fig. 24.6
Estimates of the net accumulation rate constant (average ± SE) for [11C]AMT and [11C]5HTP in the monkey brain
It seems reasonable that these measures should be different as the tracers target different enzymes that differ in their enzyme activity in the brain (Ichiyama et al. 1968). In rats, pharmacological inhibition of AADC by NSD1015 decreased the trapping rate constant of [11C]5HTP (Lindner et al. 1997). In recent autoradiographic studies, pharmacological inhibition of the tryptophan hydroxylase with p-chlorophenylalanine or AGN-2979 decreased the unidirectional trapping of [14C]AMT (Hasegawa et al. 2005; Tohyama et al. 2002). This suggests that K acc of [11C]AMT gives a reasonable estimation of the activity of tryptophan hydroxylase, while K acc of [11C]5HTP is providing an in vivo index of the activity of the decarboxylating enzyme AADC.
24.5 [11C]HTP Target Specificity and Brain Metabolites
The conversion of 5HTP to 5HT was inhibited in vivo to investigate whether the suggested compartment model for [11C]5HTP (Hagberg et al. 2002) was capable of demonstrating changes in the parameter or combination of parameters that are interpreted as reflecting AADC activity.
As [11C]5HTP is also subject to decarboxylation by AADC in the periphery, inhibition of the enzyme using NSD1015 increased the radioactivity concentrations of the fraction corresponding to [11C]HTP in plasma (Fig. 24.7). The uptake of [11C]5HTP-derived radioactivity after NSD1015 was also increased in all outlined brain regions, probably because of the increased availability of [1C]HTP to the brain.
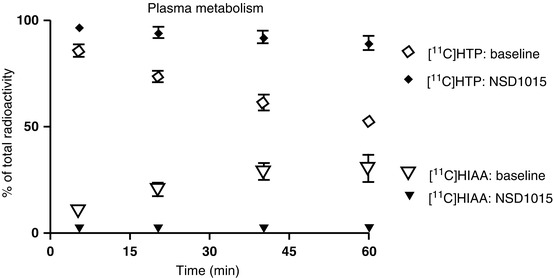
Fig. 24.7
Contribution of (11C)5HTP and the metabolite (11C)5HIAA to the total radioactivity concentrations in plasma before and after administration of NSD1015
After AADC inhibition using NSD1015, the parameters that are interpreted as reflecting AADC activity decreased in the striatum compared to baseline (Fig. 24.8). All the investigated brain regions were affected but only the decrease in the striatum was statistically significant. This could be due to the small sample size in this study, the degree of AADC inhibition achieved in brain tissue with NSD1015 10 mg/kg or the fact that the AADC activity in extra-striatal regions is low (Brown et al. 1979). The signal provided by [11C]5HTP PET might be difficult to use for monitoring changes in the enzyme system in other regions than the striatum. However, signal changes may be better measured in the human brain as the K acc values in healthy volunteers are higher than the values obtained in the current monkey study (Hagberg et al. 2002).
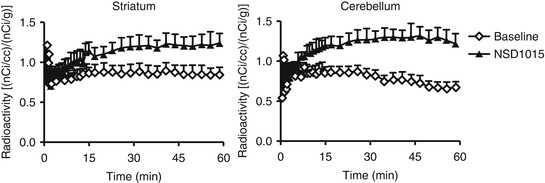
Fig. 24.8
Radioactivity concentrations (average ± SE) in the striatum and cerebellum after bolus administration of (11C)5HTP to monkeys before and after treatment with NSD1015
Verification that no loss of [11C]5HTP-derived radioactivity occurred during the PET study was undertaken by using clorgyline, an irreversible antagonist of MAO. Pretreatment of monkeys with clorgyline did not change the brain uptake of [11C]5HTP-derived radioactivity (Fig. 24.9). This is in agreement with a previous study in rats where pretreatment with clorgyline altered the metabolism in favour of 5HT formation but did not change the uptake of [11C]5HTP-derived radioactivity (Lindner et al. 1997). In healthy volunteers, an attempt to account for loss of labelled 5HIAA by introducing additional model rate constants did not improve the fit of the model (Hagberg et al. 2002).
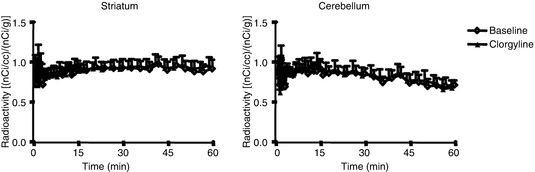
Fig. 24.10
Contribution of (11C)5HTP and the metabolite (11C)5HIAA to the total radioactivity concentrations in plasma before and after administration of clorgyline
The accumulation rate constant was not altered after clorgyline treatment (Fig. 24.10). This suggests that the amount of decarboxylated tracer metabolites eliminated from the brain is negligible and would not greatly prejudice estimation of AADC enzyme activity in the duration of the PET study.
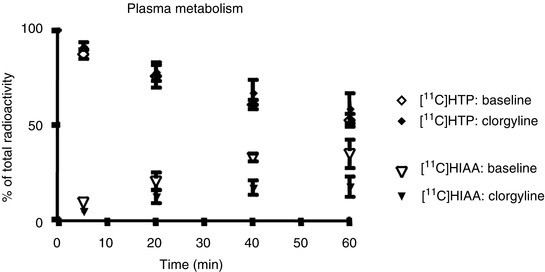
Fig. 24.9
Radioactivity concentrations (average ± SE) in the monkey brain and cerebellum after bolus administration of [11C]5HTP before and after administration of clorgyline to inhibit MAO
24.5.1 Graphical Strategies for [11C]5HTP Data Analysis
The Patlak analysis using plasma as input yielded similar estimates of the net accumulation rate constant to those obtained with the compartmental analysis but with less variability in the frontal, occipital and temporal cortices. As previously mentioned, using plasma as input is considered as gold standard, and therefore, a comparison with graphical analysis of two reference tissue models has also been tried (Lundquist et al. 2006).
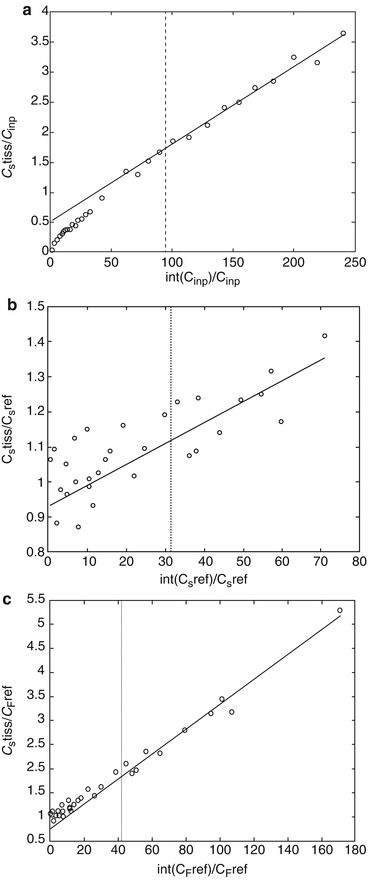
Fig. 24.11
Patlak plots of (11C)5HTP data for the striatum using input data from plasma (a), cerebellum (b) and cerebellum tissue corrected for tracer trapping (c)
The estimates from the reference tissue Patlak plots showed high variability in all outlined brain regions (Table 24.1, (Fig. 24.11)). Using the modified reference tissue input for Patlak analysis, the variability in the average macro-system parameter was lower and negative slopes, or slopes close to zero, were avoided.
Table 24.1
Estimates of the net accumulation rate constant (Patlak slope) 30–60 min in the monkey after administration of (11C)5HTP at baseline and after NSD1015 and clorgyline treatment
Parameter | Condition | Brain region | |||||
|---|---|---|---|---|---|---|---|
Cerebellum | Frontal ctx | Occipital ctx | Striatum | Temporal ctx | Thalamus | ||
K pPat × 103 (ml · ml−1 · min−1) | Baseline | 6.2 (1.5) | 5.4 (1.2) | 5.4 (1.8) | 9.2 (1.9) | 5.6 (1.2) | 6.7 (2.5) |
NSD1015 | 5.8 (−4.0; 1.7) | 5.6 (−3.3; 2.4) | 5.2 (−4.0; 1.7) | 6.3 (−6.7; −1.0) | 4.9 (−4.0; 1.7) | 6.7 (−4.3; 1.4)
Related posts: The Impact of Genetic Polymorphisms on Neuroreceptor Imaging The Impact of Genetic Polymorphisms on Neuroreceptor Imaging
 Imaging of Central Benzodiazepine Receptors in Chronic Cerebral Ischemia Imaging of Central Benzodiazepine Receptors in Chronic Cerebral Ischemia
 PET Tracers for Beta-Amyloid and Other Proteinopathies PET Tracers for Beta-Amyloid and Other Proteinopathies
 PET Imaging of ABC Transporters in the BBB PET Imaging of ABC Transporters in the BBB
 Imaging Type 1 Glycine Transporters in the CNS Using Positron Emission Tomography Imaging Type 1 Glycine Transporters in the CNS Using Positron Emission Tomography
 Imaging Histamine Receptors Using PET and SPECT Imaging Histamine Receptors Using PET and SPECT
Stay updated, free articles. Join our Telegram channel
Full access? Get Clinical Tree
 Get Clinical Tree app for offline access

| |