Chapter 7
Chemical Shift Type 2 Artifact
Scott M. Duncan and Timothy J. Amrhein
CASE 1


1. Which image is the “in-phase” image and which is the “out-of-phase” image? How can you differentiate the two images?
2. What is the difference between the appearances of the adrenal nodule on the in- and out-of-phase images?
3. Is this lesion benign or malignant?
4. Which series, in or out of phase, is typically acquired first?
5. Why is the subcutaneous fat still bright on the out-of-phase image?
ANSWERS
CASE 1
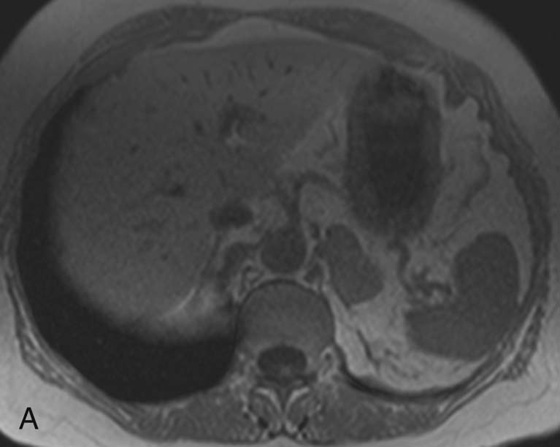
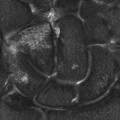
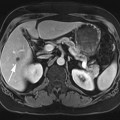
FIGURE 1A. Axial T1-weighted in-phase image. There is a large left adrenal nodule that is isointense to muscle (gray).

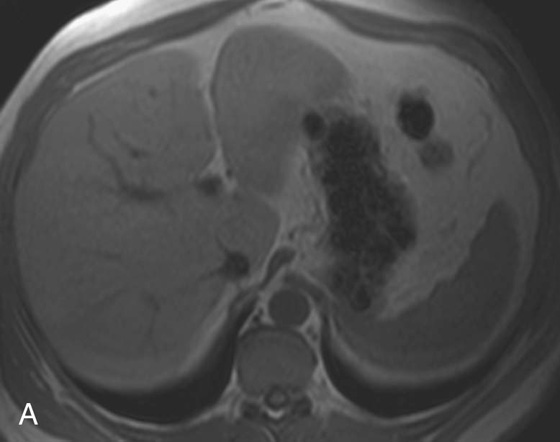
FIGURE 1B. Axial T1-weighted out-of-phase image. The left adrenal nodule has lost signal and now appears almost black.
1. The in-phase image is on the left and the out-of-phase on the right. The “India ink” artifact helps to differentiate the two images. The India ink artifact outlines all of the abdominal organs and is only present on out-of-phase images.
2. The nodule appears darker on the out-of-phase image in comparison with the in-phase image because of the presence of fat.
3. This is most likely a benign adrenal lesion because there is fat within the lesion, which is rarely seen with metastatic adrenal nodules.
4. The out-of-phase image is acquired first (see discussion below).
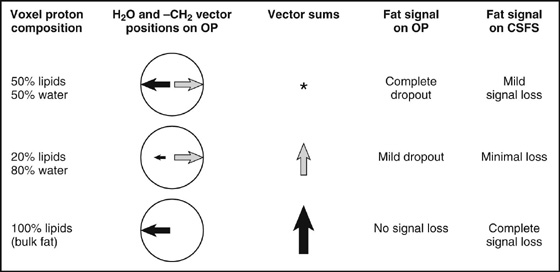
5. Pixels that are almost exclusively fat signal are not suppressed on out-of-phase images. Suppression is seen only in pixels with proportions of both fat and water signal.
Diagnosis:
Adrenal adenoma.
Discussion:
The signal loss on the out-of-phase image is indicative of fat within the lesion, a finding that is suggestive of an adrenal adenoma. One word of caution: although the signal loss is highly suggestive of an adrenal adenoma, adrenal cortical carcinomas, pheochromocytomas, and clear cell renal cell carcinomas can exhibit these magnetic resonance (MR) characteristics as well.1 At least 20% signal loss should be identified to ensure the diagnosis of an adenoma.2 Atypical adrenal nodules warrant consideration of positron emission tomography/computed tomography (PET/CT), adrenal washout CT, or biopsy to confirm the diagnosis.
Physics Discussion
In- and out-of-phase imaging is an essential sequence used in abdominal imaging, especially when evaluating the liver, adrenal glands, and kidneys. This sequence takes advantage of an artifact called “chemical shift” to evaluate for the presence of small proportions of fat. There are two types of chemical shift artifacts. Type 1, or chemical shift misregistration artifact, is present on all sequences to some extent, although it is often imperceptible. Type 1 chemical shift artifact is covered in Chapter 9. Type 2, or chemical shift cancellation artifact, is only present on out of phase sequences and is the focus of this chapter.
Fat and water protons are exposed to slightly different magnetic field strengths as a result of differences in the electromagnetic microenvironments between the two molecules, specifically differences in the electron clouds surrounding the hydrogen nuclei (i.e., protons).3,4 This results in slightly different Larmor frequencies for protons in these two molecules. Since the protons precess at slightly different frequencies, there are regular intervals when their spins are in phase and out of phase with each other. Adjusting the times to echo (TEs) to times when the nuclei are in and out of phase produces the in- and out-of-phases images.3 On 1.5T magnetic resonance imaging (MRI) systems, there is an approximately 220-Hz frequency difference between the two molecules. In other words, every 4.4 msec (1 sec/220 Hz) water protons will have done exactly one extrarotation and be back in phase with the fat protons. The signals are in opposite phases (water will have an extra 180° rotation) at 2.2 msec, 6.6 msec, etc. The frequency difference for fat and water is doubled on 3.0T systems, thus the above increments are halved (1 sec/440 Hz).5
In- and out-of-phase images are acquired using a T1-weighted gradient-recalled echo sequence. MRI scanners traditionally acquire the out-of-phase images before the in-phase image to eliminate the confounding variable of T2* decay. If the out-of-phase images were acquired after the in-phase images, it would be difficult to determine if the signal loss was from chemical shift artifact or from T2* decay.6
The diagnostic utility of in- and out-of-phase imaging is its sensitivity for small amounts of fat within a lesion or organ.2 Other fat suppression techniques in MR (chemical-selective fat suppression [CSFS] or inversion recovery) and CT can also detect fat within a lesion; however, they are less sensitive for smaller amounts of fat.7 As in Case 1, identifying lesions with a small component of fat is essential to establishing a diagnosis and to determining its benign or malignant nature. Lesions with small amounts of fat lose signal on out-of-phase images because there is a proportion of both fat and water within an individual pixel. The fat will have a (−) signal value while the water will have a (+) signal value. When these two signals are summed, a portion of the signal will cancel, resulting in loss of signal within the pixel (the pixel appears darker). To understand why out-of-phase images are more sensitive to fat, compare a T1-weighted fat-saturated sequence with an out-of-phase sequence for a lesion where fat contributes 15% of its signal intensity and water the remaining 85%. In the fat saturation sequence, 85% of the signal will remain in the lesion after the fat saturation prepulse. However, in the out-of-phase image, the 15% fat signal cancels out a portion of the 85% water signal, resulting in only 70% of the original signal. This makes the difference much easier to detect. In summary, out-of-phase sequences magnify the signal loss from fat by a factor of 2, resulting in increased conspicuity of lesions with minimal fat.
If a pixel’s signal contribution is 50% from water and 50% from fat, then the two signal contributions will completely cancel each other out and the resultant pixel will have no signal (i.e., be black). The most common location for this to occur is at an interface of fat and water, such as between abdominal organs (containing nearly 100% water signal) and the surrounding mesenteric or retroperitoneal fat. This is the basis for the characteristic India ink artifact identified on out-of-phase images. The India ink artifact is the thin black line that outlines all of the organs in the abdomen. The artifact completely lines the organ on all sides, differentiating it from type 1 chemical shift artifact, which only occurs along the frequency-encoding axis.3
Interestingly, areas that are composed solely of fat do not lose intensity on out-of-phase images (look at the appearance of the mesenteric fat in the images in Case 1; note that it retains its high signal intensity) (Fig. 1). This seems counterintuitive. The mesenteric fat and the adrenal nodule both contain fat, so shouldn’t they both have suppressed signal? To understand this apparent contradiction, one must remember that MR images are most often magnitude images that make use of only the absolute values to determine signal intensity, and not the vector direction or phase. Therefore, the value in a specific pixel could be positive (water-containing structure) or negative (mesenteric fat), but if they have the same absolute value they will appear similar. Conversely, if a pixel is composed of some combination of fat and water signal, such as an adrenal adenoma, then there will be signal cancellation.
CASES 2 AND 3: COMPANION CASES
Case 2
Related posts:
Stay updated, free articles. Join our Telegram channel

Full access? Get Clinical Tree


