Fig. 34.1
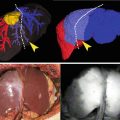
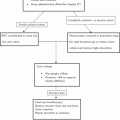
Imaging setup: The imaging instrumentation consists of the following parts: LED light source (left), filter1 for filtering out wavelengths over 800 nm, the object of imaging (bottom), operation microscope, filter2 to filter out wavelengths under 800 nm, and the NIR-sensitive digital camera, which is further connected to a PC for image recording. The solid arrows denote light of wavelengths under 800 nm (excitation), while the dotted arrows denote light of wavelengths over 800 nm (fluorescence)
Tissue is illuminated by a near-infrared (NIR) light source giving excitation energy to ICG molecules. The optimum wavelength of the excitation is about 780 nm, while any radiation above 800 nm is filtered away, i.e. in the fluorescence band. Three main possible light source types can be used: halogen bulb + filter, LED + filter, and a NIR laser. In our setup we used LED + filter light source, as it is energy-efficient, economical and easy to control electronically. The LED spectrum somewhat overlaps the fluorescence spectra making the filter necessary for a LED-type light source (Fig. 34.1). The LED (LED780-66-60, Roithner Lasertechnik GmbH, Vienna, Austria) produced maximum 1.0W light power having spectral maximum at 780 nm and 30° light cone without lens. The LED was fed by a 500 mA constant current source.
Fluorescence was recorded by a NIR-sensitive camera (ORCA-05G, Hamamatsu, Japan) without mechanical shutter. The image format was 16-bit monochrome of which 14 bits were used by the camera. Thus the intensities are represented by integer values in the range [0,4095].
Without filters excitation light and fluorescence signals are summed at the sensor and are inseparable in the resulting image. To enable the separation of these signals both camera and light source filters are important for the imaging system. The excitation light should not contain any fluorescence wavelengths, as they should originate only from the fluorescing ICG. Thus a filter was placed in front of the camera on the microscope ocular to block the excitation light. The intensity of the fluorescence is much lower than that of the excitation light. Ideally, the two filters should divide the spectrum into two strictly non-overlapping bands. This can be best done using interference filter pairs separating the spectrum at about 800 nm (Chroma Technology, Brattleboro, VT, USA). In addition, a standard operational microscope (Wild 327733, Heerbrugg, Switzerland) was used to focus the image on the camera sensor and a PC for recording the ICGA videos via IEEE 1394 interface.
Visual reference images (Fig. 34.2, leftmost images) prior to fluorescence imaging were acquired with the same setup when the LED light source was replaced by an ordinary microscope broadband white light source while keeping the filter2 (Fig. 34.1) in front of the camera. ICGA videos were acquired with a rate of 3 frames per second with the exposure time of 0.05 s using HCImage software provided by Hamamatsu. During ICGA the operation room was darkened and all extra lighting was switched off. Analysis of the videos was done offline as described in the Image Processing section.
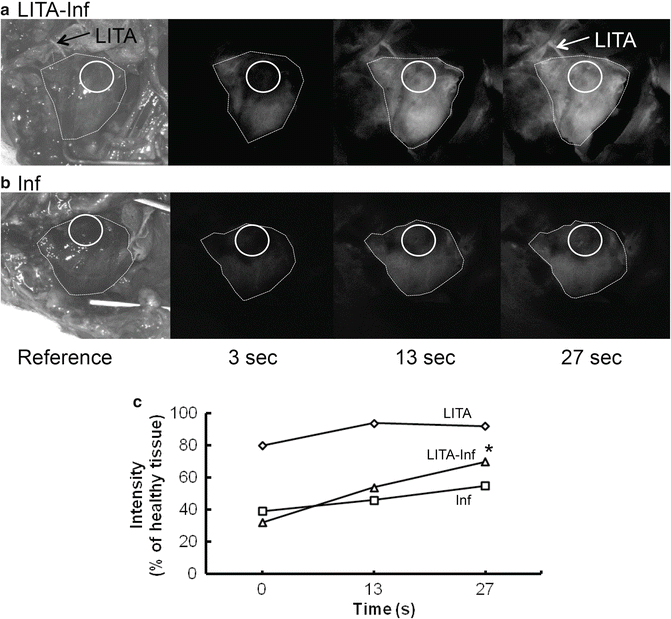

Fig. 34.2
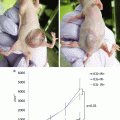
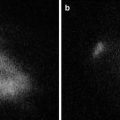
ICG imaging of rat heart 4 weeks after myocardial infarction with (a) (LITA-Inf) and without (b) (Inf) LITA implantation. Circle (infarct area), Dotted line (heart outline), Arrows pointing at implanted LITA. (c) ICG intensity dynamics from three time points. Preliminary results imply that LITA implantation (LITA-Inf) increases perfusion in the infarcted area. *p < 0.05 LITA-Inf vs. Inf, LITA
Image Processing
Image processing was done using ImageJ [22], for which a few plugins described next were implemented. The consecutive frames of the interesting time interval of the recorded ICGA video were collected into a directory, which was input to the ImageJ program as an image stack. In addition to the ICGA frames the stack may also contain dark frames (at the end of the stack, which is created according to the alphabetical order of the file names) allowing background subtraction at the RoIs. A file giving general parameters and coordinates of RoIs (Regions of Interests) is used by the implemented plugins. Currently, there are three ImageJ plugins for evaluating the dynamics:
ICGA_Read_RoIs: reads RoI from a file into a table for the other plugins. Either a fixed number of RoIs is given for each frame, or one RoI set is copied to all frames for further editing by the next plugin.
ICGA_Edit_RoIs: The stack is processed from the last one (most intense fluorescence) one RoI at a time allowing the user to move the RoI by a mouse. Updates the list of RoIs accordingly and finally outputs them to the log window, from where the list can be saved into a file using copy/paste for later use.
ICGA_Measure_RoIs: scans the stack frame by frame and calculates the average intensity (signal) of the RoIs and the whole frame. If dark frames are included in the stack the corresponding average background (baseline) at the RoIs is subtracted from the average signal. Outputs the result to the log window for further processing by, e.g. Excel (copy/paste).
Microsoft Excel was used in further processing of RoI intensity data.
Regions of Interest
Beating heart is challenging for automatic image registration as distinctly defined landmarks are difficult to establish in fluorescence images. Therefore, RoIs were defined manually from the ICGA videos. Plugins were used to help in the manual definition of RoIs by giving default values for the coordinates of each RoI. Currently, the RoIs are square shaped—the edge length of which is given in the RoI-file among other parameters. Observe that the coordinates of the RoI give the center point of the RoI, not the upper left corner which is the default in ImageJ. This geometry allows straightforward RoI size tuning, if needed, by using only one parameter, the edge length.
Calibration
Video sequence can contain both black (dark current) and white (sensitivity) frames for calibration. Black frames were used to estimate average background intensity for each RoI. There can be any number of black frames at the end of the stack. Here, we used the average of ten black frames for background subtraction.
Analysis of Dynamics
The conventional method to display ICGA is to use absolute intensity. In order to be able to compare ICG fluorescence levels, the average intensities at RoIs were normalized by dividing the average intensity of the tissue region of interest (infracted myocardium) with the average intensity of the reference region (healthy myocardium in the same heart) and displaying the resulting values as percentages (Fig. 34.2c). Three frames (1 s) were pooled together to reduce noise.
In these experiments, we have used the following ways to display the dynamics extracted from the raw video frames:
A: absolute intensity,
N: normalization of intensity so that the intensities are approximately equal in the pseudo steady state, and
N/A: N divided by the average intensity of the whole frame.
From the above information, we can evaluate several parameters characterizing dynamics like:
T 0, start time: the time that the fluorescence starts.
T s, settling time: the time that is needed for the fluorescence to settle to a constant level. In practice there is no clear settling time and strictly speaking the concentration of ICG is constantly decreasing due to extraction by liver. Therefore, we have used T s as the time within which the fluorescence seems to be constant enough for most RoIs.
I s, settling intensity: the intensity that the RoI seems to reach after a reasonable settling time T s.
T 50, rise time to 50 %: the time from T 0 it takes the intensity to increase to the value I s/2.
Stay updated, free articles. Join our Telegram channel

Full access? Get Clinical Tree


