Fig. 1
a The two common acquisition sequences free induction decay and spin echo together with, b a synthetic spectrum with definitions of the major parts. If the spectrum has been acquired under relaxed conditions and without loss by the transversal relaxation time, the position on the frequency axis (ppm) represents the chemical identity and the area under the curve the concentration of a metabolite. Since inhomogeneity broadens the signal at the costs of the amplitude, the area has to be used for a calculation of metabolite concentrations. Overlapping resonances represent a major challenge for spectral quantitation, in particular in crowded 1H-MR spectra
3.2 Observable Nuclei
While 1H-MRS particularly in the brain became the major spectroscopy application on clinical scanners, MRS in the musculoskeletal system began with the observation of 31P-nuclei (Hoult et al. 1974; Ross et al. 1981; Chance et al. 1981, 1982, 1986; Radda et al. 1982; Meyer et al. 1982; Haselgrove et al. 1982; Edwards et al. 1982; Eleff et al. 1984; Taylor et al. 1986; Miller et al. 1988). As it can be seen in the following section, the majority of the published papers still use 31P-MRS in muscle even if 1H-MRS became much more popular in the last decade, as will be seen in the third section of this chapter.
Table 1 shows the characteristics of different nuclei which are used in clinical MRS. However, the next section will be essentially limited to 1H, 13C, and 31P which represent the huge majority of the clinical MRS applications on muscular metabolism. Applications with 23Na are mainly used in an imaging mode, i.e., without resolution of the chemical shift dimension and will thus be discussed in other chapters.
Table 1
List of nuclei with common applications in human MR scanners
Nucleus | Spin | Frequency at 3 Tesla (MHz) | Inherent sensitivity (relative to 1 H) | Natural abundance (%) | Typical concentration (Mol) | Relative overall sensitivity | Edge length of cube with comparable signal |
|---|---|---|---|---|---|---|---|
1Hydrogen in water | 1/2 | 127.74 | 1.000 | 99.99 | 102 in water | 1 (reference) | 0.1 cm (reference) |
1Hydrogen in metabolites | 1/2 | 127.74 | 1.000 | 99.99 | from 10−3 to 10−2 in metabolites | from 10−5 to 10−4 | 3 cm |
12Carbon | 0 | N/A | 0.000 | 98.89 | from 10−2 to 10−1 in metabolites | 0 | N/A |
13Carbon | 1/2 | 32.12 | 0.016 | 1.11 | from 10−2 to 10−1 in metabolites | from 10−8 to 10−7 | 35 cm |
19Fluor | 1/2 | 120.20 | 0.833 | 100 | <10−3 in metabolites | <10−5 | 10 cm |
23Sodium | 3/2 | 33.79 | 0.093 | 100 | from 10−2 to 10−1 | from 10−5 to 10−4 | 3 cm |
31Phosphor | 1/2 | 51.71 | 0.066 | 100 | from 10−3 to 10−2 | from 10−6 to 10−5 | 7 cm |
The inherent sensitivity of a nucleus depends on the resonance frequency since this governs the induced voltage in the detection coil of the scanner. This fact explains why 1H with the highest resonance frequency of all nuclei (except 3H-tritium, which is irrelevant in that context) has the highest inherent sensitivity. 31P, and in particular 13C, have a lower resonance frequency and suffer thus from less signal yield. A second disadvantage is the much lower concentration of metabolites compared to water or fat, which are the sources of the MRI-signal. Even worse, 13C nuclei represent only 1 % of all carbon nuclei which are made of 99 % MR-invisible 12C nuclei. While this is a serious challenge for spectroscopy of natural abundance carbon, it can be turned into an advantage when 13C-labeled substances are infused. Newly infused 13C-enriched-metabolites and its products show up in the spectrum with a much higher signal-to-noise ratio (SNR) than the pre-existing carbons and can thus be followed along the metabolic steps of the infused substance.
Table 1 also lists volumes that would be necessary to obtain an equal SNR in the spectra as an MR image. This list is for illustration only since MRS compensates the lower inherent signal yield by longer acquisition times and lower SNR than MR images. However, even if longer acquisition times and lower SNR are taken into account, there are still gross differences between the resolution of MR images of water and typical MR spectra of metabolites. For field strengths of 3 T, as a rule of thumb, 1H-MRS can observe metabolites above 1 mMol in a volume of a few cm3 within a few minutes’ acquisition time. In turn, 31P-MRS of muscle tissue can observe metabolites above 10 mMol in a volume of about 100 ml with a temporal resolution of a few seconds. If no temporal resolution is necessary, a 31P-MR spectrum can observe metabolites in the mMol range in a few minutes from about a volume of 100 ml. 13C-MR spectroscopy of unlabeled metabolites (typically glycogen) can be applied to metabolites in the 10–100 mMol in a volume of 100 ml or more and within 10–20 min. All these numbers can be modified because total acquisition time, required metabolite concentration, and acceptable SNR can be balanced in different ways. Nonetheless, these numbers show that MRS is always fighting against low SNR, in particular non-proton-nuclei. Since the SNR increases with field strength, MRS benefits from current installation of numerous 3 T scanners in the clinics and up to 9.4 T systems in research institutions.
3.3 Observable Metabolites, Biomarkers
Figure 2 illustrates the observable metabolites in 1H-, 13C-, and 31P-MR spectra of the skeletal muscle. It also emphasizes that multinuclear MRS can follow metabolism via the observation of very different substances and that a limitation to 1H-MRS—as it happens in many clinical scanners—restricts the number of observable metabolites significantly.
Fig. 2
The observable metabolites in 1H-, 13C-, and 31P-MR spectra of the skeletal muscle
31P-MRS in muscular tissue is particularly helpful for an evaluation of the energy metabolism since phosphocreatine (PCr) and adenosine-triphosphate (visible are three resonances of α-, β-, and γ-ATP) represent vital high-energy molecules of the cell. Since inorganic phosphate (Pi) exists in a protonated and unprotonated form with different resonance frequencies and fast exchange, the averaged position of the Pi peak titrates with the concentration of protons between the two forms
and can thus be used to measure the intramyocellular pH (Moon and Richards 1973; Hoult et al. 1974; Flaherty et al. 1982; Seo et al. 1983; Taylor et al. 1983; Kemp et al. 1993a):
δ representing the ppm difference between PCr and Pi. The noninvasive observation of proton concentration, i.e., the pH, buffering, and proton efflux during exercise and recovery is a unique tool within 31P-MRS that plays an important role in clinical studies of muscular diseases. PCr, ATP, and Pi take part in the reversible creatine kinase reaction:
thus allowing the muscle to maintain constant ATP levels with the synthesis of ATP from adenosine-diphosphate (ADP) and PCr. ADP is a key metabolic control which is not directly visible in the 31P-MR spectrum, yet can be calculated from (Arnold et al. 1984; Chance et al. 1985) the equation:
![$$ \left[ {\text{ADP}} \right]_{{}} = \, \left[ {\text{Cr}} \right] \, \left[ {\text{ATP}} \right] \, /{\text{ K}}_{\text{eq}} \left[ {\text{PCr}} \right] \, \left[ {{\text{H}}^{ + } } \right] $$](/wp-content/uploads/2016/08/A174_2013_847_Chapter_Equ4.gif)
with Keq using known values, metabolite concentration from the spectrum, and [H+] from the pH as determined by Eq. (2). During exercise, ATP is used and PCr provides high-energy phosphate groups to maintain ATP at a constant level. This leads to a reduction of PCr and an increase of Pi which can be observed in the 31P-MR spectrum (Fig. 3). During the recovery period after exercise, ATP and thus PCr are resynthesized by oxidative phosphorylation which takes place in the mitochondria (Dawson et al. 1977; Chance et al. 1982; Radda et al. 1982; Eleff et al. 1984), given that the blood supply provides the necessary oxygen (Harris et al. 1975; Taylor et al. 1983; Quistorff et al. 1993). Therefore, the recovery of PCr is a direct measure of the mitochondrial oxidative phosphorylation (Fig. 4), a fact used in numerous papers to test mitochondrial activity as can be seen in the section on muscular diseases.
(1)
(2)
(3)
(4)
Fig. 3
The 31P-MRS recovery curve of PCr following exercise in an athlete (recovery time τ = 25.9 s) and a sedentary subject (τ = 33.2 s). The time constants k of the exponential curves (athlete 2.32 and 1.81 min−1 for the sedentary subject, respectively) are given for comparison with Fig. 4. The comparison illustrates how the oxidative phosphorylation in the athletic muscle provides the necessary energy faster than the untrained muscle (courtesy of Andreas Boss)
Fig. 4
The rate constant k of PCr recovery versus mitochondrial volume density (mitoVD). Black diamonds represent athletes while the open squares stand for sedentary subjects. The correlation of mitochondrial density as determined in a biopsy with the noninvasively measured reaction constant k is clearly visible. It can also be seen that athletes have both more mitochondrial volume density and faster recovery, i.e., elevated oxidative phosphorylation (reproduced with permission (Boss et al. 2013))
An additional peak in the 31P-MR spectrum results from phosphomonoesters (PME), which include sugar phosphates such as glucose-6-phosphate (G6P), as well as membrane precursors like phosphocholine (PCh) and phosphoethanolamine (PEt). Phosphodiesters (PDE), like glycerophosphocholine (GPCh) and glycerophosphoethanolamine (GPEt), are attributed to break down products from membrane lipids. Since membrane-turnover is increased in tumors, PME and PDE signals are often abnormal in tumorous tissue (Negendank 1992).
31P-MR magnetization transfer experiments can be used to follow creatine kinase and ATP synthase reactions (Forsen and Hoffman 1963; Befroy et al. 2012). An irradiation of the γ-ATP resonance leads to a saturation of phosphate groups that are in exchange with PCr and Pi. Since the saturated spins do not produce a signal at the “new” position in the spectrum, and since unsaturated spins are exchanged to the γ-ATP position where they are saturated, the kinetics of these reactions can be determined.
The 13C-MR spectrum is dominated by lipid signals which can pose baseline problems in obese subjects when the focus is on smaller signals from less abundant metabolites. In skeletal muscle, 13C-MRS is mainly used to follow the glycogen-C1 signal, sometimes in connection with the creatine peak as an internal concentration reference (Rotman et al. 2000) (Fig. 5). Since large molecules are usually not visible in MR spectra due to very short T 2 values of “solid-like” material, it was somewhat surprising and fortunate for MRS that glycogen is 100 % visible thanks to sufficient internal mobility (Gruetter et al. 1991). Meanwhile, glycogen synthesis and glycogenolysis are major targets in exercise physiology (Fig. 5), studies on insulin resistance (Shulman et al. 1990), and in glycogenoses (Vorgerd et al. 2002a). While the application of 13C-enriched infusions in humans can yield very specific metabolic information, only very few research groups worldwide conquer the technical and financial challenges. Unlike mass spectroscopy and other analytical methods which are using stable isotopes in breathing air or urine, 13C-MR spectroscopy needs large quantities of labeled substances to see a measurable effect, resulting in substantial costs per experiment. One specifically attractive target of 13C-enriched infusions is the tricarboxylic acid cycle (TCA cycle, Krebs cycle, or citric acid cycle). Several labeled substrates can be infused and followed by 13C-MRS, including acetate, pyruvate, lactate, or glucose. Infusion of 13C-acetate leads to an increase of the glutamate signal in the 13C-MR spectrum which is in rapid equilibrium with α-keto-glutarate, an intermediate product in the TCA cycle and thus an indicator for TCA cycle activity. Since the TCA cycle takes place in the mitochondria, a measurement allows some conclusions on the mitochondrial activity, which is discussed in many diseases and also in the aging process. Recently, MRI and MRS of hyperpolarized 13C-substrates have been suggested (Kurhanewicz et al. 2011) and reached the level of clinical investigations in selected research sites. The usage of hyperpolarized 13C-substrates might change 13C-MRS in general since more scanners will be equipped with the necessary hardware and software to acquire non-proton-nuclei. While many publications deal with cardiac applications of hyperpolarized 13C, examples in the musculoskeletal system have already been reported in animals (Kohler et al. 2007; MacKenzie et al. 2011; Larson and Gold 2011).
Fig. 5
The usage and replenishment of glycogen in human skeletal muscle observed by natural abundance 13C-MRS. The resonance of creatine is used for relative quantitation (reproduced with permission (Rotman et al. 2000))
The potential of 1H-MR spectroscopy of skeletal muscle was underestimated for quite a long time since the large lipid resonances were hiding most of the interesting metabolite signals. The detection of deoxymyoglobin was an early exception since the resonance is shifted to the far left at 78 ppm (Wang et al. 1990; Mancini et al. 1994; Brillault-Salvat et al. 1997; Mole et al. 1999; Kreis et al. 2001). The use of gradient-based volume localization in combination with very careful placement of the voxel allowed for an acquisition of 1H-MRS of skeletal muscle without too large signals from lipids (Boesch and Kreis 2001; Boesch et al. 2006; Boesch 2007). It was found that the highly ordered skeletal muscle led to very specific and unexpected MR-effects and that the spectra were orientation-dependent due to dipolar coupling effects (Boesch and Kreis 2001). The observation of two separate lipid signals by Schick et al. (1993), and subsequently the characterization of the two signals as intra- (IMCL) and extramyocellular lipids (EMCL) (Boesch et al. 1997), prepared the ground for a much more widespread application of 1H-MRS of skeletal muscle (Boesch et al. 2006) with a depletion experiment illustrated in Fig. 6. Several groups demonstrated the relation of IMCL and insulin resistance (Machann et al. 1998; Perseghin et al. 1999; Cline et al. 1999; Jacob et al. 1999; Krssak et al. 1999; Decombaz et al. 2001) which led to a series of MRS studies in diabetology which are described in the next section. Since many metabolites contain 1H and the chemical shift range of the 1H-MR spectra is relatively small, 1H-MR spectra are crowded but highly informative. Many resonances have been assigned and have already been used for physiological or pathophysiological studies, such as acetylcarnitine, total creatine (tCr), carnosine, trimethyl ammonium (TMA) containing metabolites, and amide protons. Others like taurine are visible but partially hidden such that a reliable determination of concentrations is difficult. Lactate is also hidden underneath lipid peaks, yet can be measured with the help of editing sequences (Pan et al. 1991). While higher magnetic field strengths will be beneficial for the SNR in non-proton spectra, it will be equally beneficial for 1H-MR spectra due to the better resolution of the overlapping resonances.
Fig. 6
The depletion of intramyocellular lipids (IMCL) during exercise, best visible at the reduction of the CH2 signal at 1.28 ppm. Abbreviations: extramyocellular lipids (EMCL), creatine groups (Cr2 and Cr3), trimethyl ammonium containing groups (TMA)
3.4 Magnetic Resonance Spectroscopy/Magnetic Resonance Spectroscopic Imaging Acquisition Techniques
While other organs are almost exclusively observed with the help of gradient-based localization techniques, a large number of 13C- and 31P-MRS studies are using transmit/receive surface coils in combination with pulse-and-acquire acquisition. This has several advantages including a higher SNR, no signal loss due to transversal relaxation, very fast acquisition, and minimal artifacts due to gradient imperfection. The acquisition of metabolites with very short transversal relaxation times, such as deoxymyoglobin and glycogen, makes pulse-and-acquire techniques essential. Any echo formation would reduce dramatically the already very small signal of these metabolites. The size of the selected volume of a transmit/receive surface coil is large and close to the receiver which guarantees maximal SNR that cannot be equaled by cube-like selected volumes in gradient-based techniques. Artifacts from gradient imperfections have been reduced dramatically with the advent of shielded gradients in the 1990s. However, when MRS of muscle had been introduced, long before shielded gradients were developed, these artifacts had been a crucial issue, in particular in small-bore MR systems for limbs which were used successfully for more than a decade. Since the chemical shift dispersion of 31P- and in particular of 13C-MR spectra is much larger than for 1H-MR spectra, the chemical shift displacement becomes intolerable with common strengths of the gradients. This problem does not occur with transmit/receive surface coils where the volume selection is defined by the position of the coil. On the other hand, the selected volume of a transmit/receive surface coil is extremely complex and absolute quantitation of metabolites is very challenging since the pulse angle of a transmit/receive surface coil is highly variable in space (Fig. 7). One practical reason for the usage of transmit/receive surface coils is also the fact that no clinical MR system is equipped with a body coil that is tuned to 13C- or 31P-frequencies and allows for a homogeneous irradiation.
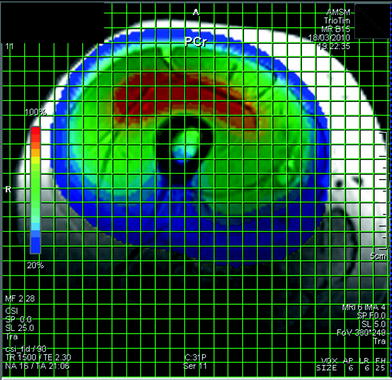
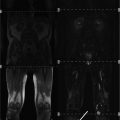
Fig. 7
A CSI data set in the thigh. This display of the CSI data set shows the spatial variation of the signal intensity of a single metabolite, in this example PCr. The spatial variation of the signal strength is mainly a result of the varying pulse angle in a pulse-and-acquire sequence with a transmit/receive surface coil and much less the distribution of the metabolite concentration. In healthy resting muscles, the PCr concentration can be assumed to be constant, however, examples of spatial variations due to pathology are shown below
Gradient-based localization schemes of single voxel such as ISIS, STEAM, or PRESS are widely used in other organs. In the musculoskeletal system, they are increasingly important, in particular for 1H-MRS or when the target is the spatial distribution of a metabolite. Nevertheless, gradient-based localization of non-proton-nuclei is still less widely used in the muscle than pulse-and-acquire techniques. The chemical shift displacement of 13C- and 31P-MR spectra is such that strictly spoken only single resonances can be observed at the correct spatial localization with gradients. ISIS has the advantage of minimal signal loss due to the transversal relaxation; therefore, it is the method of choice for 31P-MRS where short T 2 values reduce the signal in echo-based sequences too much. STEAM or PRESS sequences are crucial for the observation of 1H-metabolites where the signal loss due to the delayed echo formation is not a big issue, even if short-echo-times are preferred to avoid large TE-correction terms. Long TE are sometimes used to clean the spectrum and to increase the separation of overlapping resonances. However, only gradient-based localization and careful positioning of the voxel provide a sufficient suppression of lipid signals from outside the voxel. Relaxation times of 1H-metabolites are well suited for echo-based techniques, in particular if short-echo sequences are used.
Chemical shift imaging or MRSI is illustrated in Fig. 7. While this technique is popular in other organs, only a few 1H- and 31P-MRSI applications are using it in skeletal muscle (Kan et al. 2010; Vermathen et al. 2012), to mainly document spatial variations of the metabolites. As long as all three spatial dimensions are CSI-encoded, there occurs no chemical shift displacement due to the large chemical shift dispersion in non-proton-nuclei. However, an encoding in all three spatial dimensions results in very long acquisition times since every phase step has to be made in all three spatial directions. As soon as one dimension is selected with a slice gradient, chemical shift displacement has to be considered. Echoplanar spectroscopy sequences can help in that respect and are promising (Wilhelm and Bachert 2001), but have not yet been widely used in human skeletal muscle.
3.5 Ergometer and Muscular Energy Metabolism
Exercise and recovery is a crucial element of MRS of skeletal muscle. Unlike cardiac tests, where the working muscle can be outside of the magnet, the working skeletal muscle has to be in the homogeneous center of the magnet and the acquisition has to go on during exercise. This explains why many ergometers constructed to support MRI of the heart during workload are not suited for MRS of skeletal muscle.
In general, examinations during workload are much more critical than recovery from exercise. Many practical challenges occur when power output should be measured in the technically hostile MR environment with static magnetic field, switching gradients, and strong radio frequency-pulses. Measurements outside of the magnet are technically easier, however, are limited since the power loss along the power transmission remains largely unknown but can be substantial.
A measurement of the PCr decrease as a function of power output suffers also from several physiological problems, such as recruitment of specific parts of muscles or evasive movements of the subjects (Akima et al. 2002). This might result in an involvement of musculatures around the hip joint with subsequently reduced workload for the observed musculature. A problem often underestimated is the blood flow in the exercising limb since ischemia can severely affect PCr recovery, which is an oxidative process. Therefore, any peripheral vascular disease or even an unintentionally limited blood flow, e.g., in the arteria poplitea due to the supporting structures for the exercise, can falsify the examination. Concentric workload describes a pushing of the contracting muscle against a load while eccentric workload is a deceleration of an applied force by the expanding muscle, e.g., while walking down a hill. Since blood flow can be limited by the permanently contracted muscles in the combination of concentric and eccentric workload—e.g., by a permanent weight lifting—concentric workload only would be preferable. In addition, eccentric workload represents a different physiological phenomenon than concentric workload and requires a specific interpretation since much larger loads can be handled.
PCr recovery has the advantage that it does not depend on the preceding power output as long as some precautions are respected. Nonetheless some problems remain, e.g., that the subject adheres to the protocol, stops immediately when recovery should start, and does not contract the muscle during the recovery phase. When values after exercise are compared to measurements before exercise, it is important that the sensitive volume has not shifted by heavy workload and extensive motion. In patients, it might be difficult to measure the appropriate workload prior to the 31P-MR examination, since repeated measurements are not tolerated by patients who experience muscle pain with exercise. As long as pH drop is less than pH 6.75, the recovery curve can be fitted to an exponential curve (Forbes et al. 2009) (Fig. 3).
Application of electrically induced contractions (Vanderthommen et al. 2003) can be more reproducible than voluntary exercise, however, if they are supramaximal and thus independent of other factors, they are rather painful and not tolerated by patients. Therefore, an appropriate design of the ergometer and a precise monitoring of the voluntary workload are mandatory.
4 Magnetic Resonance Spectroscopy Studies of the Metabolism in Diseases of the Human Skeletal Muscle
MRS-methodology in studies of the metabolism of skeletal muscle can be roughly differentiated in four major categories: observation of oxidative phosphorylation by 31P-MRS, lipid metabolism as observed by 1H-MRS, carbohydrate metabolism observed by 13C-MRS, and some combinations of the above-mentioned categories.
While the first magnets for humans were still too small for whole-body examinations, it was however possible to study arms and legs in the small-bore/high-field magnets at rest or during exercise, which led to seminal papers in the field (Ross et al. 1981; Chance et al. 1982; Radda et al. 1982; Edwards et al. 1982; Newman et al. 1982; Eleff et al. 1984; Arnold et al. 1985; Wilson et al. 1985; Lewis et al. 1985). In these early days, physiologists recognized the value of 31P-MRS for studies of the oxidative phosphorylation of muscle tissue, which remained one of the major applications throughout the next decades as can be seen in the following sections. Since most clinical whole-body magnets were not equipped for non-proton-nuclei, the euphoria for 31P-MRS did not really spill over from physiology laboratories to radiological departments. On the other hand, the availability of artifact-free gradients in clinical whole-body systems fostered the application of 1H-MRS in all organs, including the musculoskeletal system. During all these years 13C-MRS remained an instrument for a few expert groups, however, this might change in future with the dissemination of hyperpolarized techniques in clinical whole-body magnets and the installation of MR systems with higher magnetic field strength.
4.1 General Reviews
The characterization of focal lesions such as the increase of choline in tumors will not be discussed in this chapter. Instead, the focus lies on metabolic musculoskeletal diseases or metabolic involvement of skeletal muscle in generalized diseases. MR spectroscopy of focal, mostly tumorous lesions in the musculoskeletal system is described in numerous publications, including some comprehensive review articles (Fayad et al. 2007, 2012; Glunde and Bhujwalla 2011; Wang et al. 2011; Glunde et al. 2011; Beloueche-Babari et al. 2011; Costa et al. 2011; Subhawong et al. 2012).
A first overview of metabolic studies of musculoskeletal diseases was published in Lancet as early as 1982 (Edwards et al. 1982) and has already shown the potential of the then called “topical nuclear magnetic resonance.” The effect of training was then described in an overview on metabolic versus non-metabolic myopathies (Taivassalo et al. 1999). In the following years, many reviews were published, describing the value of MRS for investigations of the musculoskeletal system (Argov and Bank 1991; Argov 1998; Taylor 2000; Argov et al. 2000; Vorgerd and Zange 2002; Miller 2002; Leroy-Willig et al. 2003; Parry and Matthews 2003; Mattei et al. 2004; Tarnopolsky and Raha 2005; Guis et al. 2005; Petersen and Shulman 2006; Boesch 2007; Savage et al. 2007; Weber et al. 2007; Kuo and Carrino 2007; Phielix and Mensink 2008; Wells et al. 2008; Schocke et al. 2008; Walker 2008; Lindquist 2008; Pedersen et al. 2009; Kent-Braun 2009; Lang et al. 2010; Phielix et al. 2011; Befroy and Shulman 2011; Befroy et al. 2012; Finanger et al. 2012; Tarnopolsky 2012).
4.2 Insulin Resistance, Glucose Transport, and Ectopic Lipids
The incidence of insulin resistance and the so-called metabolic syndrome is dramatically increasing, almost independent of the industrialization level of the countries that collect these statistical numbers. In particular in the older population, 40 % and more is affected by this crucial disorder. Since insulin resistance is a major risk factor for the development of cardiovascular diseases, it represents an enormous challenge for health care systems and dramatically reduces the quality of life for the individual patient.
Multinuclear MRS has served for more than a decade in the elucidation of insulin resistance and is currently increasingly used to better understand this major threat. One can distinguish three major fields where MRS has been and is currently used in the research on insulin resistance:
(a)
The understanding of glucose transport and glycogen synthesis in the skeletal muscle tissue.
(b)
Relation of insulin resistance and ectopic lipids, in particular IMCL.
(c)
Relation of insulin resistance and impaired mitochondrial activity, including the effect of aging.
Using 13C-MR spectroscopy, the Yale group has shown in a first step that muscle glycogen synthesis is the major non-oxidative approach for our body to lower high glucose concentrations in the plasma and that muscle glycogen synthesis is reduced in non-insulin-dependent-diabetes-mellitus (NIDDM) patients compared to healthy persons (Shulman et al. 1990). In a very elegant application of multinuclear MRS, the same group used 31P-MR spectroscopy to follow G6P during a hyperglycemic-hyperinsulinemic clamp (Rothman et al. 1992). Since G6P was lower in diabetic subjects compared to healthy controls, and since this could be restored by increased insulin concentrations in NIDDM subjects, it has been concluded that a defect in muscle glucose transport or phosphorylation leads to a reduced muscle glycogen synthesis in NIDDM patients. Figure 8 illustrates the respective biochemical pathways which allowed this conclusion. In order to distinguish a primary from an acquired defect that leads to this reduced glucose transport/phosphorylation, normoglycemic offspring of parents with overt diabetes mellitus were studied by a combination of 31P- and 13C-MRS (Rothman et al. 1995). These offspring showed reduced rate of muscle glycogen synthesis and muscle G6P concentrations, analogous to the NIDDM patients in the earlier study (Rothman et al. 1992) where the findings were explained by an impaired muscle glucose transport/hexokinase activity. The authors concluded that insulin-resistant offspring of parents with NIDDM have impaired muscle glucose transport/hexokinase activity even before the onset of overt hyperglycemia, subsequently leading to a reduced muscle glycogen synthesis (Rothman et al. 1995). Therefore, it was concluded that this might be the primary factor in the pathogenesis of NIDDM. In a follow-up study, the effect of 6 weeks’ exercise training on normoglycemic offspring of NIDDM parents was studied (Perseghin et al. 1996). While the concentrations of G6P and glycogen synthesis rate were lower in the offspring group as compared to controls without family history of NIDDM before the training period, it was restored to normal levels after 6 weeks of exercise training. It is remarkable that not only the offspring group increased glucose transport/phosphorylation with training but also the healthy control group, yet to a lesser extent than the offspring group. Obesity is often associated with reduced insulin sensitivity and a major risk factor for the development of NIDDM. Using again the combination of 13C- and 31P-MRS, the authors could show decreased muscle glucose transport and/or phosphorylation activity in a cohort of obese women (Petersen et al. 1998). It was concluded that insulin resistance in obesity can be mostly attributed to an impairment of reduced glucose transport and/or phosphorylation activity that leads to a limited ability of the body to reduce blood glucose concentrations by a synthesis of muscle glycogen. While the studies mentioned so far were conducted by clamp techniques with closely controlled insulin and glucose blood levels, a 13C-MRS study was designed to evaluate the day-to-day pathophysiology of impaired glucose metabolism in NIDDM (Carey et al. 2003). After the consumption of sequential mixed meals, the postprandial glycogen levels were significantly lower in the gastrocnemius muscle of the diabetic patients compared to healthy controls, showing the inability of insulin-resistant persons to reduce blood glucose levels by an efficient uptake of glucose into the muscle cell and subsequent synthesis of muscular glycogen.
Fig. 8
Simplified biochemical pathways and the respective metabolites that can be observed with multinuclear MRS. Examples of impaired metabolism in skeletal muscle as discussed in the text are shown in yellow boxes
The possibility to separate the 1H-MR signals from intra- (IMCL) and extra- (EMCL) myocellular lipids (see Fig. 6 and additional references in overview (Boesch et al. 2006)) led to an intense application of this technique in physiology and pathophysiology, in particular after several groups reported a negative correlation of insulin sensitivity and IMCL levels (Machann et al. 1998; Perseghin et al. 1999; Cline et al. 1999; Jacob et al. 1999; Krssak et al. 1999). For several years, contradicting results were found, depending on the cohorts who had been studied (insulin-resistant patients vs healthy persons and sedentary subjects vs trained athletes). The studies with cohorts of athletes showed a positive correlation of insulin sensitivity and IMCL levels (Decombaz et al. 2001), which was apparently contradicting the observation in NIDDM patients. This so-called “athlete paradox” was then solved in a comprehensive study by the Tübingen group who showed a complex, “u-shaped” relation of VO2max (as a measure of exercise capacity), IMCL levels, and insulin sensitivity (Thamer et al. 2003). While lower insulin sensitivity in subjects with low VO2max was related to high IMCL levels, athletes with high VO2max showed both high IMCL levels and high insulin sensitivity. This observation made it questionable that high IMCL levels in insulin-resistant subjects per se would be a cause for insulin resistance. On the contrary, it became more probable that high IMCL levels on their part were a consequence of insulin resistance. Newer concepts make now the accumulation of other lipid metabolites, such as diacylglycerol or fatty acyl CoAs, responsible for insulin resistance. However, this mechanism is not yet fully understood. It was also recognized that resting IMCL levels were affected by many factors, such as short-term exercise and diet. Since exercise was able to reduce IMCL levels significantly, exercise protocols were applied, however, with the disadvantage that insulin resistant and often obese patients were not able to show the same exercise performance. A low-level exercise diet regime was proposed, which should enable also patient groups with reduced exercise capacity to reduce IMCL levels effectively (Ith et al. 2010). In a study of obese children and adolescents it was found that intramyocellular and intra-abdominal lipid accumulation was linked to the development of peripheral insulin resistance (Weiss et al. 2003). A study on insulin-resistant offspring of diabetes type 2 parents showed increased IMCL levels (Petersen et al. 2004). Effects of insulin-sensitizing drugs were evaluated in multiple studies (Teranishi et al. 2007; Bajaj et al. 2010). Pioglitazone and metformin studies showed effects on the IMCL concentrations as observed by 1H-MRS, which might be secondary to changes of serum factors such as adiponectin (Teranishi et al. 2007). Pioglitazone was also found in another 1H-MRS study to reduce IMCL levels (Bajaj et al. 2010). Interethnic differences in the fat depot of muscle, liver, and abdomen were found in a study comparing Hispanics and African Americans with Caucasians (Liska et al. 2007). In contrast, no difference was found between African Americans and Caucasians for the infusion of intralipids with comparable increase of IMCL and reduction of insulin sensitivity (Lee et al. 2013).
It has been speculated that impaired mitochondrial function could explain the reduced ability of the diabetic muscles to metabolize glucose and fat. A study applied 31P-MRS in the heart and skeletal muscle and measured recovery of PCr in the skeletal muscle after exercise to get information on the mitochondrial functions (Scheuermann-Freestone et al. 2003). The authors concluded that diabetes type 2 patients have impaired myocardial and skeletal muscle energy metabolism despite apparently normal cardiac function. In a study with healthy elderly subjects it was found that they were significantly less insulin-sensitive than body-mass-matched young controls (Petersen et al. 2003). The IMCL levels were increased and mitochondrial oxidative and phosphorylation activity was reduced as measured by 13C-MRS with labeled [2-13C] acetate infusion and 31P-MRS saturation transfer, respectively. The authors concluded that elderly subjects show a decline in mitochondrial function which in turn is responsible for the higher incidence of insulin resistance in the elderly. In a study with overweight and normal-weight children, no difference in the oxidative phosphorylation was found between the two groups as measured by PCr recovery after exercise (Fleischman et al. 2009). Furthermore, oxidative phosphorylation was dependent on the insulin sensitivity of all the participants of the study, supporting the hypothesis of a relation between metabolic function and insulin sensitivity. However, this hypothesis of mitochondrial function as a cause of insulin resistance has been challenged by another study which found elevated IMCL levels in m.vastus lateralis of insulin-resistant patients as compared to healthy controls, but no differences in the oxidative phosphorylation as measured by 31P-MRS and PCr recovery after exercise (De Feyter et al. 2008). A subsequent study of the same authors with a one-year exercise training of the diabetes type 2 patients came to the conclusion that mitochondrial dysfunction was apparent only in inactive longstanding T2DM patients (van Tienen et al. 2012). This would support the hypothesis that mitochondrial function and insulin resistance are not related. In addition, exercise training could positively influence mitochondrial activity in diabetes type 2 patients. Because of the enormous impact of insulin resistance on our health care system and individual patients, in particular the elderly, further studies—including ones which apply MR spectroscopy—are necessary.
4.3 Glycogen Storage Diseases
Glycogenoses (Vorgerd et al. 2002a) in general, and McArdle’s disease in particular (glycogenosis type V), have been in the interest of MRS since the very beginning, on the one hand because it was one of the first observations (Ross et al. 1981) of the value of 31P-MRS, and on the other hand because the pH development during exercise is pathognomonic in McArdle’s disease. For a systematic review of glycogenoses, clinical reviews are available (Vorgerd and Zange 2002; Vorgerd et al. 2002a). In the following, glycogenoses are listed not systematically but according to the role that MR spectroscopy has played in the past.
McArdle’s disease (glycogenosis type V) is an autosomal recessive inherited defect of the muscle glycogen phosphorylase which leads to a reduced ability to use glycogen reserves when energy is needed. In a seminal paper, Ross et al. (1981) have shown the potential of 31P-MRS to follow the pH development during exercise which—in contrast to healthy subjects—becomes alkaline in McArdle patients. In addition, PCr depletion and Pi increase during exercise is much more pronounced in these patients. Figure 8 illustrates that a reduced breakdown of glycogen is responsible for the fact that glycogen reserves cannot be used during exercise in the same amount as in healthy subjects (Argov et al. 1987). In turn, it has been shown that glucose infusion leads to an improvement in the clinical symptoms and the PCr reduction (Lewis et al. 1985), since glucose gets available via glucose transport to the cell instead of the impaired glycogenolysis. In a family with multiple consanguinities and parents with overt McArdle’s disease, 31P-MRS has shown the pathognomonic pH-behavior in a so far totally asymptomatic 5-year-old boy (Gruetter et al. 1990). In a comparison of 31P-MRS data and T2-MRI-measurements, McArdle patients neither showed a pH drop nor changes of T2 as seen in healthy controls (deKerviler et al. 1991). Using 13C-MR spectroscopy, it was possible to directly observe the glycogen reserves in skeletal muscle and thus to distinguish McArdle patients with increased glycogen levels from healthy controls (Jehenson et al. 1991). Figure 8 also shows this potential of observing the metabolism in vivo at different places of the biochemical pathways using MRS of different nuclei. In a patient suffering from glycogenosis type VI (liver glycogen phosphorylase deficiency), where muscle is not involved, normal glycogen levels were found in skeletal muscle, yet increased glycogen levels were observed in liver, thus allowing a differentiation from McArdle glycogenosis where skeletal muscle is affected (Labrune et al. 1992). Different phases of the exercise-related changes in 31P-MR signals in McArdle patients were reported in more detail, such as the transient Pi disappearance at the onset of recovery (Bendahan et al. 1992a), the failure to show cytosolic acidification and PME accumulation (Siciliano et al. 1995), the indirectly observed ADP (Argov et al. 1996), or functional compartmentation with a small number of muscle fibers that reach metabolic depletion earlier than the majority (Zange et al. 2003). 31P-MR spectroscopy was also used to follow and quantify effects of treatment on McArdle patients, such as infusion of amino acids which did not change working capacity (Jensen et al. 1990), medication with Ramipril (an angiotensin-converting enzyme inhibitor) and Gentamycin which both showed no effect on 31P-MRS parameters (Schroers et al. 2006; Martinuzzi et al. 2008), and creatine therapy which resulted in a certain improvement of skeletal function (Vorgerd et al. 2000), however, at the cost of neurologic adverse effects at higher dosage of creatine (Vorgerd et al. 2002b). The model of cellular acid–base balance was found to describe cellular pH changes during both exercise and recovery in McArdle’s disease adequately (Kemp et al. 2009). A comparison of 31P-MRS results and muscle sympathetic nerve activity in a group of McArdle and two other glycogenoses’ patients (Vissing et al. 1998) led to the conclusion that muscle acidosis is not necessary to generate sympathetic activation in exercise.
While glycogenolysis is impaired in McArdle’s disease, and thus the glycolysis path is inhibited (pathways illustrated in Fig. 8), phosphofructokinase (PFK) deficiency (Glykogenose type VII, Tarui-disease) leads to a block in a next step of glycolysis. The resulting trapping of phosphorylated sugar compounds should be observable by 31P-MRS. In a seminal paper, Britton Chance’s group has shown the increased sugar phosphates and was able to enlighten the control mechanisms of mitochondrial activity which they assigned to ADP (Chance et al. 1982). The behavior of the sugar phosphate peak was evaluated in an early study in various glycogenoses (Duboc et al. 1987), including PFK, and it was shown that sugar phosphates can be used to differentiate glycogenoses, being high in PKF deficiency (type VII) and phosphoglycerate kinase (type IX) deficiency, while it was undetectable in lacking debrancher enzyme (type III) and McArdle (type V). Using 31P-MRS, it could be shown that lactate infusion increases oxidative phosphorylation in PFK patients (Bertocci et al. 1993) by a bypass of the PFK step. A case report of a late-onset PFK deficiency led the authors of the 31P-MR study to conclude that progressive polysaccharide accumulation was the source of the clinical signs and less an acute shortage of energy supply in the muscle fibers (Massa et al. 1996). Another group observed the known accumulation of PME during exercise and came to the conclusion that continuing episodes of muscle fiber destruction were responsible for the late-onset muscle weakness (Sivakumar et al. 1996). A comparison of an asymptotic heterozygous PFK patient with homozygous patients (Grehl et al. 1998) closed with the assumption that the turnover of the TCA cycle was reduced in homozygous PFK patients.
Other glycogenoses with involvement of the skeletal muscle were evaluated by various MRS techniques. A patient suffering from debrancher enzyme deficiency (M. Cori-Forbes, glycogenosis type IIIA) showed increased glycogen levels as shown by 13C-MRS (Beckmann et al. 1990; Wary et al. 2010) and elevated pH and accumulation of PME as shown by multiparametric MRI/MRS (Wary et al. 2010). Phosphoglycerate mutase deficiency (glycogenosis type X) patients showed accumulation of PME only on fast “glycolytic” exercise at 31P-MRS (Vita et al. 1994). Glycogen/creatine as observed by undecoupled 13C-MRS was significantly higher in a group of acid maltase deficiency (glycogenosis type II, Pompe’s disease) patients compared to healthy volunteers, with glycogen concentrations above the normal 95 % confidence limits in 7 of the 11 patients (Wary et al. 2003).
4.4 Mitochondrial Myopathies
Mitochondrial myopathies belong to the metabolic myopathies and describe a very heterogeneous group of defects in biochemical pathways that take place in the mitochondria (Tarnopolsky and Raha 2005; DiMauro 2006). Since oxidative phosphorylation, i.e., defects in the mitochondrial respiratory chain, can be observed noninvasively by 31P-MR spectroscopy, it is logical that many 31P-MRS publications deal with the heterogeneous group of mitochondrial diseases mainly to increase the understanding of mitochondrial processes and less for individual diagnoses.
In recent years, mitochondrial disorders were grouped along the mutations in mitochondrial DNA and tRNA (DiMauro 2006), however, a description of MRS examinations along these categories would go far beyond the scope of this article. In addition, some of the mitochondrial mutations (e.g. A3243G) can be responsible for a spectrum of diverging clinical syndromes ranging from MELAS (mitochondrial encephalopathy, lactic acidosis, and stroke-like episodes) to MIDD (maternally inherited diabetes and deafness). Therefore, the grouping is organized along the historical sequence and the impact for the applications of MR spectroscopy.
In their seminal papers on the MRS examination of two patients with NADH-CoQ reductase deficiency, the Oxford group introduced 31P-MRS for studies of myopathies and in particular the concept of PCr recovery after exercise (Gadian et al. 1981; Radda et al. 1982). This defect in the electron transport chain of the mitochondria led to an abnormal recovery of PCr and pH after exercise of the forearm, thus allowing an assessment of the relative importance of oxidative and glycolytic regeneration of high-energy phosphates. A 15-year-old girl with deficiency of NADH-CoQ reductase activity showed reduced PCr and increased Pi, and ADP levels in muscle showed analogous 31P-MRS values also in the brain (Hayes et al. 1985). In a group of 12 various mitochondrial myopathy patients, 11 patients showed an abnormality in the 31P-MR spectra at rest (Arnold et al. 1985). In order to estimate the apparent maximum rate of oxidative ATP synthesis (QMAX) in various pathologies, including a group of 20 mitochondrial myopathy patients, Kemp et al. (1993b) used the hyperbolic relationship between cytosolic [ADP] and the rate of PCr resynthesis after exercise. It could be shown that QMAX was reduced and [ADP] increased in the group of mitochondrial myopathies. In a girl suffering from NARP (Neuropathy, ataxia, and retinitis pigmentosa), increased resting inorganic phosphate and lower PCr concentrations could be demonstrated (Lodi et al. 1994). Three members of a family affected with Leber’s hereditary optic neuropathy (LHON) showed an altered mitochondrial energy metabolism in muscle and a mutation of 11778 mtDNA (Cortelli et al. 1991). This observation in LHON patients was supported by another 31P-MRS study where six of nine patients with the mutation showed a low rate of post-exercise PCr recovery (Barbiroli et al. 1995). Normal findings at 31P-MRS were observed in carriers with low percentage of mutated mtDNA. A 31P-MRS study in 10 LHON patients revealed a reduced maximal mitochondrial ATP production after exercise depending on the exact type of mutation (Lodi et al. 1997b). In a study with 14 patients suffering from defects of mitochondrial respiratory chain enzymes, a series of indices derived from the PCr recovery curve matched in 10 of 14 cases with conventional test scores while no obvious correlation existed between pH parameters and clinics (Kuhl et al. 1994). In a comparison of 22 well-defined mitochondrial myopathy patients with 24 patients with unclear exercise tolerance, 17/24 unassigned also showed ADP recovery at 31P-MRS examinations (Argov et al. 1997). The authors concluded that many patients suffering from exercise intolerance of undetermined origin may have impaired muscular oxidative metabolism that could be proven by 31P-MRS examinations.
In addition to these studies, which essentially confirmed clinical findings, a series of 31P-MRS publications gave additional information beyond the clinical symptoms. While only three out of eight MERRF patients (myoclonus epilepsy with ragged red fibers) had myopathic symptoms, 31P-MRS showed significantly increased relative intracellular inorganic phosphate concentrations (Matthews et al. 1991). A case report on two brothers with A3243G mutations showed that even very low levels of mutations can already affect mitochondrial ATP production considerably (reduction to 21 % with 85 % mutation level vs. 35 % in the less affected brother with 6 % mutations only) (Chinnery et al. 2000). A report that is particularly interesting in view of the discussion of a mitochondrial involvement in insulin resistance has been published by van Elederen et al. (van Elderen et al. 2009). In a group of 11 patients with MIDD (with an A3243G mutation), 6 patients presented with and 5 presented without diabetes mellitus. The MIDD patients showed a prolonged recovery of PCr, however, no association was found with the presence of diabetes mellitus. While these studies show the potential of 31P-MRS to provide additional information on mitochondrial myopathies, a critical review on the sensitivity of 31P-MRS tests was published by Jeppesen et al. (Jeppesen et al. 2007) who found an almost 100 % specificity of some 31P-MRS variables for the detection of mitochondrial myopathies, however, with a low sensitivity between 0 and 63 %.
Since 31P-MRS provides quantitative data on oxidative phosphorylation, it is attractive to use this method to follow treatment effects in mitochondrial myopathy patients in addition to an observation of the clinical signs. The treatment with coenzyme Q has been studied several times with the help of 31P-MRS, however, the findings are not yet conclusive both for the 31P-MRS findings and for the clinical symptoms. Therapy with coenzyme Q10 plus vitamins K3 and C, riboflavin, thiamine, and niacin was evaluated by Matthews et al. (1993) who found no significant improvement in clinical symptoms or in 31P-MRS measures of oxidative metabolism. Treatment of eight patients suffering from various mitochondrial myopathies with coenzyme Q led the authors to conclude that a single responder showed a beneficial effect but would not represent the whole group (Gold et al. 1996). The authors suggested monitoring treatment with objective metabolic tests to identify responders for long-term treatment. In contrast, Bendahan et al. found positive treatment effects with coenzyme Q in two patients with electron transport chain defects (Bendahan et al. 1992b). Bicycle ergometer tests and 31P-MRS showed significant improvement, in particular an increase in the PCr/Pi ratio at rest and faster kinetics of recovery for pH, PCr, and PCr/Pi ratio following exercise. A study with patients suffering from different mitochondrial cytopathies showed a beneficial effect of 6-month treatment with coenzyme Q10, such that the mitochondrial muscular function, which was reduced to levels of 29 %, improved to levels of 56 % from the control group (Barbiroli et al. 1997).
A series of other treatments were tested using 31P-MRS with differing outcomes. Fifteen patients suffering from progressive external ophthalmoplegia (CPEO) or Kearns-Sayre syndrome (KSS) obtained creatine over a period of 6 weeks (Kornblum et al. 2005). Neither clinical symptoms nor 31P-MRS findings were changed with the treatment. In particular, there was no improvement of post-exercise PCr recovery. A positive treatment effect has been reported for the application of menadione and ascorbate in patients with defects in complex III of the electron transport chain (Eleff et al. 1984). While PCr/Pi recovery from exercise was 2.5 % of normal at baseline, treatment improved it to within 56 % of the recovery rate of controls. MELAS patients treated with riboflavin and nicotinamide for 18 months showed positive effects of treatment on PCr/ATP recovery rates and on Pi/PCr (Penn et al. 1992). Methylprednisolone treatment of a family of five generations with mitochondrial myopathy and a documented respiratory chain enzyme defect resulted in a significant improvement of resting 31P-MRS findings (Heiman-Patterson et al. 1997). The acute application of oxygen did not change 31P-MR spectra at rest in six patients with CPEO and MELAS. Nevertheless, it improved maximal ATP synthesis rate by 33 % in the patients while it changed it by only 5 % in healthy controls (Trenell et al. 2007). Two reports agree on the positive effect of exercise on patients with mitochondrial myopathies (Taivassalo et al. 1998; Trenell et al. 2006a). Aerobic exercise for 8 weeks improved ADP recovery by more than 60 % in ten patients with mitochondrial myopathies (Taivassalo et al. 1998) while 12 weeks of exercise training improved mitochondrial function in 10 CPEO and MELAS patients (Trenell et al. 2006a).
4.5 Muscular Dystrophies
Muscular dystrophies are a group of—generally inherited—muscular diseases that are characterized by muscle weakness and progressive destruction of the muscle tissue.
The most prominent muscle dystrophies are Morbus Duchenne (DMD) and Becker (BMD)—both have been widely studied with the help of 31P-MRS following the very first, seminal publication on six patients suffering from Duchenne muscular dystrophy (Newman et al. 1982). PCr/ATP and PCr/Pi were reduced in these patients, obviously based on reduced PCr concentrations, while a signal in the PDE region showed up and the intracellular pH in the patients was abnormally alkaline. 1H-MR spectra of the Duchenne patients showed a much higher lipid peak in the affected muscles than controls. In a 1H-MRS study of eight DMD boys and eight healthy controls, ratios of TMA/water, tCr/water, and TMA/tCr were significantly lower in patients than in volunteers (Hsieh et al. 2009). In addition, fatty infiltration of the muscles has been documented in all patients. Muscle function scores and TMA/tCr were negatively correlated in the patients. A randomized, placebo-controlled 31P-MRS study of creatine treatment in 33 DMD patients (18 creatine, 15 placebo) showed increased PCr/Pi levels in the verum group (Banerjee et al. 2010). While parents reported subjective improvement in the treatment group, no change in the functional state was observed. A combination of 1H- and 31P-MRS in nine boys with DMD and eight healthy age- and BMI-matched boys revealed higher fat fractions, higher pH values in the anterior compartments, and lower PCr/Pi in the posterior compartments (Torriani et al. 2012). The author concluded that lower leg muscles of boys with DMD show a distinct involvement pattern and that a noninvasive evaluation might help to demonstrate the severity of muscle involvement. Female DMD/BMD carriers were investigated in a 31P-MRS study which showed a reduced rate of post-exercise recovery of PCr/Pi ratio in all carriers (Barbiroli et al. 1992). A detailed analysis of the 31P-MRS signals during the evolution of exercise in the skeletal muscle of 14 Becker muscular dystrophy patients showed a distinct behavior of the pH (Lodi et al. 1999b). The authors interpreted the findings as reduced glucose availability in dystrophin-deficient muscles. During incremental workload, nine mildly affected BMD patients showed deregulation of resting pH and a slightly increased PDE signal which might indicate intramuscular membrane breakdown at 31P-MRS examinations (Tosetti et al. 2011).
Other muscular dystrophies that have been investigated with the help of multinuclear MRS are Myotonic Dystrophy, Oculopharyngeal Muscular Dystrophy (OPMD), Limb Girdle Muscular Dystrophy (LGMD), and Facioscapulohumeral Muscular Dystrophy (FSHD). In 15 patients suffering from myotonic dystrophy intracellular pH was normal, but there were significant elevations in the concentration ratios of Pi/ATP, PME/ATP, PDE/ATP, and—in more affected patients—a reduced PCr/ATP ratio (Taylor et al. 1993). During exercise, there was less muscle acidification in patients with myotonic dystrophy while the PCr recovery was normal after workload with high levels of [ATP]. The authors concluded that oxidative capacity was normal in myotonic dystrophy patients. A 23Na-MRS study of seven myotonic dystrophy patients at various stages of the disease and 11 healthy volunteers showed an increased total sodium content and fast transverse relaxation time, which was correlated with the severity of the disease (Kushnir et al. 1997). The authors concluded that 23Na-MRS enables the quantitation of myotonic dystrophy progression. A 31P-MRS followed the beneficial effect of 12 weeks exercise therapy in a patient with myotonic dystrophy (Trenell et al. 2006b). At rest, muscle PDE and pH were elevated while the recovery halftime of PCr was prolonged. After 12 weeks of aerobic exercise therapy, PCr/Pi and PCr recovery halftime improved while resting pH and PDE remained unchanged. In five siblings suffering from autosomal dominant OPMD pH was elevated and PCr was reduced at rest as compared to controls (Zochodne et al. 1992). Exercise-induced reduction of PCR and acidosis was more pronounced than in controls except in one patient who showed normal 31P-MRS values at rest and during exercise. The authors concluded that OPMD is a more widespread disorder of striated muscle than clinically appreciated. Seven patients with LGMD showed normal 31P metabolite concentrations at rest but the cytosolic pH was increased. Muscle oxidative metabolism was normal in LGMD patients (Lodi et al. 1997a). A 31P-MRSI study of nine FSHD patients showed that metabolic changes, i.e., impaired metabolite levels and pH, were only present in muscle groups with fatty infiltration (Kan et al. 2010) (Fig. 9).
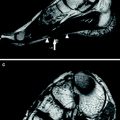
Fig. 9
a A T1-weighted MR image and a 31P-MRSI data set with two spectra (b, c) from a patient with FSHD. Metabolites are only altered in regions with fatty infiltration. Spectrum (b) from the affected m.gastrocnemius medialis (red star) shows a smaller SNR due to lower metabolite concentrations and a reduced PCR/ATP ratio while spectrum (Cr) from the unaffected m. gastrocnemius lateralis (green star) shows metabolite levels as in healthy subjects (not shown). This example also illustrates a different way to display CSI data set compared to Fig. 7 where one specific metabolite is color-coded. Spectra (b, c) are scaled to the γ-ATP resonance (adapted with permission (Kan et al. 2010))
4.6 Inflammatory Myopathies
Dermatomyositis and polymyositis are the most prominent inflammatory myopathies and studies are sometimes performed in combined groups of both patient categories.
An MRI/31P-MRS study of four patients with dermatomyositis and five controls showed ATP and PCr levels 30 % below controls and increased Pi levels at rest and during exercise (Park et al. 1990). T 1 and T 2 values determined by MRI and 31P-MRS metabolite data correlated with symptoms and clinical tests. Amyopathic variants of dermatomyositis patients present with the typical rash but without severe muscle weakness, while myopathic dermatomyositis includes erythematous rash and severe, proximal muscle weakness (Park et al. 1995). Nine patients with amyopathic and 11 patients with myopathic dermatomyositis were compared with 11 healthy subjects, using 31P-MRS. While amyopathic patients showed no muscle inflammation and normal MRS data at rest, the MRS data revealed significant differences between amyopathic DM patients and control subjects during exercise. Myopathic patients showed differences from healthy controls already at rest. The authors concluded that 31P-MRS is able to unmask the hidden defect in amyopathic patients during exercise. The development of an artificial network analysis showed usefulness in a longitudinal study on 10 amyopathic and 17 myopathic patients (Park et al. 1998a). Juvenile dermatomyositis was evaluated in 13 patients and revealed significant metabolic abnormalities in the thigh muscles of 10 severely affected patients during rest, exercise, and recovery (Park et al. 2000). At rest ATP and PCr levels were 35–40 % below the values in controls and Pi/PCr levels were increased together with ADP levels. The three patients with normal MRS findings had either improved under prednisone treatment or had an amyopathic variant of juvenile dermatomyositis, respectively. Short-term alterations of 31P-metabolites were specifically addressed in a study with 10 dermatomyositis patients and 18 healthy controls (Pfleiderer et al. 2004).
Combined groups of dermatomyositis and polymyositis patients showed increased ratios of Pi to PCr during exercise (Newman and Kurland 1992). A study including nine dermatomyositis and five polymyositis patients together with 18 age-matched controls revealed impaired 31P-MRS values in both groups; however, there was no correlation between the MRS-detectable abnormalities and the degree of inflammation or MRI-determined fatty infiltration of the muscle (Cea et al. 2002). From the observation of a reduced proton efflux, the authors concluded that the impaired muscle function is secondary to an impaired blood supply. Treatment effects with creatine plus exercise during 6 months were followed in combined groups of 37 dermatomyositis or polymyositis patients (Chung et al. 2007). A test for muscle function showed significantly improved performance with both creatine and placebo while PCr/ATP increased significantly in the creatine group only. Using 31P-MRS and near infrared spectroscopy (NIRS), 12 polymyositis patients were evaluated before and after steroid therapy and compared with 12 healthy controls (Okuma et al. 2007). Before steroid therapy, polymyositis patients had markedly lower intracellular pH during exercise and experienced a significantly slower recovery than normal individuals. Following steroid therapy, the pH drop during exercise was less dramatic and the recovery time after exercise was shortened. In a study with seven patients with sporadic inclusion body myositis, 8 normal controls and 20 mitochondrial myopathies, six of seven myositis patients showed elevated Pi values while PCr recovery time after exercise was not increased—in contrast to the mitochondrial myopathy patients in the comparison (Argov et al. 1998). The authors concluded that mitochondrial oxidative capacity is not impaired in inclusion body myositis. While not strictly an inflammatory myositis, macrophagic myofascitis has been studied in nine patients using 31P-MRS (Guis et al. 2004). It was found that no differences in the MRS indices for oxidative energy metabolism exist between these patients and controls and that thus the observed clinical symptoms cannot be explained by an underlying anomaly of muscle energy metabolism.
Related posts:
 of Skeletal Muscle in Neuromuscular Disease: A Clinical Perspective
 of Skeletal Muscle Anatomy to MRI and US Findings
 MRI for Evaluation of the Entire Muscular System
 MR Imaging of the Skeletal Musculature: From Static Measures to a Dynamic Assessment of the Muscular (Loco-) Motion
 in Muscle Tumors and Tumors of Fasciae and Tendon Sheaths
 of Muscle Injuries
Stay updated, free articles. Join our Telegram channel

Full access? Get Clinical Tree


