Mechanical
Degenerative disc
Degenerative joint disease
Vertebral fracture
Spondylosis
Muscle strain
Neurogenic
Herniated disc
Spinal stenosis
Rheumatologic
Inflammatory spondylitis
DISH
Fibromyalgia
Neoplastic/infiltrative
Benign/Malignant, metastatic
Infection
Spondylodiscitis
Osteomyelitis
Referred visceral pain
AAA, pancreatitis
Miscellaneous
Depression
Malingering
Clinical Presentation
Patients with DDD may be asymptomatic, have acute or chronic low back pain, or present with neurologic sequelae. Symptoms and clinical evaluation will help separate those with and without mechanical etiologies. LBP is a leading cause of disability and can be difficult to treat. Chronic LBP is present if symptoms last more than 3 months. Care should be taken to identify red flags, which require urgent investigation (Table 15.2).
Table 15.2
Red flags in patients with back pain
Onset <20 or >55 years |
Sphincter or gait disturbance |
Saddle anesthesia |
Severe or progressive motor loss |
Widespread neurologic deficit |
Previous carcinoma |
Systemic unwellness |
HIV |
Weight loss |
IV drug abuse |
Steroids |
Structural deformity |
Imaging
Radiographs
Radiographs are limited in the assessment of DDD. Degenerative changes are common and nonspecific. Radiographs can be acquired in patients with red flags as the initial line of investigation to help localize pathology for a more detailed cross-sectional imaging study. Vertebral body number, height, and intervertebral disc space height should be assessed (Fig. 15.1). In DDD, there is a loss of intervertebral disc space height, associated reactive vertebral endplate sclerosis, and multidirectional endplate osteophytes. Vacuum phenomena are collections of gas, predominantly nitrogen, and occur in sites of negative pressure within the nucleus pulposus (Fig. 15.2). Vacuum phenomena are a good indicator of DDD and may be circular or linear in appearance. They increase in extension related to the increased distraction of the degenerative disc. Small foci confined to the annulus may occur in spondylosis deformans. In cases of endplate disruption such as Schmorl’s nodes, gas may track into the vertebrae with a vertical branching pattern.
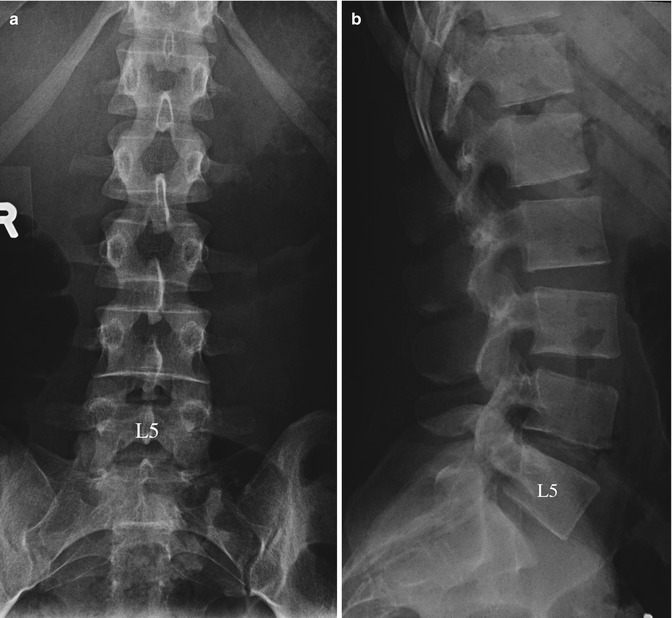
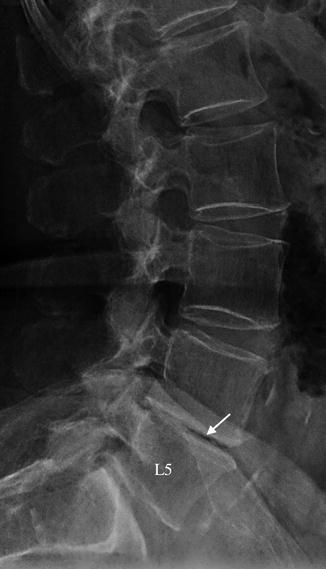
Fig. 15.1
Normal (a) AP and (b) lateral lumbar spine. L5 indicates the fifth lumbar vertebra. Note the excellent demonstration of the sacroiliac joints on a well-positioned AP study
Fig. 15.2
Lateral radiograph lumbar spine in an 80-year-old female with L4–5 and L5–S1 degenerative disc disease demonstrating loss of intervertebral disc space height, vacuum phenomenon (arrow L4–5), minor endplate sclerosis, and minimal osteophytic lipping. Note moderate osteopenia
Cross-Sectional Imaging
We will adopt the accepted nomenclature from the combined taskforce developed to standardize description of discs (Table 15.3). This is a morphologically based definition and classification model.
MRI
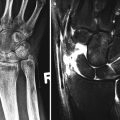
MRI is the noninvasive gold imaging standard in the imaging of DDD with excellent anatomical detail, soft tissue contrast, and lack of radiation. MRI can assess the internal characteristic of the disc. The normal bright nucleus pulposus on T2 losses signal as it desiccates (Fig. 15.3). Vertebral body height, alignment, and disc space height are assessed. CT is more sensitive in the assessment of osteophytes, but MRI can demonstrate Modic endplate changes which, other than sclerosis, may not be visible on CT (Table 15.3). The high signal intensity of CSF on T2-weighted sequences allows for an excellent contrast with the intermediate to low signal intensity disc.
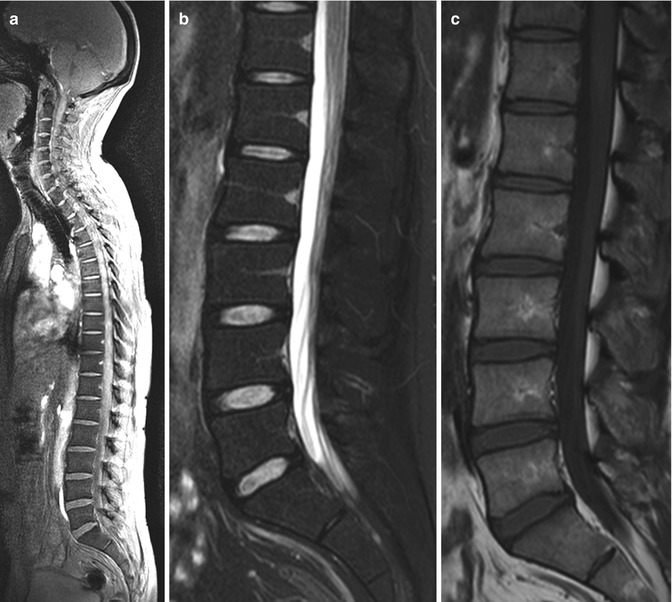
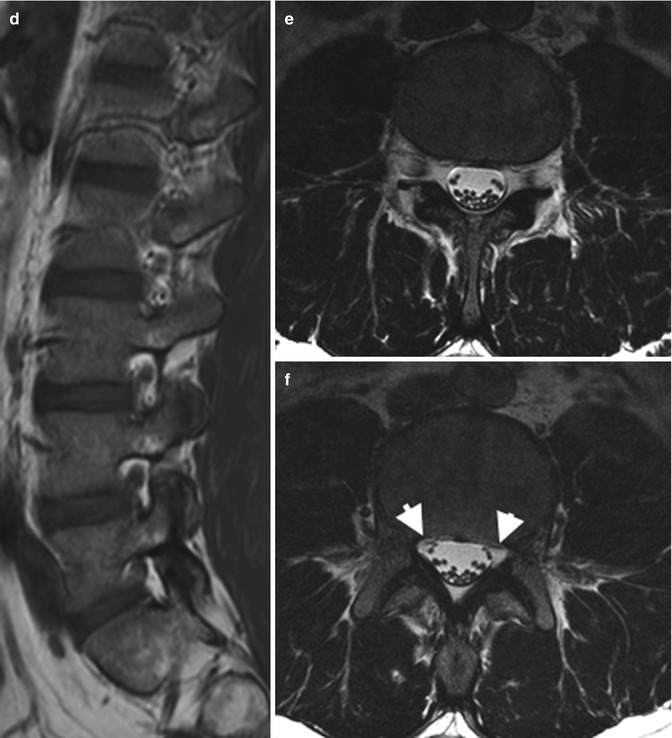
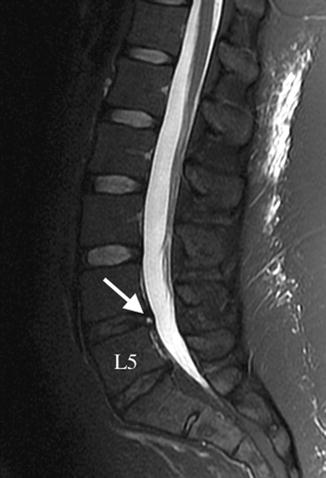
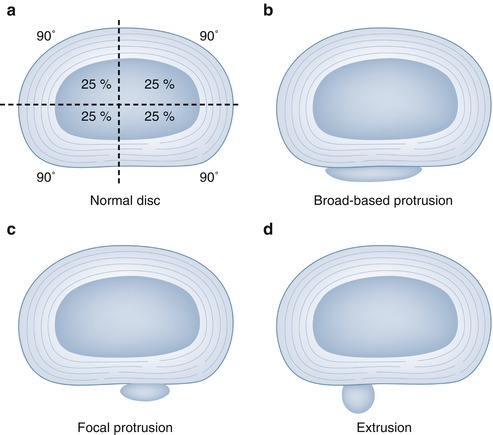
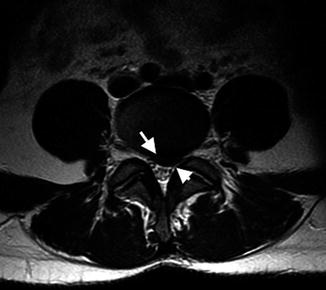
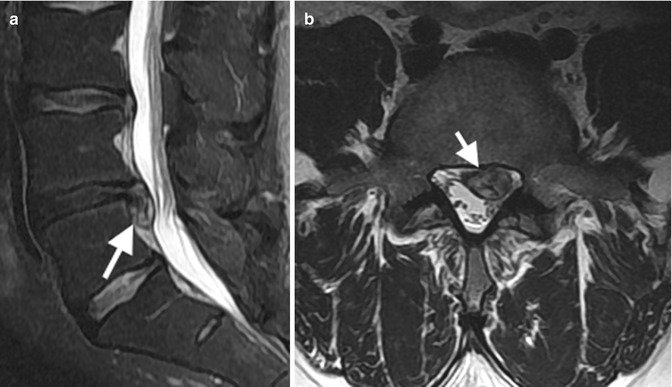
Fig. 15.3
Normal MRI lumbar spine: (a) localizer midsagittal image allows for correct counting lumbar vertebrae, (b) Sag T2FS demonstrating uniform fat-suppressed marrow SI, central high and peripheral low SI disc and high SI CSF, (c) Sag T1 normal morrow SI, low SI CSF, (d) Sag T1 through neural foramina demonstrating exciting neural roots and perineural fat, (e) axial T2FS at disc level demonstrating the thecal sac with high SI CSF and low SI dots representing the cauda equina/nerve roots, and (f) inferior to (e) at level lateral recesses (arrows)
Table 15.3
Nomenclature and classification of lumbar disc pathology
Normal (Fig. 15.3) | Disc is fully and normally developed and free of disease, trauma, or aging |
Annular tear/fissure (Fig. 15.4) | Loss integrity annulus, radial/transverse/concentric in shape |
Degenerative disc | Aging and pathologic degenerative changes. Changes in a disc characterized by desiccation, fibrosis and cleft formation in the nucleus, fissuring and mucinous degeneration of the annulus, defects and sclerosis of endplates, and/or osteophytes at the vertebral apophyses |
Degenerative disc disease | A clinical syndrome characterized by manifestations of disc degeneration and symptoms thought to be related to those changes |
Herniated disc (Fig. 15.5) | Localized (less than 50 %/180°) of the circumference of the disc displacement of nucleus, cartilage, fragmented apophyseal bone, or fragmented annular tissue beyond the intervertebral disc space (disc space, interspace). The interspace is defined, cranial and caudal, by the vertebral body endplates and, peripherally, by the edges of the vertebral ring apophyses, exclusive of osteophytic formations |
Chronic disc herniation | Disc herniation with the presence of calcification, ossification, or gas accumulation within the displaced disc material, suggesting that the herniation is not of recent origin |
Protrusion (Fig. 15.6) | A disc is “protruded,” if the greatest distance, in any plane, between the edges of the disc material beyond the disc space is less than the distance between the edges of the base in the same plane. The term “protrusion” is only appropriate in describing herniated disc material. Protrusions with a base less than 25 % (90°) of the circumference of the disc are “focal.” If disc material is herniated so that the protrusion encompasses 25–50 % of the circumference of the disc, it is considered “broad-based protrusion” |
Extruded disc (Fig. 15.7) | A herniated disc in which, in at least one plane, any one distance between the edges of the disc material beyond the disc space is greater than the distance between the edges of the base in the same plane, or when no continuity exists between the disc material beyond the disc space and that within the disc space. Extruded discs in which all continuity with the disc of origin is lost may be further characterized as sequestrated. Disc material displaced away from the site of extrusion may be characterized as migrated |
Bulging disc | A disc in which the contour of the outer annulus extends, or appears to extend, in the horizontal (axial) plane beyond the edges of the disc space, over greater than 50 % (180°) of the circumference of the disc and usually less than 3 mm beyond the edges of the vertebral body apophyses. This is not a form of herniation |
Radial annular tear/fissure (Fig. 15.4) | Disruption of annular fibers extending from the nucleus outward toward the periphery of the annulus, usually in the vertical (craniocaudal) plane, with occasional horizontal (transverse) components |
Spondylosis deformans | Degenerative process of the spine involving essentially the annulus fibrosus and characterized by anterior and lateral marginal osteophytes arising from the vertebral body apophyses, while the intervertebral disc height is normal or only slightly decreased |
Modic changes | Reactive vertebral body modifications associated with disc inflammation and degenerative disc disease, as seen on MR images. Type 1 refers to decreased signal intensity on T1-weighted/increased signal intensity on T2-weighted images, indicating bone marrow edema associated with acute or subacute inflammatory changes. Types 2 and 3 indicate chronic changes. Type 2 refers to increased signal intensity on T1-weighted images/isointense or increased signal intensity on T2-weighted images, indicating replacement of the normal bone marrow by fat. Type 3 refers to decreased signal intensity on both T1- and T2-weighted images, indicating reactive osteosclerosis |
Fig. 15.4
Annular tear shown as a high signal intensity zone (arrow) in posterior L4–5 degenerative disc (loss normal signal intensity and height, also present at L5–S1) in a 31 F on midsagittal T2FS
Fig. 15.5
Illustration herniated disc types: (a) normal disc divided into four quadrants, (b) broad-based protrusion with >25 % disc circumference involved, (c) focal protrusion involving less than 25 % disc circumference, and (d) extruded disc
Fig. 15.6
Axial T2FS at L4–5 demonstrating a focal protrusion, base disc herniation wider than AP extension and involving less than 25 % disc circumference, indenting the thecal sac, impinging the left L5 nerve root (arrowhead), and abutting without impinging the right L5 nerve root
Fig. 15.7
Extruded disc (arrow) with inferior migration, without sequestration, at L4–5 extending into the left lateral recess and impinging the left L5 and upper sacral nerve roots (a) Sag and (b) axial T2FS
Facet joint degeneration includes joint space loss, and subchondral sclerosis can be readily assessed. Related osteophytosis may extend anteriorly and encroach upon the neuroforamina. With the loss of intervertebral disc height, the ligamentum flavum also decreases in height, is less stretched, and hence can form more mass effect upon the thecal sac (see Fig. 15.20c). In patients with prior disc surgery, intravenous contrast may be required to help differentiate recurrent disc disease from postoperative fibrosis. Postoperative residual disc may enhance up to 6 months postsurgery after which time only epidural fibrosis typically enhances (Fig. 15.8).
Fig. 15.8


Degenerative disc disease on reformatted Sag CT, bone windows, demonstrating loss of disc height, vacuum phenomenon, minor endplate osteophytosis L5–S1. Less pronounced degeneration at L4–5. Note imaging features of Baastrup disease, contacting adjacent spinous processes demonstrating cortical irregularity and sclerosis (arrow)
Related posts:

Stay updated, free articles. Join our Telegram channel
Full access? Get Clinical Tree
