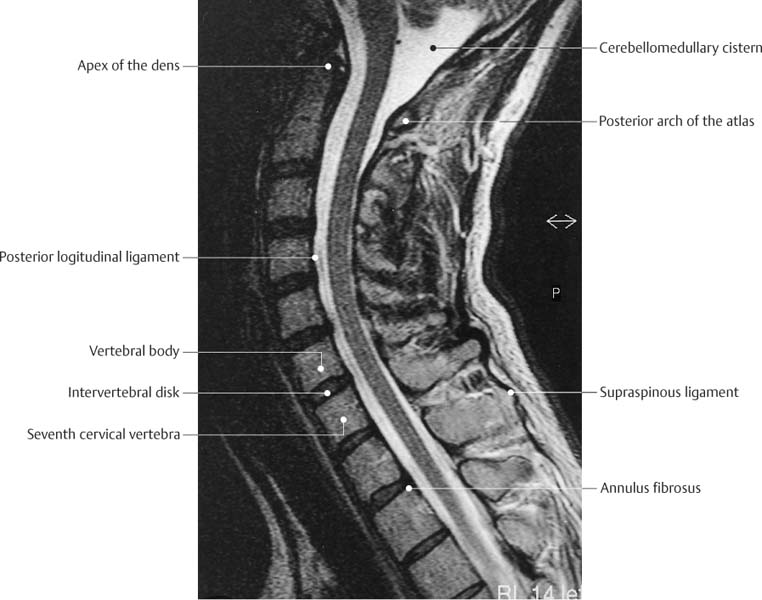
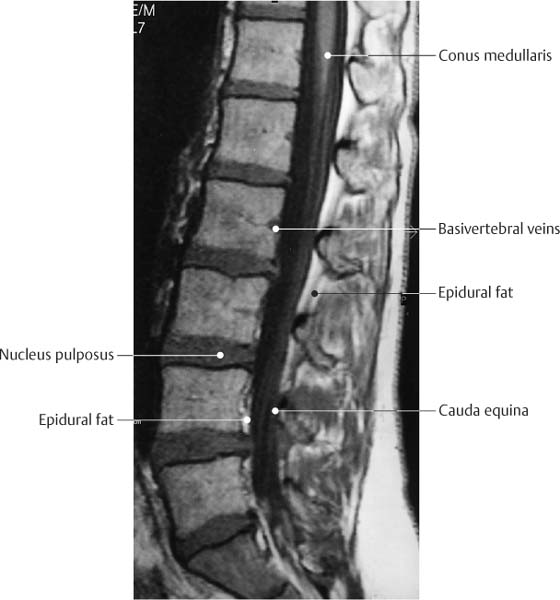
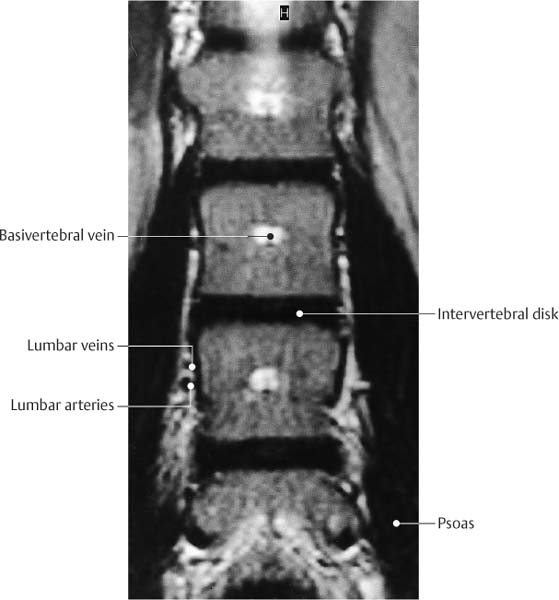
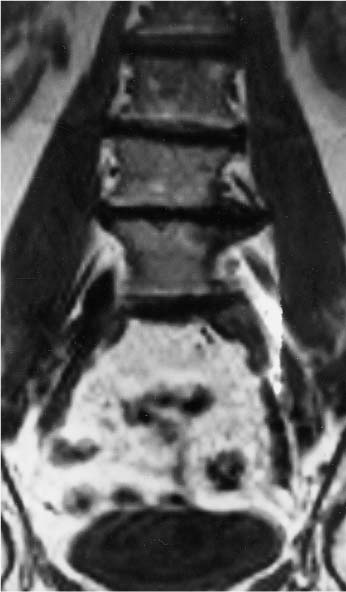
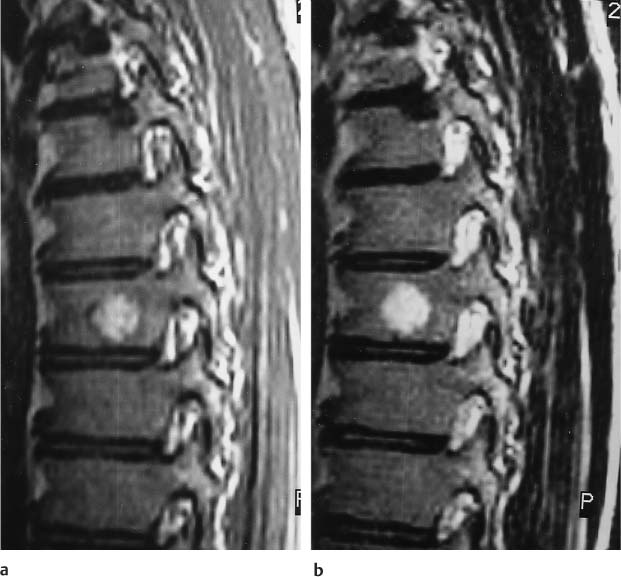
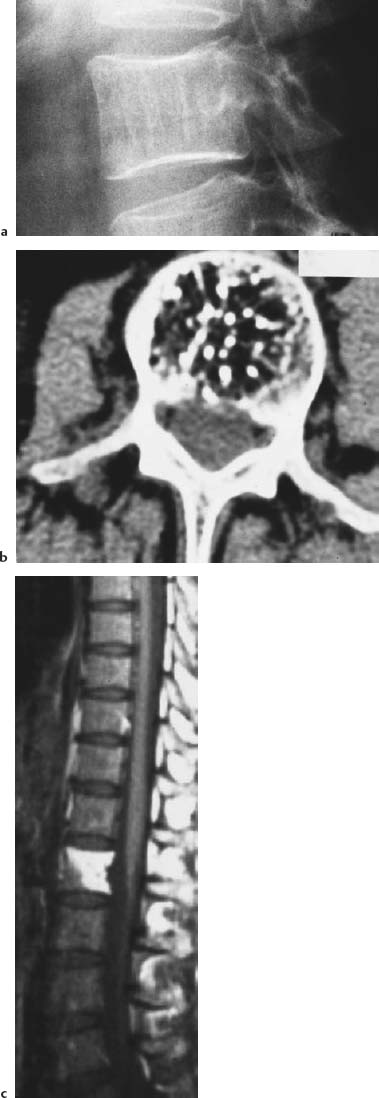
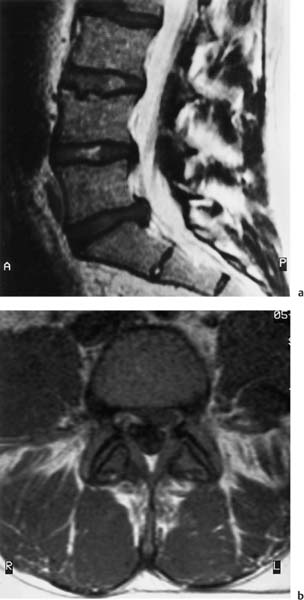
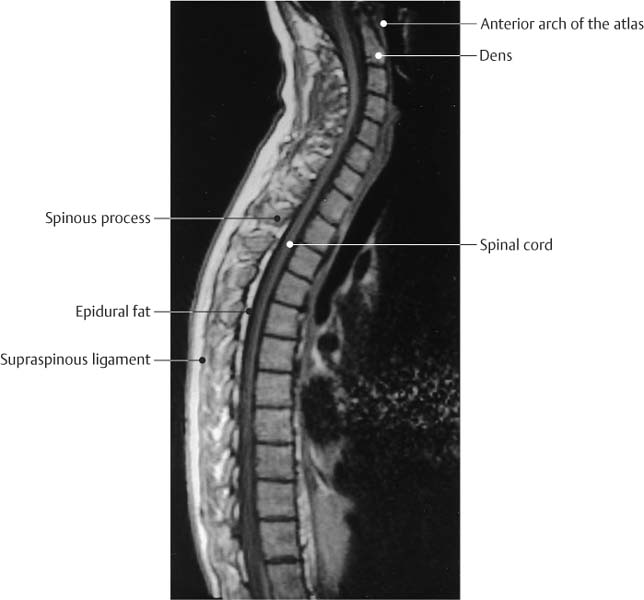
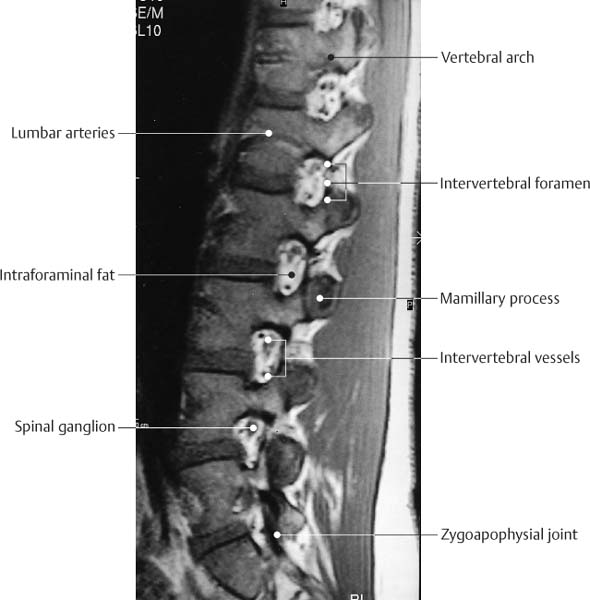
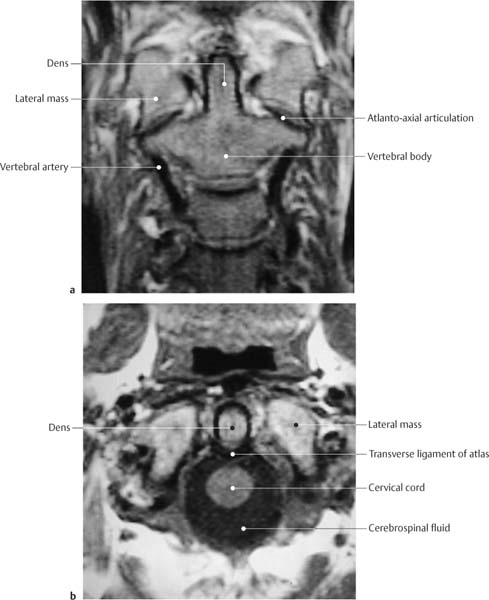
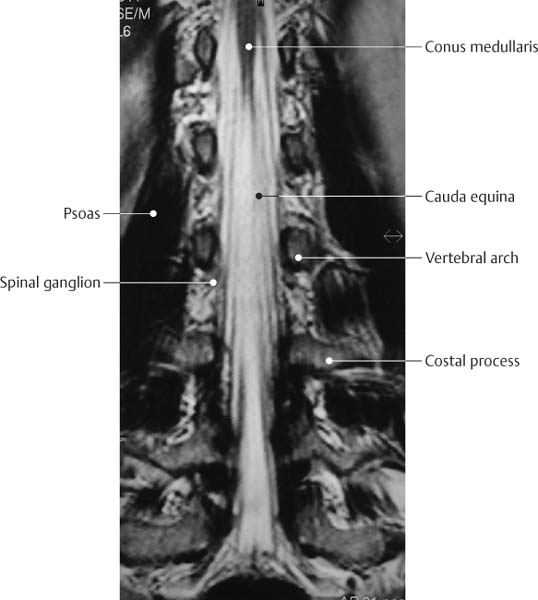
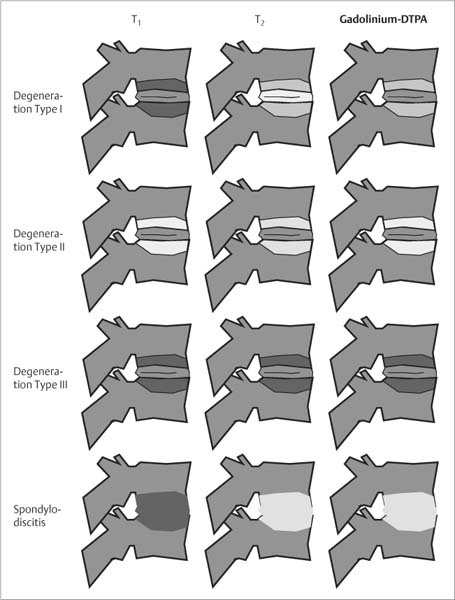
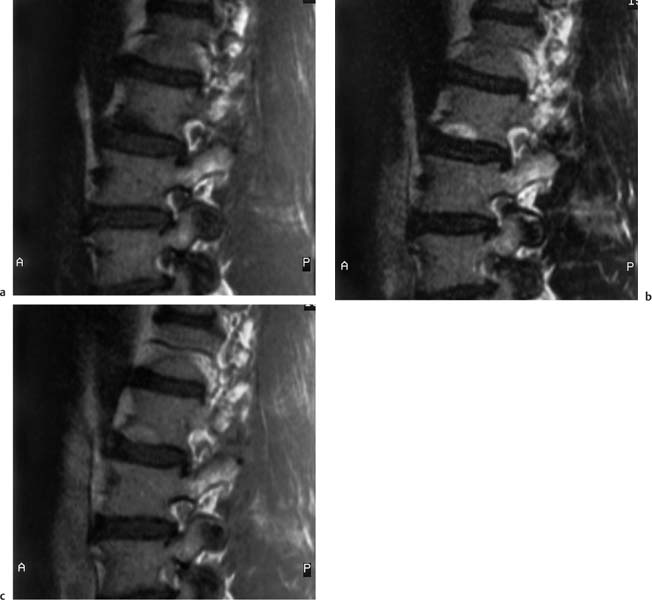
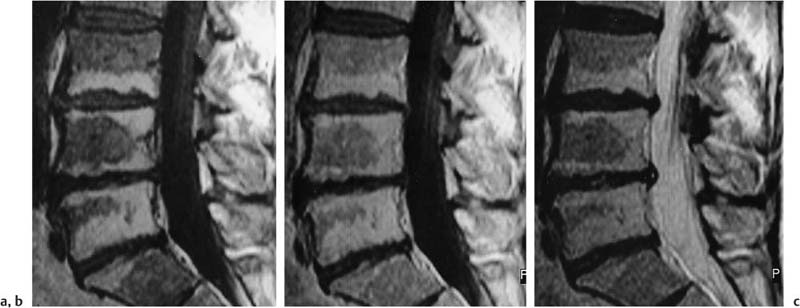
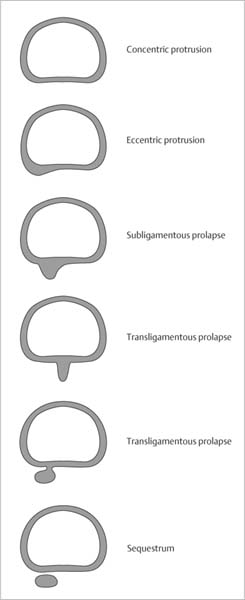
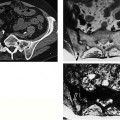
2 Spine The spine is formed by seven cervical vertebrae, twelve thoracic vertebrae, five lumbar vertebrae and five additional vertebrae that are fused with the costal remnants to constitute the sacrum. Rudimentary vertebrae that make up the coccyx terminate the spine (Figs. 2.1 –2.3). All vertebrae have a common basic form, regionally modified by the particular load carried by that region. The vertebral body, which is attached to the intervertebral disk with its superior and inferior end plates, occupies the largest part of each vertebra. A pair of pedicles projects posteriorly from the vertebral body to form the base for the vertebral arch. Each pedicle is constricted in the middle, creating an articular notch as part of the intervertebral foramen. An articular process arises superiorly and inferiorly from each pedicle. These superior and inferior articular processes form an articulation between the vertebrae. The transverse processes project laterally where the laminae begin and the spinous process arises posteriorly where the laminae join to complete the vertebral arch. The vertebral arch encloses the spinal canal, which has openings for the spinal nerve on either side between two vertebrae, the intervertebral foramina (Fig. 2.4). The vertebral bodies increase in height in the craniocaudal direction. The movements of the different spinal regions are influenced by the form and orientation of the articular surfaces. The articular surfaces of the cervical spine are flat and inclined 45° from the horizontal plane following an anterosuperior to posteroinferior orientation. The articular surfaces of thoracic spine are frontally oriented. In the lumbar region, the sagittaly oriented articular surfaces markedly limit any rotation and almost exclusively permit only flexion and extension. Fig. 2.1 T2-weighted SE sequence, sagittal section of the cervical spine. Fig. 2.2 T1-weighted SE sequence, sagittal section of the cervical and thoracic spine with a ‘synergy coil.’ Fig. 2.3 T1-weighted SE sequence, sagittal section of the lumbar spine. Fig. 2.4 T2-weighted SE sequence, parasagittal section of the lumbar spine. The first two cervical vertebrae, which support the load of the head and allow movements like a ball and socket joint, assume a special role in the discussion of the vertebrae (Fig. 2.5). The first vertebral body (atlas) deviates from the basic vertebral form in that it lacks a body. The space normally taken by the vertebral body is occupied by the dens. The dens is posteriorly contained by the transverse ligament, which protects the medulla from injuries of the moving dens. Axis and occipital bone are joined by an articulating system that consists of six small individual articulations. The length and configuration of the spine, as well as its function, are determined significantly by the connecting ligaments and the intervertebral disks, as well as by the osseous structures. All disks added together constitute about one fourth of the entire length of the spine. In the thoracolumbar spine the thickness of the disks decreases craniocaudaly. The slight wedging of the disks markedly contributes to the curvature of the spine. Each disk consists of a gelatinous nucleus, the nucleus pulposus, which is surrounded by laminated fibrous tissue, the annulus fibrosus. The firm attachment of the annulus fibrosus to the hyaline cartilage covering the vertebral end plates constitutes a synchondrosis. The nucleus pulposus is under constant high pressure and its role consists of keeping the vertebral bodies apart. It is confined by the annulus fibrosus and the anterior and posterior longitudinal ligaments. The ligamenta flava, which connect the laminae of adjacent vertebrae, primarily consist of elastic fibers and owe their name to the yellow color of these fibers. The spinous processes are connected with each other by the supraspinal ligament and the interspinal ligaments (Fig. 2.1). In general, the spine is examined in segments, guided by the presenting symptom. It is less common to screen the entire spine, but this is indicated whenever metastatic infiltrations are suspected. In this situation, the largest field of view should be selected for the sagittal view, to encompass the medullary spaces of the cervical, thoracic and lumbar spine. These examinations are performed with the body coil or with special rectangular or phase-array coils (Fig. 2.2). Fig. 2.5a, b a T1-weighted SE sequence. Coronal section through the dens. b T1-weighted sequence, transverse section through atlas and axis at the level of the dens. Alternatively, individual segments of the spine can be examined with flexible surface or rectangular coils. The field of view is variable and is about 180 mm for the cervical and lumbar spine and 360 mm for the thoracic spine. Sagittal sections are mandatory for MR imaging of the spine, complemented by axial sections through the area of interest. Coronal sections are only occasionally needed (Figs. 2.6 and 2.7). A section thickness of 3 – 4 mm has proved to be useful since it is a satisfactory compromise between spatial resolution and signal-noise ratio for modern MRI units and properly designed coils. Matrix and the number of excitations should be in a reasonable relationship to the total examination time. Individual sequences exceeding 5 minutes negate the apparent advantages of higher matrix resolution or signal intensity by adding motion artifacts. Selection of the sequences has to be guided by the question asked. T1-weighted SE sequences provide a good anatomic display and should be part of every examination. However, the dual echo technique of SE sequences (proton density and T2-weighted images) has lost its importance through the introduction of TSE sequences (see Chapter 1). In the spine, the proton density images rarely add relevant information and generally can be omitted. Fig. 2.6 T2-weighted sequence. Coronal section of the lumbar spine through the plane of the spinal canal. Fig. 2.7 T2-weighted sequence. Coronal section of the lumbar spine through the plane of the vertebral bodies. T2-weighted TSE sequences are marked by a crisp contrast, a better signal-to-noise ratio and a shorter examination time. They have essentially replaced the conventional SE sequence. However, the achieved contrast can make it difficult to distinguish fluid, such as CSF, from fat and areas of necrosis or edema which also appear high in signal intensity (Figs. 2.6 and 2.7). T2-weighted GE sequences are helpful when evaluating post-traumatic changes since they detect hemosiderin deposits due to their sensitivity to susceptibility effects. The very same susceptibility effects seen on these sequences can overestimate degenerative changes and spinal stenosis. Fast GRE sequences are used for functional imaging in real time. Fat suppression using STIR or frequency-selective fat saturation can be added (see Chapter 1). Both sequences allow the visualization of minor injuries with bone marrow edema. Opposed-phase GRE sequences with or without enhancement are recommended for detection of malignant bone marrow infiltrates. They have the best signal-to-noise ratio for differentiating malignant bone marrow infiltrates from healthy red or yellow bone marrow. Intravenous contrast enhancement is generally used for the evaluation of tumor infiltrates or inflammatory changes and in postsurgical changes where it might improve the differentiation of recurrent or residual disk from a scar, at least in advanced stages. Spondylosis deformans is characterized by the formation of anterior or lateral osteophytes, or both, along the margin of the vertebral bodies. The osteophytes may contain bone marrow and thus share its signal pattern. Strictly osseous osteophytes are characterized by the extreme short T2 times of cortical bone and have a low signal intensity on all sequences (Fig. 2.8). They are best appreciated on GRE sequences. Susceptibility artifacts, however, might overestimate the extent of the osseous changes. The diagnostic evaluation of degenerative changes of the spine demands an understanding of the abnormalities induced in the bone marrow of the affected vertebral body. These degenerative marrow changes adjacent to the end plates are invisible on conventional radiographs or CT, but have been described on MRI in up to 50% of patients with degenerative disk disease. Modic (26) distinguishes three types of change which are generally band-like (Fig. 2.9): • Type 1: Replacement of the adjacent bone marrow by vascularized fibrous tissue (with gadolinium enhancement) with increased signal intensity on the T2- weighted image and decreased signal intensity on the T1-weighted image (Fig. 2.10). • Type 2: Replacement of the adjacent bone marrow by abundant fat with increased signal intensity on the T1-weighted image and moderately hyperintense to isointense signal intensity on the T2-weighted image (depending on the selected sequence) (Fig. 2.11). • Type 3: Increasing sclerosis and cicatrization of the bone marrow with a decrease signal intensity in all sequences. The types are not always clearly distinguishable from each other and frequently coexist. A systematic review of consecutive patients referred for lumbar spine MR imaging revealed type 2 change in 16% of the patients. Histologic specimens demonstrated yellow marrow adjacent to the end plates. This conversion of red to yellow bone marrow is attributed to chronic repetitive micro traumas associated with degenerative disk disease. These changes remain stable over several years and do not have the tendency to involve the entire vertebral body. Fractures or vertebral compressions secondary to these bone marrow changes alone were not observed. The changes of the less frequent type 1 (4%) can pose differential diagnostic problems since they might be interpreted as osseous metastases in patients with known malignancy. Cases with such signal changes along the end plates should be followed expectantly since these changes generally convert to the aforementioned increased signal intensity on the T1-weighted image. The transient decrease in signal intensity of the bone marrow on the T1-weighted image observed with degenerative disk disease corresponds histologically to vascular granulation tissue with multiple small blood vessels. When the degenerative process becomes more chronic and stable, a change with fatty replacement can be expected. The time interval of the underlying investigations was up to 18 months. Because of the few patients studied longitudinally, the evolving bone marrow degeneration that accompanies disk degeneration cannot yet be definitively answered. Fig. 2.8 Degenerative change with large spondylophyte, L3/L4 vertebral body on the left. T1-weighted SE sequence (500/15) coronal. The osseous appositions are of low signal intensity. Fig. 2.9 Differential diagnosis of degenerative and inflammatory changes of vertebral bodies and interposed disk, following the classification proposed by Modic (26). Differential diagnoses. The degenerative vertebral changes of type 1 can resemble a spondylodiskitis (Fig. 2.10), though the inflammatory changes in the latter produce an increased signal intensity in the disk and enhance more than a tear of the annulus fibrosus. Furthermore, the interface between disk and adjacent vertebral body is indistinct with infection. Pathologic changes in the surrounding tissues are rare in case of degeneration. Vertebral hemangiomas, which represent benign vascular tumors and are found in about 11% of all autopsies, are to be distinguished from degenerative disease type 2 (Fig. 2.12). Their predisposition for the spine and the differential diagnostic implications justify their special mention. Histopathologically, they represent thin-walled blood-filled vessels and sinusoids, surrounded by endothelium and interspersed with longitudinally osseous trabeculae. They have a characteristic and well-known appearance on plain radiographs and CT (Fig. 2.13), and also produce a characteristic finding on MR. They are well demarcated and can occupy the entire vertebral body in the sagittal section or form a round, punched-out lesion. Characteristically, hemangiomas are of very high signal on both T1-weighted and T2-weighted images. Comparison of chemical shift images with histologic sections has demonstrated that the typical signal pattern is caused by extraosseous fat components. The differential diagnosis should not be a problem as long as these characteristic findings are kept in mind. A malignancy can be excluded on the basis of the high signal observed in hemangiomas on the T1- weighted images. Degenerative osseous changes are band-like, less well demarcated and of lower signal intensity. Fig. 2.10 a–c Degenerative disk disease type 1 of the lower thoracic spine. a Unenhanced and b enhanced sagittal T1- weighted SE sequences (473/15). c Sagittal T2-weighted TSE sequence (2931/110). Crescentic bone marrow edema along the lower end plate with enhancement in moderate degenerative disk disease. Fig. 2.11 a–c Degenerative disk disease type 2 at L3 to S1. a Unenhanced, and b enhanced sagittal T1-weighted SE sequences (473/15) as well as c sagittal T2-weighted TSE sequence (2931/110). Band-like increase in signal intensity along the end plates without discernible enhancement. Fig. 2.12 a,b Hemangioma, T8 vertebral body. a sagittal T1-weighted SE sequence (500/15) and b T2-weighted TSE sequence (3000/90). Centrally in the vertebral body, sharply demarcated lesion of the bone marrow with increased signal intensity on both sequences. The healthy disk undergoes a physiologic aging process. Similar to hyaline cartilage, the nucleus pulposus contains collagen fibers of type II and large amounts of proteoglycans with the propensity to bind water. This accounts for the high signal intensity on the T2-weighted images. The nucleus pulposus is surrounded by the concentric lamellae of the fibrocartilaginous annulus fibrosus, which are interconnected by a network of collagenous fibers. The content of type I collagen increases centrifugally resulting in a low signal intensity of the peripheral components on T1 and T2 weighting. Sharpey’s fibers attach the periphery of the disk to the ring epiphysis of the vertebral body. The annulus fibrosus, which is frequently thinner dorsally, is firmly attached to the anterior and posterior longitudinal ligaments. Up to the second year of life, the disk receives its nutrients through vessels. Thereafter, it becomes completely avascular and is exclusively nourished through diffusion. Only pathologic processes can induce the ingrowth of secondary vessels. Furthermore, repetitive micro traumas and biochemical processes contribute to the aging process. By the time of adolescence, a band that is low signal on all sequences appears in the nucleus pulposus in each T weighting, presumably corresponding to invaginated inner lamellae of the annulus fibrosus. Aging induces various MRI findings. In particular, the T2-weighted images show the dehydration of the nucleus pulposus as decrease in signal intensity. In advanced age, the entire disk is exclusively composed of fibrous cartilage and elicits a very low signal intensity. Furthermore, annular tears appear. They are of high signal on T2 images. When vascularized tissue extends into these tears, which can be concentric, radial and transverse in orientation, they are of high signal intensity on T1-weighted images after administration of Gd-DTPA. Annular tears predispose to protrusion and prolapse of disk material. Similar to CT and conventional radiographs, MRI can exhibit a vacuum phenomenon in the affected disk. This phenomenon reflects a nitrogen-rich accumulation of gas, caused by a negative pressure in the disk and poor resorption because of absent vascularization. Fig. 2.13 a–c Hemangiomatous vertebral body. a Lateral radiograph. Increased longitudinal trabecular markings. b CT. Increased fat content and transversely dissected thickened longitudinal trabeculation. c MRI. T1- weighted SE sequence. The increased fat content causes an increased signal intensity of the hemangiomatous body. Gaseous inclusions appear as a signal void on all sequences and must be differentiated from calcifications and chemical shift artifacts. At this stage of degeneration, the height of the disk is invariably decreased. A very important aspect of degenerative disk disease is the displacement of portions of the nucleus pulposus through the annulus fibrosus. The terminology relating to disk herniation is difficult. The following nomenclature has been proposed by the North American Spine Association (Fig. 2.14): Bulge. This refers to a concentric extension of the disk beyond the vertebral margin. Protrusion. This represents a broad-based, frequently somewhat eccentric extension of the degenerated disk beyond the vertebral margin in the presence of an intact annulus fibrosus and longitudinal ligament. The protrusion can be anterior, posterior, or lateral. Extrusion. If part of the nucleus pulposus extends through the annulus fibrosus, it produces a focal convex extension of the disk beyond the vertebral margin. The extrusion can be central, paracentral, lateral, and far lateral. Depending on the location there may be corresponding predominantly radicular or myelopathic symptoms. If the outer layer of the annulus fibrosus and the longitudinal ligament remain intact, a band of low signal intensity on T1-weighted and T2-weighted images is seen between the extruded disk and the epidural fat. The delineation of the band varies depending on the residual water content of the disk, and on the surrounding structures, which may show the high signal intensity of the epidural fat on T1-weighted images and a myelographic effect on the T2-weighted images. If the extrusion extends beyond the outer fibers of the annulus fibrosus and through the longitudinal ligament (Fig. 2.15), it can exhibit a circumferential narrowing where it passes through the ligamentous structures. These transligamentous extrusions are often small. Dural penetration is rare. The majority of disk protrusions and extrusions exhibit a low signal intensity on all sequences. Fig. 2.14 Diagram of the classification of disk degeneration with protrusion or prolapse. Sequestration. If continuity with the disk is lost, the herniated disk has become sequestered (Fig. 2.16). The sequestrum can be anterior or posterior to the longitudinal ligament and may migrate, usually in the caudal direction. On T2-weighted images, the sequestrum can often be of higher signal intensity than the parent disk, ascribed to neovascularity with increased fluid content. This might also explain peripheral enhancement of sequestrations. Fig. 2.15 a, b
Anatomic Basis
Examination Protocol for MRI
Degenerative Conditions of the Spine
 Spondylosis Deformans
 Degenerative Bone Marrow Changes
 Disk Degeneration
 Disk Herniation
![]()
Stay updated, free articles. Join our Telegram channel


Full access? Get Clinical Tree


