Abstract
Background
Abdominal aortic aneurysms (AAAs) are an important cause of death. Small AAAs are surveyed with ultrasound (US) until a defined diameter threshold, often triggering a computer tomography scan and surgical repair. Nevertheless, 5%–10% of AAA ruptures are below threshold, and some large AAAs never rupture. AAA wall biomechanics may reveal vessel wall degradation with potential for patient-centred risk assessment. This clinical study investigated AAA vessel wall biomechanics and deformation patterns, including reproducibility.
Methods
In 50 patients with AAA, 183 video clips were recorded by two sonographers. Prototype software extracted AAA vessel wall principal strain characteristics and patterns. Functional principal component analysis (FPCA) derived strain pattern statistics.
Results
Strain patterns demonstrated reduced AAA wall strains close to the spine. The strain pattern “topography” (i.e., curve phases or “peaks” and “valleys”) had a 3.9 times lower variance than simple numeric assessment of strain amplitudes, which allowed for clustering in two groups with FPCA. A high mean reproducibility of these clusters of 87.6% was found. Median pulse pressure-normalised mean principal strain (PPPS) was 0.038%/mm Hg (interquartile range: 0.029–0.051%/mm Hg) with no correlation to AAA size (Spearman’s ρ = 0.02, false discovery rate- p = 0.15). Inter-operator reproducibility of PPPS was poor (limits of agreement: ±0.031%/mm Hg).
Discussion
Strain patterns challenge previous numeric stiffness measures based on anterior-posterior-diameter and are reproducible for clustering. This study’s PPPS aligned with prior findings, although clinical reproducibility was poor. In contrast, US-based strain patterns hold promising potential to enhance AAA risk assessment beyond traditional diameter-based metrics.
Introduction
Abdominal aortic aneurysms (AAA) are characterised by progressive vessel wall weakening, with a prevalence of about 2%–3% among 65-y-old men [ , ]. This weakening can lead to rupture with a mortality of 75%–80% [ ]. In contrast, the mortality associated with prophylactic AAA repair, while comparatively low, remains non-negligible, ranging from 1% to 3% [ ]. Overall, AAA is estimated as the 10th–15th most common cause of death among late middle-aged men [ , ]. Repair is typically considered for large AAAs, assessed by diameter, when the risk of rupture exceeds the procedure-related risk. Conversely, small AAAs are routinely monitored with ultrasound (US) surveillance [ ]. However, using diameter as the sole parameter for risk assessment may be flawed since 5%–10% of all AAAs ruptures occur below the threshold, while other AAAs grow large without rupturing [ ]. Declining rupture rates, attributed to AAA screening programs and smoking cessation [ , ], combined with a potential need for screening more senior citizens and patients with AAA ectasia [ ], may place a capacity constraint on AAA surveillance programs. Thus, a more personalised approach is needed to detect subthreshold AAAs at risk and prevent overtreatment of low-risk AAAs above the threshold.
In search of AAA risk factors beyond diameter, biomechanical properties, especially global stiffness and elastic modulus of the AAA vessel wall, have been studied with US. Both are typically calculated based on the anterior-posterior (AP) diameter dilatation within a cardiac cycle, normalised for blood pressure [ ]. These studies correlated the global stiffness and elastic modulus with AAA diameter, and the results ranged from negligible [ , ] to moderate correlation [ , ]. Similarly, studies have investigated the correlation between biomechanical properties and future growth [ , ], rupture, or repair [ ]. Despite initially promising results, the evidence remains contradictory and does not consistently align with findings from in vitro studies [ ]. Other factors considered to influence AAA risk are intraluminal thrombus and AAA morphology [ ].
Further work on biomechanics has focused on localised AAA wall strains, calculated by mapping using time-resolved two-dimensional US (2D-US) [ , ] and three-dimensional US (3D-US) [ ]. Local strains, defined by deformation of small segments throughout the AAA vessel wall, enable the creation of a “strain map” that represents wall deformation across the cardiac cycle (see Fig. 1 d and Fig. A1). One study found that such strain measures are independent of AAA size and have a non-linear correlation to AAA growth, suggesting they could enhance diameter-based AAA risk prediction [ ].

Thus, progress has been made from simple global stiffness and elastic modulus solely based on US AP-diameter variations to full strain maps. However, only one study [ ] has used these new biomechanical markers in AAA risk prediction and did not investigate clinical reproducibility. Also, all current studies of localised wall strains reduce the full strain map to “single parameter characterisations,” such as numeric mean strain, peak strain and heterogeneity index, which all can be calculated from the strain values of the entire grid. These numeric characterisations, while ingenious, can hide nuances that can only be obtained by considering the complete “topography” of a full AAA strain map.
This paper aimed to measure and categorise localised AAA strain maps in a clinical setting using outpatient-based 2D-US acquisitions and a prototype software tool based on a fast strain-mapping approach and to investigate the method’s reproducibility.
Materials and methods
Study design
A prospective single-centre, observational proof-of-concept study.
Patients
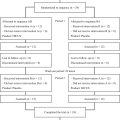
Fifty patients from the Copenhagen Aortic CoHort (COACH) were included. COACH is a prospective cohort of patients with AAAs with diameters above 30 mm and monitored with research-orientated US surveillance [ ]. Enrolment in COACH relies on research staff and equipment availability. Exclusion criteria were aorto-iliac aneurysms; suprarenal aortic aneurysms; prior aortic or iliac artery repair; non-compliance with surveillance; or inability to provide informed consent. US acquisitions were systematically collected and stored.
Methods
US image acquisition
Two US operators independently and non-consecutively recorded two 10-s cross-sectional 2D-US time-resolved B-mode sequences (video clips called “cineloops”) of the AAA at the maximal AP-diameter during breath holds using an identical US system (Epiq Elite US system and C5-1 transducer, Philips Medical Systems, Bothell, WA, USA). Thus, for each patient, four cineloops were planned (two recordings × two operators). Acquisitions were subsequently transferred to a core lab, where two readers (USL and MIB) mutually and independently conducted the image post-processing in a randomised order via randomised.org, using a prototype software (Philips Health Technology innovation). The image quality of every cineloop was evaluated and graded by a clinical expert reader (USL). Cineloops of poor image quality ( n = 9, 4.5%) were not used for further analysis. A few of the planned acquisitions were either not conducted or failed to upload to our database ( n = 7, 3.5%).
Strain
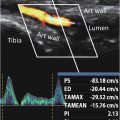
Strains are the percentage deformation of the AAA vessel wall when force is applied to it, for example, by the blood pressure during the heart cycle. When overlaying a grid on the AAA vessel wall, maximum principal strain is the largest deformation (or fibre stretch) value in any direction (called the first “principal direction”). Higher values indicate softer tissues and lower values indicate stiffer tissues. Principal strain can then be projected onto two main directions of movement along the AAA vessel wall: circumferential (stretch or compression) or radial (thickening or thinning); see Figure A1 .
Image post-processing
The image post-processing is described in detail in previous work [ ], with the notable difference that the present study includes principal strain in addition to circumferential and radial strain. The process can be summarised as a 3-step procedure: (i) manual segmentation and automatic tracking, (ii) automatic strain map generation and (iii) strain pattern extraction.
- 1)
Manual segmentation and automatic tracking
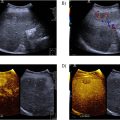
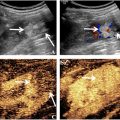
Tracking points were manually positioned at the initial frame of the cineloop. This was done circumferentially at the interface between the aneurysm wall and lumen ( Fig. 1 b). Subsequently, an automated speckle-tracking process was employed based on image gradients within an automatic region of interest ( Fig. 1 c).
- 2)
Automatic strain map generation
A deformation grid was computed based on the tracking procedure, and from this, strain over the cardiac cycle—from end-diastole to peak systole—was directly calculated. The resulting strain data were superimposed on the cineloop. This generated a comprehensive strain map ( Fig. 1 d) illustrating different zones of AAA strain, expressed as percentage changes over time. Results from all cardiac cycles were then averaged.
- 3)
Strain pattern extraction and normalization
The obtained strain maps contain local information along an irregular vessel wall. To enable inter-case comparisons of strain maps, strain values were radially averaged for each degree of the AAA circumference with 0° defined as the bottom of the strain map (toward the spine), see Figure 1 e. Thus, the total information of an AAA strain map is summarised as a polar plot, henceforth designated the “strain pattern,” see Figure 1 f (where the black circle represents the reference null strain). Strain patterns were then smoothed to reduce sensitivity to noise.
The whole post-processing phase spans 3–5 min, in off-cart software. With future improvement the software could be operationally on-cart version for full clinical integration.
Data analysis and statistics
Functional data analysis of strain patterns
To analyse strain patterns without reducing them to single parameter characterisations, functional data analysis (FDA) with alignment was performed [ ]. Alignment is the process of elastically synchronizing (or “warping”) functional data sets to a common reference, enabling comparative analysis and inference across patients. The mean strain pattern was calculated on smoothed and elastically aligned strain patterns to reduce noise and account for minor scan variations (e.g., in insonation angles). Further, using function principal component analysis (FPCA), the strain patterns were decomposed into their principal modes of variations (PMV) with associated scores for each cineloop. The scores for each PMV was analysed for correlation with AAA size using Spearman’s rank correlation. A positive or negative coefficient of 0–0.3 was considered weak correlation, 0.3–0.5 low, 0.5–0.7 moderate, 0.7–0.9 high and 0.9–1.0 very high [ ]. p values were corrected using the Benjamini–Hochberg false discovery rate (FDR) procedure. Only FDR- p values <0.05 were considered statistically significant.
Clustering
Subsequently, spectral consensus clustering [ , ] was then used to split the cineloops into an optimal number of clusters based on the PMV scores.
Single parameter strain characterisations
As described in other work on strain mapping [ ], single numeric parameter strain characterisations can be calculated from the end-diastolic to peak-systolic strain based on the principal strains across the vessel wall: mean strain; pulse pressure-normalised mean strain (PPPS); peak strain; heterogeneity index, that is, the ratio of the SD of wall strain to the mean wall strain; and local strain ratio, that is, the ratio between the peak strain and mean strain.
Single parameter strain characteristics were summarised across all patients with frequency-weighted medians and inter-quartile ranges (IQR), due to non-normality. All single parameter strain characteristics were analysed for correlation with AAA size using Spearman’s rank correlation similarly to the PMVs.
Reproducibility
For strain pattern clusters, the “cluster reproducibility” was calculated, which was defined as the percentage of an individual patient’s four cineloops that belong to the majority (or tie for majority) cluster (e.g., three out of four scans within the same cluster equals 75%). By aligning all of a patient’s scans to each other (within-patient alignment), amplitude and phase variations for each patient could be extracted. These were averaged across patients for an overall amplitude-phase variation ratio.
For single parameter characterisations, Bland–Altman limits of agreement (LoA) on inter-reader comparisons were calculated, comparing readers USL and MIB on the same cineloops. The LoA were quantile-based, due to non-normality, and were converted into a range of variance (RoV, i.e., half the quantile distance) and displayed as a percentage of the median. To calculate LoA for inter-operator considerations, a linear mixed-effects model was utilised, accounting for multiple acquisitions by the same operator.
All statistical analyses described above were performed in R version 4.3.3 using RStudio version 2023.12.1 build 402 (Posit software, PBC, Boston MA, USA). The packages: Hmisc, mgcv, fdasrvf, fdapace and M3C were used for weighted statistics, strain pattern smoothing, alignment, FPCA and clustering, respectively.
Ethics
This study was approved by the Regional Ethics Committee of the Capital Region of Denmark (protocol no. H-20001116).
Results
The present study utilised a prototype US tool to estimate AAA vessel wall strains from 183 clinical US cineloops acquired on 50 AAA patients scanned by two independent operators. The frequency-weighted median AAA size with US was 45.1 mm (weighted IQR: 41.7–49.4 mm), and all AAA’s were asymptomatic. Further demographics can be seen in Table 1 .
| Overall ( N = 47) | |
|---|---|
| Sex | |
| Female | 9 (19%) |
| Male | 38 (81%) |
| Age (y) | |
| Mean (SD) | 73 (4.7) |
| Height (m) a | |
| Mean (SD) | 1.8 (0.075) |
| Weight (kg) a | |
| Mean (SD) | 85 [ ] |
| Body mass index (kg/m 2 ) a | |
| Mean (SD) | 27 (4.7) |
| Hypertension | |
| No | 14 (30%) |
| Yes | 33 (70%) |
| Ischaemic heart disease | |
| No | 40 (85%) |
| Yes | 7 (15%) |
| NYHA | |
| None | 5 (11%) |
| I | 39 (83%) |
| II | 2 (4%) |
| III | 1 (2%) |
| IV | 0 (0%) |
| Blood thinner | |
| None | 7 (15%) |
| Platelet inhibitor | 36 (77%) |
| Anticoagulant | 3 (6%) |
| Dual-pathway inhibition | 1 (2%) |
| Cholesterol-lowering | |
| No | 8 (17%) |
| Yes | 39 (83%) |
| Smoking a | |
| Never | 2 (4%) |
| Past | 24 (51%) |
| Current | 20 (43%) |
| Diabetes a | |
| No | 37 (79%) |
| Yes | 9 (19%) |
| Pulmonary disease | |
| None | 39 (83%) |
| Obstructive | 7 (15%) |
| Restrictive | 1 (2%) |
Related posts:
 Relationship Between Early and Established Rheumatoid Arthritis Vascular Change of the Dorsalis Pedis Artery Observed with Ultrasound Imaging
 Effects of High-intensity Continuous Ultrasound on Infrapatellar Fat Pad Stiffness and Gliding in Healthy Participants: A Randomized, Single-blind, Placebo-controlled Crossover Trial
 Perfluorobutane-Enhanced CEUS in Intrahepatic Cholangiocarcinoma: Correlating Imaging Features With Liver Backgrounds and Tumor Sizes
 Evaluation of Renal Masses Using Contrast-Enhanced Ultrasound with Sonovue and Sonazoid
 Aneuploidy Screening: The Ongoing Role of First-Trimester Ultrasound
 Nonvascular Findings Encountered During Venous Sonography
Stay updated, free articles. Join our Telegram channel

Full access? Get Clinical Tree


