Fig. 8.1
Prototypal DTI study pipeline. Whole-brain tractogram and connectivity matrix. [Reprinted from Caeyenberghs K, Leemans A, Leunissen I, Gooijers J, Michiels K, Sunaert S, et al. Altered structural networks and executive deficits in traumatic brain injury patients. Brain Struct Funct. 2014 Jan;219(1):193–209. With permission from Springer Verlag]. Voxel-based analysis figure. [Adapted from Emsell L, Langan C, Van Hecke W,Barker GJ, Leemans A, Sunaert S, et al. White matter differences in euthymic bipolar I disorder: a combined magnetic resonance imaging and diffusion tensor imaging voxel-based study. Bipolar Disord. 2013 Jun;15(4):365–376. With permission from John Wiley & Sons.]Axon micrograph. [Reprinted from Beaulieu C. The basis of anisotropic water diffusion in the nervous system—a technical review. NMR Biomed. 2002 Nov–Dec;15 (7–8):435–455. With permission from John Wiley & Sons, Inc.] Corrected DTI maps. [Courtesy of A. Leemans]
Why Do We Need to Analyze DTI Data?
Diffusion-weighted imaging (DWI ) is widely used in clinical practice as it provides unique, rapidly accessible information that can be used in the assessment of ischaemic stroke, to differentiate vasogenic versus cytotoxic oedema and to characterize intracranial lesions such as pyogenic abscess, infections, tumors, and trauma [2]. However, whilst the processing of DWI data is relatively easy, the analysis of DTI data is significantly more complex. For example, the need for more diffusion-weighted images makes the acquisition longer and more challenging. In addition, motion correction becomes more important, and the tensor estimation is more complex compared to ADC calculations. There are also more techniques available for analyzing DTI data compared to DWI. In clinical practice, DWI information, typically the DWI and ADC maps, is interpreted visually by a radiologist. It has been demonstrated that DTI can be useful in evaluating changes in the normal appearing white matter. However, qualitative assessment of DTI information, such as FA maps, may be more difficult there.
To illustrate the challenge of qualitatively assessing scalar DTI maps, consider the axial color-encoded FA maps in Fig. 8.2. This random assortment of images comprises seven pairs of axial slices generated from patients with pathology that has been associated with changes in white matter microstructure, and two healthy subjects. There are two patients with tinnitus, two with cerebral palsy, two with multiple sclerosis, two with schizophrenia, two with Alzheimer’s disease, two with spinocerebellar ataxia and two with amyotrophic lateral sclerosis. Is it possible to match the FA maps with the correct pathology and identify the healthy controls?
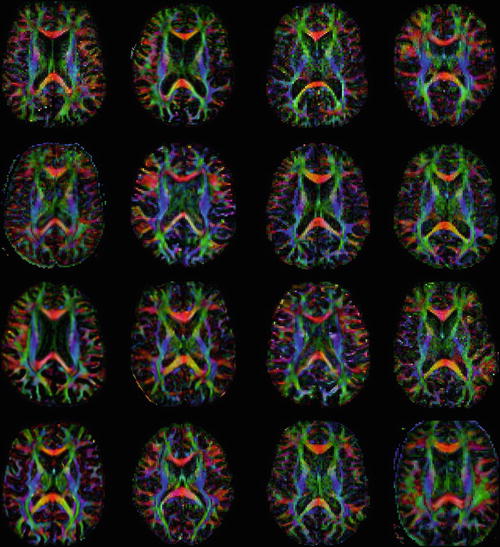
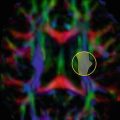
Fig. 8.2
A matching puzzle with DTI. Match the axial colour-encoded FA maps with the correct pathology. In addition to two healthy subjects, there are two images of patients with tinnitus, cerebral palsy, multiple sclerosis, schizophrenia, Alzheimer’s disease, spinocerebellar ataxia, and amyotrophic lateral sclerosis
For all subjects, a similar axial slice was selected. Data from the subjects with the same pathology were acquired using the same protocol in the same study, whereas data from subjects with different pathologies were acquired in different studies (and therefore mostly with different acquisition protocols). Hence, it may be possible to match some subjects based on image quality or based on prior knowledge about the presence of neurodegeneration and ventriculomegaly in some of these disorders. However, when these factors are excluded from the visual assessment of the data, it becomes very difficult to match the pathology to the DTI data. This demonstrates firstly, that changes in FA that occur due to pathology are not always readily visualised on colour FA maps, and secondly, that such FA changes are not specific to one particular disorder. Although visual assessment of colour FA maps can be useful, in general, there is a need for reliable quantitative analysis methods that allow meaningful conclusions to be drawn from the DTI data.
DTI Analysis Techniques
Many different DTI analysis techniques and approaches have been applied to study a range of pathologies and include region of interest analysis, tractography, histogram analysis, atlas-based segmentation, quantification of graph-based connectivity networks, and voxel-based analysis to name but a few. Each of these techniques has its own strengths and limitations and there is no single technique that can be regarded as superior to all the others. The most optimal analysis approach depends on many factors, including:
The purpose of the analysis (e.g., to delineate a known fibre bundle, to explore the data)
Whether it is for a single subject or group comparison
If there is a hypothesis about the location and extent of change or difference in DTI measures
The data acquisition protocol (e.g., # of directions, b-value, voxel size)
The data quality
…
For simplicity, the different techniques that are available to analyze DTI data sets can be classified into three categories:
Whole-brain analyses
Region-specific analyses
Voxel-based analyses
This subdivision of analysis techniques is based on the scale that is used to evaluate the DTI measures in the brain. As shown in Fig. 8.3, DTI analysis can be performed at the level of the whole brain (Fig. 8.3a), at a regional level (Fig. 8.3b), or at the smallest scale, i.e., the voxel (Fig. 8.3c).
Fig. 8.3
Subdividing DTI analysis methods into three parts: whole-brain analysis approaches (a), region-specific analysis methods (b), and voxel-based analysis methods (c)
In most voxel-based analysis approaches, DTI measures are evaluated at the voxel level, but at the same time in every voxel of the brain. As such, this method can also be regarded as a whole-brain analysis technique. This next section provides a brief overview of each of these major classes of DTI analysis methods.
Whole-Brain Analysis Techniques
The general concept of whole brain DTI analysis techniques is to obtain quantitative DTI measures from all the voxels that include brain white matter, and can thus be subdivided into two parts (see Fig. 8.4):
Fig. 8.4
An example of whole-brain analysis of DTI measures. Brain or white matter voxels are defined by a mask created from either an anatomical MRI segmentation or by performing whole brain tractography. A histogram of the diffusion values in these voxels is obtained and relevant information can be extracted and compared
An approach to define which voxels are part of the brain white matter
An approach to extract relevant DTI information from these voxels
The selection of the voxels to be included in the analysis can be done using brain segmentations from anatomical MRI data sets (located in the same image space as the DTI data) or by performing whole-brain tractography. In whole-brain tractography, all brain voxels are used as seed regions to start the tractography process. Using specific parameter constraints such as an FA and curvature threshold, the tracts will mainly traverse white matter voxels, as the FA is lower in grey matter and cerebrospinal fluid.
Once the voxels are selected, the DTI information can be extracted. If anatomical MR based segmentations are used, it is important to ensure that the anatomical image and the DTI data set are located in the same space. It is therefore necessary to register both images to each other (image registration is introduced in Chap. 10). Usually, the anatomical image is transformed to the non diffusion-weighted image using a rigid-body or affine transformation. As all the diffusion-weighted images should already be in the same space as the non-diffusion-weighted image (done during the motion correction, see Chap. 7), the calculated tensors and diffusion metrics will also be aligned with the anatomical MRI. Extracting the diffusion information after whole-brain tractography doesn’t involve image registration with an anatomical MR image. DTI measures from voxels that contain a streamline from the whole-brain tractography result will be selected.
Histogram Analysis
Once the DTI measures have been extracted from the selected voxels of interest, they can be summarized using a histogram (see Fig. 8.4). This histogram is a frequency distribution that displays the number of voxels with a specific value of the diffusion measure (e.g., FA). From this histogram, the following parameters can be extracted:
Mean or median of the diffusion measure values
The peak height of the histogram: voxel count of the value that is present the most
The peak location of the histogram: the diffusion measure value that is present the most in the data set
Usually, studies will only obtain the mean or median value of the diffusion measure. The resulting values can then be statistically compared across groups of subjects or correlated with other variables, such as clinical, neuropsychological or other test scores.
Whole-brain analysis of DTI data has the following strengths and limitations:
Strengths
Does not require prior knowledge of where hypothesized differences could be found
Less reliant on user intervention than other approaches
Results obtained quickly, without labor-intensive interventions
Fewer statistical tests (i.e., multiple comparisons), compared to other techniques as only one set of diffusion measures is obtained for the whole brain
Limitations
Regional information is lost as DTI measures are averaged over the whole-brain white matter
Results are sensitive to partial volume effects due to atrophy
Results can depend on segmentation/registration accuracy or whole-brain tractography parameters
Region-Specific Analysis Techniques
In region specific analysis techniques, diffusion measures are obtained in one or more predefined areas of the brain. DTI measures, such as the FA and MD are thus statistically evaluated in an anatomical region or white matter tract reconstruction. There are two main approaches:
Region of interest analysis
Tractography analysis
Region of Interest Analysis
In region of interest (ROI) analysis , diffusion measures are obtained from a specific brain region, which is defined by manual delineation or by automated segmentation or parcellation. As automated segmentations are less observer dependent and thus more reproducible, they have some clear advantages over manual delineations. However, automated segmentations are not always appropriate, for example due to ill-defined boundaries in regions of pathology.
Manual delineation of ROIs is typically performed by fr eehand drawing of the region or by placing basic shapes such as circles or squares on 2D slices. Due to the manual interaction that is needed, the results are observer dependent. In addition, manually delineating specific regions in a group of subjects is time consuming. This is especially the case when white matter fibre bundles need to be delineated, as they run through several slices, and thus many 2D ROIs need to be drawn in order to delineate as much of the bundle as possible. Ideally, ROIs should be drawn on maps that are independent of the diffusion measures of interest. For example if FA maps are used to delineate regions, and the FA is a measure of interest, a bias can be introduced in the results because ROIs are typically drawn around regions with a higher FA. However, FA might be lower in areas of pathology, which could then be excluded from the analysis, thereby artificially decreasing differences with the control group. In contrast, regions delineated on an anatomical MR (T1/T2) image are drawn independently of the diffusion measures that will be analyzed. However, this approach also has some potential limitations, as the anatomical MRI data set needs to be registered accurately to the DTI data set, which is not always straightforward due to different distortions in both images [3]. An alternative approach is to delineate the regions on the non-diffusion-weighted image, which should be in the same space as the quantitative diffusion maps after motion correction. However, the delineation of white matter bundles on either the anatomical scans or non-diffusion-weighted images is confounded by the lack of orientational contrast (which is provided by the color FA map). This is illustrated in Fig. 8.5, which shows axial, sagittal, and coronal slices of a T1-weighted image and corresponding color-coded FA slices of a healthy subject
Fig. 8.5
Axial, sagittal, and coronal slices of a T1 weighted image and the color-encoded FA maps of a healthy subject
In the presence of lesions, ROI analysis (actually all DTI analyses) can become challenging. This is demonstrated in Fig. 8.6, which illustrates axial non-diffusion-weighted and color-encoded FA slices from five patients with cerebral palsy. The lesions in the left hemisphere clearly affect the visualization of the corticospinal tract (CST). Reliably comparing diffusion values from the left CST with the contralateral CST in this population or of a healthy population would be difficult. For example, delineating the ROI based on the color-encoded FA maps can be biased by the lower FA values in the lesion. However, drawing the ROI on the non-diffusion-weighted image, which is independent from the diffusion measures, is also challenging.
Fig. 8.6
Axial non-diffusion-weighted and color-encoded FA slices in five patients with cerebral palsy. The presence of lesions make ROI delineation challenging
Instead of delineating regions and structures manually, automatic segmentation methods can be used. Such automated methods are especially useful when structures or lesions can be accurately segmented on the anatomical MRI. As an example, T2 lesions could be segmented in a patient with multiple sclerosis. After registering the T1/T2 MR image to the DTI data set and applying the deformation field to the segmented lesion masks, DTI measures can be derived from these lesions. Bear in mind that these results will strongly depend on the segmentation and registration accuracy, especially when some of the lesions are small. In addition, the resolution of the DTI image is typicall y lower than the resolution of the anatomical MRI that is used for the segmentation, leading to partial volume effects. Finally, note that it is not easy to obtain automatic segmentations of white matter tracts based on anatomical MR images.
Region-specific analysis of DTI data by using the ROI approach has the following advantages and limitations:
Strengths
In comparison to whole-brain analyses, more regionally specific information is obtained
Manual delineation is closer to the original data than other techniques which require more complex modeling and image processing
ROI analysis is less dependent on parameter settings than tractography or voxel-based analysis
Limitations
Requires a prior hypothesis about where differences could be found, as that is where the ROI will be placed.
Intra- and inter-observer reproducibility of results should be assessed, as manual delineation is subjective.
Requires clear guidelines that describe how the ROI should be defined (e.g., size, anatomical location, boundaries).
The selection of many ROIs increases the number of statistical tests that are performed and therefore correction for multiple comparisons is required.
Results can be biased if ROIs are drawn on the parameter map of the measure of interest, e.g., drawing an ROI on a color FA map when investigating FA.
Results can depend on segmentation/registration accuracy when ROIs are delineated on anatomical MR images.
Delineating regions manually is very time consuming and laborious.
Excludes (potentially valuable) information from regions that are not selected/studied.
Drawing an ROI or segmenting a str ucture can be challenging in the presence of pathology.
Tractography Analysis
The delineation of white matter tracts using only 2D manually drawn ROIs or anatomical MR images is not optimal for the reasons outlined previously. However, by using the inherent directional diffusion information in the DTI data set, virtual representations of white matter fibre bundles can be reconstructed, using tractography (or “fibre tracking”). Tractography refers to the mathematical reconstruction of white matter fibre bundle representations by integrating the local diffusion tensor information from every voxel. In its simplest form, tractography can be compared with a puzzle “connecting the dots.” As shown in Fig. 8.7, by following the letters alphabetically, and drawing lines between subsequent letters, one can complete the drawing and the global picture.