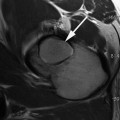
Fig. 15.1
Radial images through the center of the femoral head and perpendicular to the acetabular rim are created
Structural Assessment
Variations in Acetabular Size/Femoral Head Coverage
The size and configuration of the acetabulum can be measured utilizing radiographically established parameters, although baseline MRI values for the assessment of acetabular size/femoral head coverage are not currently available.
The lateral center–edge angle (LCA) and the ventral center–edge angle (VCA) may be measured in order to quantify the lateral and anterior femoral head coverage in accordance with the radiographic descriptions of Wiberg [3] and Lequesne and de Seze [4].
In MRI, the LCA is assessed on coronal images by measuring the angle between (1) a line perpendicular to the transverse axis of the pelvis through the center of the femoral head and (2) a line connecting the center of the femoral head with the most superolateral point of the acetabulum. The VCA is measured on sagittal images by measuring the angle between (1) a vertical line passing through the center of the femoral head and (2) a line connecting the center of the femoral head and the most anterior part of the acetabulum (Fig. 15.2).
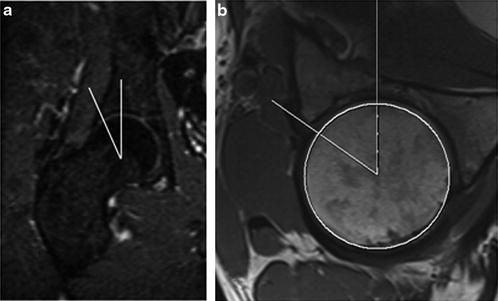
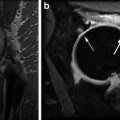
Fig. 15.2
Lateral center–edge angle (LCA) (a) and ventral center–edge angle (VCA) (b) assessment
According to Pfirrmann et al. [5], the acetabular depth can be quantified on transverse oblique images wherein the depth of the acetabulum is quantified as the distance between the center of the femoral head and a line connecting the anterior and posterior acetabular rim (Fig. 15.3). The value is classified as “positive” if the center of the femoral head is lateral to the line that connects the anterior and the posterior acetabular rim. In their study on patients with femoroacetabular impingement (FAI), Pfirrmann et al. noted that the acetabulum was significantly deeper in patients with pincer impingement arising by general or local femoral head over-coverage (coxa profunda, mean depth: 4.8 mm) compared to those with a cam impingement (mean depth: 0.7 mm) with an insufficient femoral offset but normal acetabulum configuration. However, as with the LCA and VCA measures, normative MRI values for the acetabular depth have yet to be determined.
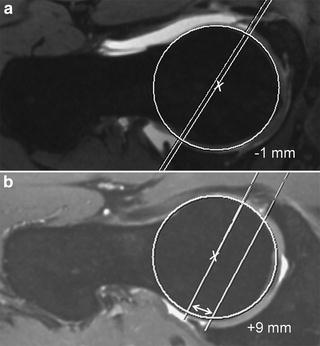
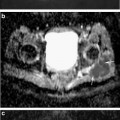
Fig. 15.3
Acetabular depth assessment according to Pfirrmann et al. [5]. The depth of the acetabulum is quantified as the distance between the center of the femoral head and a line connecting the anterior and posterior acetabular rim. The value is classed as positive if the center of the femoral head is lateral to the line that connects both the anterior and the posterior acetabular rim
Variations in Acetabular Version
The acetabular version, defined as the angle between (1) a line connecting the anterior and posterior rim of the acetabulum and (2) a line extending anteriorly from the posterior wall, is measured on axial images (Fig. 15.4). The acetabulum is normally anteverted by 15–25°. However, given the normal decrease in anteversion from superior to inferior [6], it is important to measure the acetabular version in various planes, i.e., cranially and centrally [7]. As noted earlier, baseline values, which originate from 3D imaging techniques such as MRI or CT, are not currently available.
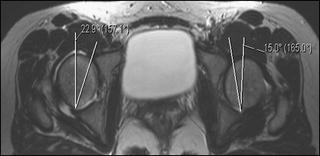
Fig. 15.4
Measurement of acetabular version. The acetabular version is obtained in the axial plane by measuring the angle between a line connecting the anterior and posterior rim, and a line extending anteriorly from the posterior wall. Of note, measurements of the acetabular version should be performed in multiple planes, i.e., cranially and centrally
Variations in Femoral Version
The femoral anteversion decreases from approximately 40° in childhood to 15° in adulthood. Clinically, patients with a pathological increase or decrease in femoral torsion may present with an in-toeing or out-toeing gait pattern. Notably, an abnormal femoral neck version has been associated with OA of the hip and knee, slipped capital femoral epiphysis (SCFE), and patella instability [6, 8, 9] (Fig. 15.5).
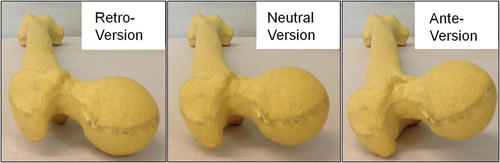
Fig. 15.5
Femoral retroversion (left), neutral version (middle), and anteversion (right)
Several techniques have been described for the assessment of femoral version. According to Tomczak [10] and Koenig [11


Related posts:

Stay updated, free articles. Join our Telegram channel
Full access? Get Clinical Tree
