Fig. 3.1
Subfield segmentation from high-resolution T2-weighted image. Automatic volumetry is possible in hippocampal subfields and adjacent cortical subregions. CA cornu ammonis, DG dentate gyrus, SUB subiculum, ERC entorhinal cortex, BA35/36 Brodmann area 35/36 (which together form the perirenal cortex), CS collateral sulcus
This chapter describes common VBM techniques using MRI incorporated in statistical parametric mapping (SPM) software (http://www.fil.ion.ucl.ac.uk/spm/) running on Matlab platform and its application to normal aging and AD. Then a new VBM technique using X-ray computed tomography (CT) is proposed as a substitute for MRI. Finally newly developed stand-alone VBM software running on Windows is described in detail as an adjunct to the clinical assessment of AD.
3.2 VBM
3.2.1 VBM Using MRI
MRI data for VBM are acquired as a three-dimensional volumetric T1-weighted image, which has a thin thickness of 1–1.5 mm without interslice gap. The image matrix is usually 256 × 256. VBM of MRI data comprises segmentation into gray matter, white matter, and cerebrospinal fluid (CSF) partitions, anatomical standardization of all the images to the same stereotactic space using linear affine transformation, and further nonlinear warping, smoothing, and finally a statistical analysis. The output from the method is a statistical parametric map.
3.2.1.1 Optimized VBM
This method has been developed to remove areas of missegmented nongray matter voxels by the introduction of additional preprocessing steps to exclude nonbrain voxels prior to anatomical standardization and subsequent segmentation [10, 11]. Initial segmentation involves segmentation of the original structural MR images in native space into gray and white matter images, followed by a series of fully automated morphological operations to remove unconnected nonbrain voxels in skull and dural venous sinus from the segmented images. The resulting images are extracted gray and white matter partitions in native space. The extracted segmented gray/white matter images are standardized to the gray/white matter templates, thereby preventing any contribution of nonbrain voxels and affording optimal anatomical standardization of gray/white matter. To facilitate an optimal segmentation, the optimized standardization parameters are reapplied to the original, whole-brain structural images in native space. The optimally standardized whole-brain structural images in stereotactic space are then segmented into gray and white matter and CSF partitions and subject to a second extraction of standardized segmented gray/white matter images. The brain extraction step is repeated at this stage because some nonbrain voxels from scalp, skull, or venous sinuses in the optimally normalized whole-brain images can still remain outside the brain margins on segmented gray/white matter images.
As a result of nonlinear spatial normalization based on discrete cosine transforms, the volumes of certain brain regions may increase, whereas others may shrink. In order to preserve the volume of a particular tissue within a voxel, a further processing step is incorporated. This involves multiplying (or modulating) voxel values in the segmented images by the Jacobian determinants derived from the anatomical standardization step. In effect, analyses of modulated and unmodulated data try to identify regional differences in the absolute amount (volume) of gray matter, whereas analysis of unmodulated data tests for and in the concentration of gray matter, respectively. Finally, each optimally standardized, segmented, modulated image is smoothed by convolving with an isotropic Gaussian kernel with 12-mm full width at half maximum (FWHM). The smoothing step helps to compensate for the inexact nature of the anatomical standardization. Moreover it has the effect of more normally distributing the data, increasing the validity of parametric statistical tests.
3.2.1.2 VBM Using SPM8 Plus Diffeomorphic Anatomical Registration Using Exponentiated Lie Algebra (DARTEL)
DARTEL incorporated in SPM8 is an implemented algorithm for diffeomorphic image registration [12]. It has been formulated to include an option for estimating inverse consistent deformations. This nonlinear registration is considered a local optimization problem, which is solved using a Levenberg–Marquardt strategy. A constant Eulerian velocity framework is used, which allows a rapid scaling and squaring method to be used in the computations. This technique improves intersubject registration. VBM8 toolbox (http://dbm.neuro.uni-jena.de/vbm8/) is available for VBM using SPM8 plus DARTEL for both cross-sectional and longitudinal studies.
In the SPM8 plus DARTEL procedure, T1-weighted images were classified into gray matter, white matter, and CSF using the segmentation routine implemented in SPM8, which gives both the native space versions and DARTEL imported versions of the tissues. SPM8 and VBM8 toolbox provides better segmentation accuracy and reliability than FMRIB’s Software Library and FreeSurfer software programs [13]. The DARTEL imported versions of gray and white matter were used to generate the flow fields (which encode the shapes) and a series of template images by running “DARTEL (create templates)” routine. During this step, DARTEL increases the accuracy of intersubject alignment by modeling the shape of each brain using millions of parameters. DARTEL works by aligning gray matter among the images while simultaneously aligning white matter. This is achieved by generating increasingly crisp average template data, to which the data are iteratively aligned. The flow fields and final template image created in the previous step are used to generate smoothed (8-mm FWHM), modulated, spatially normalized, and Jacobian scaled gray and white matter images resliced to isotropic voxel size in Montreal Neurological Institute space. DARTEL provides better registration accuracy than other widely used nonlinear deformation algorithms including optimized VBM [14].
3.2.1.3 VBM in Normal Aging
Studying the distribution and time course of alterations that occur in the normal brain with aging is important for understanding the mechanisms underlying these changes and for better characterization of neurological disorders whose risk increases with advancing age. The advent of VBM techniques of MRI structural data has facilitated a sensitive detection of regional patterns of gray matter and white matter volume changes. Most studies have employed a cross-sectional design in which correlations of volume and age at specific time points are used to make inferences about how the aging process affects the brain structure over time. However cross-sectional studies inevitably have some degree of overlap of regional volume changes between normal aging and AD [15]. Large longitudinal VBM studies involving the acquisition of serial MRI measurements over time are desirable in the same subject samples [16].
Numerous VBM investigations have been conducted on gray matter volume changes with advancing age (Fig. 3.2). Most cortical regions prominently in the frontal and insular areas have been reported to show a linear negative association between volume and age [10, 17–24]. In contrast, many reports have found preservation of gray matter volume in specific structures such as the amygdala, hippocampus, and thalamus [10, 18, 20, 23, 24]. Relative preservation of these subcortical limbic or paralimbic regions is consistent with the functional importance of the thalamo-limbic circuits in sensory integration, arousal, emotion, and memory. This preservation in areas with early maturation may lend credence to the contention that later-maturing cortical regions are more vulnerable to age-related morphologic changes. These age-related features may be already present during earlier stages of adulthood. During non-elderly life prefrontal areas showed linear volume reduction with advancing age, while the medial temporal region showed volume preservation [24]. Cortical gray matter volume showed an age-related reduction even during adolescence [25].

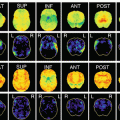
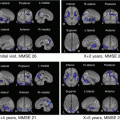
Fig. 3.2
Age-related atrophy in gray and white matter in healthy controls. VBM analysis for 93 healthy volunteers aged from 38 to 85 years showed significant negative correlation of gray and white matter volume with advancing age most prominently in insula and frontal cortex (red) and thalamic radiation and deep frontal white matter (yellow), respectively
Throughout adulthood, white matter volumes also showed a linear negative association with advancing age in the anterior thalamic radiation, internal capsule, cerebral peduncle, cerebellum, and external capsule [26] (Fig. 3.2). In contrast, nonlinear relationships between white matter volume and age were found in the superior longitudinal fascicle and superior corona radiata. This nonlinear inverted U-shaped relationship with age, slightly increasing during adulthood, is consistent with the notion of an ongoing maturation of the white matter beyond adolescence, reaching its peak in the fourth decade.
In a longitudinal study of an interval of 2.5 years during adolescence, a significant increase in white matter was found in the frontal white matter bilaterally connected via the body of the corpus callosum [25]. In this context, it must be remembered that dehydration may induce a significant widespread loss of white matter volume in the temporoparietal areas [27]. Consequently, VBM studies investigating white matter changes should consider controlling subjects’ hydration state to avoid the potential confounder of differences in hydration.
As mentioned before, the morphology of cortical gray matter is assessed using not only VBM but also cortical thickness measures. How gray matter changes identified using voxel-based cortical thickness measures compare with local gray matter volume changes identified using VBM was investigated [28]. VBM and voxel-based cortical thickness measures yield overall consistent results when investigating healthy aging, but voxel-based cortical thickness provides a more sensitive measure of the age-associated decline in gray matter compared with VBM. Voxel-based cortical thickness specifically measures cortical thickness, while VBM provides a mixed measure of gray matter including cortical surface area or cortical folding as well as cortical thickness.
3.2.1.4 VBM in AD
Structural MRI measurements of brain atrophy are promising biomarkers for tracking disease progression in patients with AD. Progression of atrophy matches the stereotypical pattern of an increase in neurofibrillary tangles described by the Braak staging scheme [29]. Six stages are reported in the development of neurofibrillary tangles. Stages I and II involve the transentorhinal region which is situated along the lateral border of the entorhinal cortex and mediates between the entorhinal allocortex and temporal neocortex. The entorhinal region is located between the hippocampus and transentorhinal region, spreading over both the ambient gyrus and anterior portions of the parahippocampal gyrus. The brain change remains below the threshold associated with clinical symptoms. Stages III and IV show severe involvement of both the entorhinal and transentorhinal regions accompanied by mild changes in the hippocampus and the virtual absence of changes in the neocortical regions. The clinical assessment of many individuals at these stages notes an impairment of cognitive functions. Stages V and VI show involvement of the neocortical association areas. These stages correspond to the conventionally used criteria for neuropathologic confirmation of the clinical diagnosis of AD. Many researchers have demonstrated progression of atrophy in AD corresponding to these Braak stages using VBM [30–40]. In the Alzheimer’s Disease Neuroimaging Initiative (ADNI) study [41], VBM showed strong associations between composite scores of memory generated from ADNI’s neuropsychological battery and gray matter atrophy in the medial and lateral temporal lobes and between composite scores of executive functions and gray matter atrophy in the parietal and temporal lobes.
Antemortem VBM studies [42] in demented patients with AD pathology revealed three subtypes based on the distribution of neurofibrillary tangles: typical AD, hippocampal-sparing AD, and limbic-predominant AD. Compared with typical AD, hippocampal-sparing AD has more neurofibrillary tangles and atrophy in the cortex and fewer in the hippocampus, with the opposite pattern seen in limbic-predominant AD. Age at onset differed between the subtypes, with the youngest ages recorded in the group with hippocampal-sparing AD and oldest in the group with limbic-predominant AD. This difference well explains why patients with early-onset AD have atypical clinical syndromes associated with widespread involvement of the association cortex. Topographical differences in gray matter involvement between early- and late-onset AD have also been reported by several investigators [43–45].
White matter changes have been reported to be less marked than gray matter ones in AD. A meta-analysis of VBM studies of white matter volume alterations in AD revealed significant volume reductions in the left parahippocampal gyrus extending to the temporal white matter, the right temporal white matter extending to the parahippocampal gyrus, and posterior corpus callosum [46]. These white matter volume reductions are close to the structures of memory formation including the hippocampus, amygdala, and entorhinal cortex. The mechanism underlying white matter atrophy in AD remains unclear. According to one argument, gray matter degeneration results in white matter atrophy through demyelination because these regions contain efferent connections of both the hippocampus and amygdala. Another argument states that a white matter deficit contributes to the development of cortical pathology in AD. White matter damage in AD results in cortico-cortical and/or cortico-subcortical disconnection of cognitive networks and thus contributes to cognitive impairment in AD patients.
3.2.2 VBM Using X-Ray CT
Basically, in diagnostic strategies for dementias, X-ray CT is used for screening major structural brain changes resulting from hemorrhage, tumor, edema, or other organic diseases. Nowadays, MRI is used mainly for this purpose, though X-ray CT is still more widely available and has some advantages over MRI in economy, time, and spatial resolution. Brain X-ray CT images are more homogeneous and show less distortion than MR images, even though they are scanned with different machines or protocols. Furthermore, recently, X-ray CT data are available from a routine study obtained with hybrid machines: single photon emission computed tomography (SPECT)/CT or positron emission tomography (PET)/CT.
X-ray CT was developed by an English electrical engineer Godfrey Hounsfield in 1967. His name is immortalized in the Hounsfield unit (HU), the definition of the scale for measurement of radiodensity. The degree of HU of air and water is defined as −1000 and 0 HU, respectively, and the proportional scaling is applied to X-ray attenuation. Though the tissue differentiation ability in X-ray CT is inferior to that of MRI, it is 2–4 HU, representing a more than 10% difference between gray and white matter [47]. This difference is possibly used to segment gray and white matter in brain X-ray CT images and enables VBM.
3.2.2.1 Scan Parameter
For X-ray CT data acquisition, from the radiation protection point of view, the radiation dose should be kept as low as reasonably achievable. The usual brain X-ray CT dose used in clinical radiology is sufficient for segmentation, though the low-dose X-ray CT used for PET/CT or SPECT/CT is not. Example parameters are as follows: in the helical scanning mode, 1.0-sec gantry rotation time, 130 kV, 150–240 mAsec, 0.5:1 beam pitch, 3-mm table feed per gantry rotation, and 6 × 2 mm detector configuration. The images were reconstructed at 3-mm thickness with filtered back projection, a display field of view of 25 cm, and a reconstruction matrix size of 512 × 512. Image quality and thin slice thickness are important. Finally image voxel size is adjusted to approximately 2 mm for segmentation. Accordingly, though the x- and y-axis resolution is adequate, z-axis should be interleaved. Examples of images suitable and unsuitable for segmentation are shown in Fig. 3.3.

Fig. 3.3
X-ray CT images which are suitable (a) and unsuitable (b) for segmentation. Both images are obtained from the same subject with different parameters. Scanning parameters in image (a) are described as an example; in the helical scanning mode, 1.0-s gantry rotation time, 130 kV, 150–240 mAsec, 0.5:1 beam pitch, 3-mm table feed per gantry rotation, and 6 × 2 mm detector configuration. (c) Cortical image segmented from (a). (d) Cortical image segmented from (b). Image quality in (d) is not adequate for VBM
3.2.2.2 Image Preprocessing and Segmentation
Before using the segmentation function in SPM12, Image J (http://rsb.info.nih.gov/ij) was used to preprocess the X-ray CT images. This software was used to trim the edges of the head and to rescale the voxel sizes equivalent to the tissue probability maps in SPM12, approximately 2 × 2 × 2 mm. Extraction of gray and white matter was performed using the segmentation module of SPM12. “Extremely heavy regularization” was selected for the bias regularization item, “no correction” was chosen for bias FWHM, “nonparametric” was selected for the number of Gaussians for every tissue probability map, and a shorter sampling distance of “2” was set for the sampling distance. Figure 3.4 is a sample image of the result from segmentation applied to a CT image as compared with MRI. Segmented gray matter images from X-ray CT were anatomically standardized and then smoothed with isotropic Gaussian kernel to use the partial volume effect to create a spectrum of gray matter intensities. The gray matter densities are equivalent to the weighted average of gray voxels located in the volume fixed by the smoothing kernel; therefore, regional intensities can be taken as being equivalent to gray matter volumes for MRI [8, 30]. Voxel-based analysis can be applied to these images.

Fig. 3.4


Cortical images segmented from X-ray CT (a) and MRI (b), and smoothed images with isotropic Gaussian kernel (c and d, respectively) from the same subject. Smoothed images show fundamental similarity of distribution of the gray matter in CT and MRI
Related posts:

Stay updated, free articles. Join our Telegram channel
Full access? Get Clinical Tree
