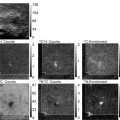
Fig. 1.
An example of Blink Microscopy data from filamentous actin on a glass surface. Left : At the beginning, all fluorophores are in their ON state. This ensemble of fluorescent molecules provides a diffraction limited image. Center : The excitation laser quickly drives all molecules into their OFF-state while individual molecules switch back ON and can be localized as single-molecule events with high precision. This step is at the heart of Blink Microscopy and most experimental parameters described in this chapter aim at optimizing this single-molecule blinking. Right : all found localizations are binned into a super-resolved image (reprinted from ref. 36 with kind permission from Springer).
Interestingly, both STED/RESOLFT and localization-based approaches can use the same types of organic fluorophores, although the photophysical requirements for the fluorophores are considerably different. Both approaches require very photostable fluorophores that can be switched between an ON- and an OFF-state (16, 17). One exemplary method exploits generic dark states (e.g., radical anion states) of the fluorophores in order to switch the major fraction of molecules OFF, so that the remaining subpopulation of molecules can be precisely localized. In this method, fluorescent dyes are switched OFF by transiently accepting an electron from a reductant molecule, which then yields dark states of up to several hundred seconds (Fig. 2a) (6, 21, 22). Such dark states appear as blinking in single-molecule intensity transients (see Fig. 2b). Therefore, this technique has been termed “Blink Microscopy.”
Fig. 2.
Dark state reactions used for Blink Microscopy (taken from ref. 16). (a) Jablonski diagram showing the photophysical states of a single fluorophore. The driving force behind the OFF-switching reaction is provided by fluorescence excitation (k exc), followed by occasional intersystem crossing (k ISC) and reduction by a reductant in solution (k Red). The fluorophore switches back ON due to oxidation by oxygen or an added oxidant (k Ox). Note that there is no need for a separate switching laser and that the reaction is fully reversible, so that each dye can run through many ON-OFF cycles. (b) Fluorescence vs. time transient showing several switching cycles of a single fluorophore.
To rationalize the blinking, we take a brief look at the thermodynamics of photoinduced electron transfer reactions. Following excitation, the fluorescent dye is shelved from the ground state, S0, to the first excited single state, S1. In other words, the dye has entered a state of higher energy. In this state, the dye is a better electron acceptor than it was when it was in the ground state because the highest occupied molecular orbital of the molecule is only singly occupied, and can therefore accept an electron quite easily. When a putative electron donor such as ascorbic acid or a thiolate ion collides with a dye in the excited singlet or triplet state, electron transfer to the dye can occur. The lifetime of the radical anion (for a dye molecule with an assumed neutral ground state) depends on the stability of the radical anion and the concentration of potential electron acceptors, such as oxygen. Thus, the lifetime can be controlled in vitro by adapting the oxidant (e.g., the oxygen) concentration. For in vivo measurements, certain dyes that show sufficiently long OFF-state lifetimes in physiological oxygen concentrations have to be used. Due to their high reduction potentials, examples of suitable dyes include the oxazines ATTO655, ATTO680, and ATTO700 (16, 22).
Long OFF-states are of profound importance for super-resolution microscopy methods that utilize successive single-molecule localizations. The OFF-state lifetime and the time it takes to read out the photons emitted during one ON-state are crucial parameters affecting the obtainable resolution. More molecules can be registered for an area of the size of the point-spread function when the ratio of OFF- to ON- times is large. This requires the use of dyes with long OFF-states, comparably strong lasers, and fast cameras to enable fast readouts (16).
Belonging to the class of techniques that employ successive single-molecule localizations, Blink Microscopy distinguishes itself by working with common organic dyes and requiring only one laser (for each color, in multi-color applications). In addition, Blink Microscopy can work in the presence of oxygen, and offers a rather broad range of possible buffer conditions that are close to physiological. Blink Microscopy has been used to study cytoskeletal structures, such as actin filaments in fixed cells, amyloid aggregates, DNA nanostructures, and single-molecule assembled structures (6, 22–25). In parallel, very similar techniques have been developed by the Sauer and the Hell lab, which have been termed dSTORM and GSDIM (5, 7, 26), respectively, showing that single-molecule blinking can even be applied in living cells and might also be based on dark states other than radical ion states (27, 28).
In this article, we provide a detailed protocol for Blink Microscopy, including the microscope setup, chemical and sample preparation, measurement procedures, and issues to consider for data analysis and trouble-shooting. The method is exemplarily demonstrated by imaging DC-SIGN, a transmembrane lectin that forms domains on the membrane of dendritic cells. These domains are commonly too small to be resolved by conventional fluorescence microscopy (29).
2 Materials
2.1 Chemicals and Consumables
1.
MilliQ water.
2.
PBS, pH 7.4, preferentially as tablets to dissolve in water.
3.
Ascorbic acid (AA).
4.
Methyl viologen (MV).
5.
Mercaptoethylamine (MEA).
6.
Beta-mercaptoethanol (ME).
7.
TCEP (Sigma 646547).
8.
Tris.
9.
Catalase (Sigma C100-50 mg).
10.
Glucose oxidase (Sigma G2133-50KU).
11.
Glucose.
12.
Glycerol 86%.
13.
LabTek chambered cover glasses (Nunc 155411).
14.
96-well Plate sealing sheets.
15.
16% Para-formaldehyde (PFA) stock solution.
16.
Primary antibody corresponding to a protein of interest.
17.
Secondary antibody, preferably unlabeled Fab2 fragments.
18.
Amine reactive dye, e.g., ATTO655 NHS-ester. Dissolve in DMF, make 0.1 mg aliquots and dry in a speed-vac. Store at −20°C.
19.
Oxygen scavenging stock solution (20×): 5 ml 100 mM Tris–HCl, 25 mM KCl, pH 7.5; 5 ml Glycerol (86%); 40 μl TCEP (0.5 M); 40 μl Catalase (20 mg/ml as supplied); 10 mg Glucose oxidase. Store in working aliquots at −20°C. Due to its negligible influence on dye photophysics, TCEP is used instead of DTT.
20.
NAP-5 Columns (GE Healthcare).
2.2 Microscope
1.
Leica SR-GSD, Zeiss Elyra PAL-M or Nikon nSTORM commercial microscope system or comparable custom-built setup.
2.
Appropriate excitation laser with at least 100 mW output power.
3.
High-quality emission and excitation filters.
4.
High numerical aperture (≥1.4) oil-immersion objective with 60× or 100× magnification.
5.
Back-illuminated EMCCD-camera.
6.
Stage micrometer for pixel size calibration.
3 Methods
3.1 Sample Preparation
3.1.1 Cells
Cells are grown in standard media and at recommended conditions. Growing the cells on LabTek chambered cover glass slides offers the advantages that they can easily be transferred to the microscope, buffers can be changed easily, and chambers can be sealed for oxygen removal. When using other non-glass cell culture slides, the oxygen permeability of some plastics should be considered.
Detailed conditions for the proper growth and fixation of cells depend strongly on the type of cells used and the molecule being imaged, and are not described here. However, it is important to note that fixation chemicals may have an influence on dye photophysics. In addition, fixation methods, especially those which use hardening media, might alter the shape of the structures of interest. Dehydrating formulas, for example, tend to flatten cells and change the appearance of the nucleus (30). Therefore, if Blink Microscopy is unsuccessful or yields unexpected results, you may want to consider using alternate methods for fixation. Correspondingly, we recommend keeping the samples in buffer, if possible. Another benefit of keeping cells in buffer is that it allows for simple and fast tuning of the ON- and OFF-times by changing the reductant and oxidant concentrations in the buffer solution.
3.1.2 Fluorophores
It is as important to choose an appropriate fluorophore and appropriate imaging and staining conditions, as it is to use a highly sensitive microscope. There are many options available in regards to choosing an appropriate fluorophore to use for imaging, but in general, commercially available dyes (e.g., ATTO dyes) work well for use with Blink Microscopy (5, 6, 22, 26).
3.1.3 Antibody Labeling
As with other immunofluorescence-based labeling methods, a primary antibody must be carefully chosen to ensure both reliable specificity and affinity for the desired target molecule. It is best to directly label the primary antibody with the fluorophore, as this will lead to both less spatial distance between the molecule of interest and the dye, and a simpler estimation of the number of dyes per target protein. Alternatively, if labeling the primary antibody is either technically difficult or results in altered binding to the target protein, sequential immuno-labeling with an unlabeled primary antibody and a labeled secondary antibody can be employed. Keep in mind, however, that this antibody complex can have a spatial extent of 10–20 nm, which may be a limiting factor when imaging very small structures, for example, quantifying nano-domain sizes.
Good protocols for labeling antibodies with fluorescent dyes are provided by the suppliers of reactive dyes, such as NHS-esters and maleimides. Our standard procedure for labeling with amine-reactive NHS-esters is as follows:
1.
Dissolve the protein in PBS at 0.5–1 mg/ml.
2.
Adjust the pH of a 250 μl antibody solution to be between 8.5 and 9.
3.
Dissolve 0.1 mg of dye in 10 μl of DMF, or another water-free solvent.
4.
Add 1–5 μl of dye solution to the antibody solution. Whole IgG molecules contain more amine groups and require more dye than, for example, Fab2 fragments.
5.
Shake at room temperature for at least 3 h.
6.
Remove excess dye using a desalting column (e.g., NAP-5, GE Healthcare).
7.
Determine the degree-of-labeling by absorption spectroscopy of the filtrate.
For Blink Microscopy, it is best to have a low fluorophore number per target molecule. In part, this reduces the likelihood that more than one dye will be simultaneously emitting within the area of a point-spread function (PSF) of the dye. If more than one dye is emitting within a single PSF it is likely that the dyes will be rejected during image processing steps and not included in the final SR image, or will lead to a wrong localization. Both will worsen the quality of the final SR image. Additionally, more fluorophores within a small area may lead to physical contact between dyes, which can alter their photophysical properties and compromise Blink Microscopy
3.1.4 Cell Labeling
In order to generate an accurate SR image (without missing information from unlabeled target molecules) or to estimate the number of molecules from a SR image, it is important to label the structure of interest to saturation or as completely as possible. Saturation can be assured by immunostaining samples with increasing dilutions of primary antibody (combined with an excess of labeled secondary antibody, for sequential immunostaining experiments). The concentration of the primary antibody should be increased until the fluorescence intensity of the structure, using identical acquisition settings for wide-field microscopy, saturates. The lowest antibody concentration that achieves the maximum possible fluorescence intensity is then used for the experiments. For very dense structures, it is possible to label with antibody concentrations below saturation levels in order to achieve single-molecule localization during acquisition. However, in this instance, it should be noted that the final SR image will not represent the complete structure, so the staining should occur at concentrations as close to saturation as possible. Of course, this labeling characterization only works with primary antibodies with high specificity for their target molecule. If antibodies bind nonspecifically, the fluorescence intensity will saturate at much higher concentrations, where the nonspecific fluorescence will outshine the actual signal.
Fixation and staining of cells will depend upon the particular cell type and target structure to be studied. Careful attention should be given to the choice and concentration of antibodies. As an example, the procedure for staining transmembrane proteins DC-SIGN and Dectin-1 on human dendritic cells is given:
1.
Wash cells three times with PBS. Incubate cells in between washes to maintain cell health.
2.
Fix with 4% PFA/PBS, by incubating at room temperature for 20 min. Depending on the structure to be visualized, cell permeabilization may be necessary.
3.
Wash cells three times with PBS. At this stage, cells can be stored in PBS w/0.05% sodium azide at 4°C for several weeks
4.
Block by incubating 30 min or overnight in PBS + 0.1% BSA.
5.
Stain with 100 μl of the primary antibody for the first protein of interest (in this example, mouse monoclonal IgG2b specific for human protein DC-SIGN) for 20 min at room temperature with a concentration of ≈10 μg/ml in PBS + 0.1% BSA.
6.
Wash cells three times with PBS.
7.
Add 100 μl of the secondary antibody (in this example, goat anti-mouse ATTO655-Fab) at a concentration of ≈2 μg/ml in PBS w/0.1% BSA. Incubate at room temperature for 15 min in the dark (covered with foil or in a drawer).
8.
Wash cells five times with PBS.
9.
If a second color is required, proceed as described in steps 10–14 below. Otherwise see step 15.
10.
Stain with 100 μl of the other primary antibody for the second protein of interest (in this example, goat polyclonal IgG specific for human protein Dectin-1) for 20 min at room temperature with a concentration of ≈10 μg/ml in PBS + 0.1% BSA.
11.
Wash cells three times with PBS.
12.
Add 100 μl of appropriate secondary antibody for the second protein (in this example, rabbit anti-goat Alexa546). Incubate at room temperature for 15 min in the dark (covered with foil or in a drawer).
13.
Wash cells five times with PBS.
14.
Store cells in 2 ml PBS, at 4°C, sealed with parafilm and protected from light.
15.
Visualize with fluorescence for Blink Microscopy.
3.2 Microscope Set-Up
A prerequisite for any super-resolution approach that is based on the localization of single molecules is the ability to detect single fluorophores with a good signal-to-noise ratio (SNR). This imposes an upper limit for the resolution that can be achieved for a given dye. It is also important to use a strong laser, combined with a fast camera, which can drastically reduce the image acquisition time and increase the achievable resolution by optimizing the ratio of ON-times to OFF-times.
The task of breaking the diffraction barrier is not trivial and requires attainment of the highest detection efficiency, signal-to-noise ratio and optical resolution. Any trade-offs made regarding the components of the microscope will certainly compromise SR image quality and resolution.
3.2.1 Microscope Body
Any microscope body that has an entrance for a laser light source and a side-/front- or bottom port to attach an EMCCD camera can be used. An autofocus system is not necessary; however, it may be helpful if longer image acquisition times are required. Manual refocusing during the acquisition of a SR image introduces too many vibrations.
3.2.2 Light Source
Blink Microscopy requires a relatively strong CW laser that has at least 100 mW output power. This intensity is needed in order to drive the fluorophore into its dark radical form within milliseconds of illumination. An even higher-powered laser may be beneficial if the light is coupled into an optical fiber, or if a large sample area is to be illuminated.
3.2.3 Filters and Dichroics
High-end filters and dichroics are essential to obtain a suitable signal-to-noise ratio. For most solid-state laser sources, a clean-up filter is required to block nonpeak wavelength light emitted by the laser. The dichroic should be specific for the chosen laser and be able to reflect >90% of the respective wavelength. The emission filter must have an OD > 6 in the range that the clean-up filter has an OD < 3. When multiple lasers are used, care must be taken that each emission filter can completely block each laser. Some filters tend to have low ODs in regions a few hundred nanometers away from their transmission window.
3.2.4 Objective
For sufficient magnification and collection efficiency, high-NA objectives with 60× or 100× magnification should be used. A numerical aperture of at least 1.4 is required for objective-based total internal reflection (TIR) microscopy, which offers a much better SNR than conventional wide-field microscopy.
Related posts:
 Introduction: Nanoimaging Techniques in Biology
 Secondary Ion Mass Spectrometry Imaging of Biological Membranes at High Spatial Resolution
 Photoswitchable Fluorophores for Single-Molecule Localization Microscopy
 Functional AFM Imaging of Cellular Membranes Using Functionalized Tips
 Correlative Optical and Scanning Probe Microscopies for Mapping Interactions at Membranes
 Nanoimaging Cells Using Soft X-Ray Tomography
Stay updated, free articles. Join our Telegram channel

Full access? Get Clinical Tree


