The centers of the PSFs can also be determined by fitting them to 2D Gaussian distributions using a least-squares approach. This is computationally more intensive, and a number of solutions now exist to speed up the process.
Once the coordinates of the fluorescent molecules have been determined they must be displayed in the form of an image and analyzed. For display, each molecular coordinate is typically convolved with an artificial Gaussian PSF with a width equal to the localization precision. Recalling the Nyquist sampling criterion, it should be noted that the resolution of such an image not only depends on these precisions, but also on the density of localized molecules in the region of interest.
Quantitative analysis of the molecular coordinates often involves the search for and characterization of molecular clustering. Several statistical methods exist for such analysis of point-pattern data and one of the most commonly employed is Ripley’s K-function (8). This method has long been used in the analysis of spatial point-patterns derived from electron microscopy data and has recently been applied to coordinates derived from PALM and STORM experiments (9–11). A variation on this technique is Getis and Francklin’s L-function in which each molecule is assigned a value representing how clustered it is, rather than the analyzed region as a whole (12). This allows the generation of “cluster maps” from which various cluster parameters can be derived (10, 11).
To generate images with the highest possible signal to noise ratios, PALM is typically performed in fixed cells imaged under TIRF illumination which limits the excitation volume to within 100 nm of the coverslip. This affords the highest possible resolution as the number of collected photons can be maximized by increasing the integration time, the background from out of focus light is minimized and the recorded molecular density kept high by imaging very large numbers of raw frames. This does, however, remove dynamic information from the data set and only allows molecular coordinates to be determined in 2D.
Recently, PALM has begun to be applied in live cell systems and in three dimensions. For live cell imaging, the integration time is typically reduced to increase the frame rate. Despite the resulting degradation in spatial resolution, this has allowed dynamic processed to be observed with time resolutions from several seconds to a minute (13).
In terms of 3D PALM, a number of approaches have been developed with various degrees of resolution and imaging depth and range. One approach is Biplane PALM (14). Here, two different focal planes are imaged simultaneously and the appearance of the molecule in each can be used to determine its z-position. This has been used to generate a z-resolution of 75 nm over a range of 1 μm. Another approach involves the use of a cylindrical lens to introduce optical astigmatism which causes the imaged PSFs to be elliptical (15). The aspect ratio of the ellipse contains information on the z-position of the particle and has been demonstrated with 50 nm z-resolution over 600 nm. Other methods to extract depth information are iPALM and PSF engineering, which are more difficult to implement (16).
In this chapter we will give a protocol for the 2D super-resolution imaging and subsequent quantitative cluster analysis of molecular distributions in the plasma membrane of fixed HeLa cells. The biological system under investigation will be the photo-switchable fluorescent protein PS-CFP2 fused to the 10 amino acid N-terminus of the T cell protein kinase Lck and subsequently transfected into HeLa cells (Fig. 1 a, b). The 10 amino acid sequence is posttranslationally modified with three fatty acids. These serve to target the fusion protein to the cell plasma membrane and more specifically to highly ordered lipid domains (lipid rafts) (10, 17, 18). These lipid rafts are thought to regulate the clustering and dynamics of membrane proteins and exist on tens of nanometers length scales, being therefore, not resolvable by conventional fluorescence microscopes.
Fig. 1.
(a) Scheme of the photo-switching behavior of PS-CFP2. The protein is initially excited at 405 nm and fluoresces in the blue region of the spectrum. 405 nm irradiation causes switching to a green fluorescent form. (b) Scheme of the sample setup. PS-CFP2 is fused to the 10 amino acid N-terminal of Lck, which contains sites for three posttranslational lipid modifications that target the construct to the cell plasma membrane.
2 Materials
2.1 Reagents
1.
HeLa cells (American Type Culture Collection (ATCC)).
2.
Full DMEM media: DMEM, 10% FCS, 2% l-glutamine.
3.
Trypsin + EDTA.
4.
0.22 μm filtered phosphate buffered saline (PBS).
5.
Lipofectamine LTX and OptiMEM (Invitrogen).
6.
DNA plasmid (LckN10-PS-CFP2).
7.
100 nm diameter gold beads as fiducial markers.
8.
18 mm diameter Chamlide microscopy chamber (LCI Live Cell Instrument) and compatible #1.5 (0.17 mm) TIRF-suitable glass coverslips.
9.
16% paraformaldehyde solution. Dilute down to 4% using 1× DPBS.
2.2 Equipment
This chapter assumes the user is familiar with basic instrumentation for widefield and TIRF microscopy.
1.
An inverted TIRF microscope capable of simultaneous excitation at 405 and 488 nm. It is recommended these wavelengths be provided by diode-pumped, solid-state lasers (DPSSLs). The imaging laser (488 nm) should have an output power at least in the 50 mW range and be delivered to the microscope via a single-mode optical fiber. The microscope should have a sensitive, cooled EMCCD camera with at least 256 × 256 pixels and be capable of imaging frame rates in the 2–5 ms range. The total magnification of the system should be such that the camera pixel size at the sample plane is around 100 nm. PALM of PS-CFP2 requires dichroics and filters for detection of fluorescence in the range of approximately 500–600 nm while exciting at 405 nm and 488 nm simultaneously. A similar method can be employed for mEos2 if a 561 nm laser is available for imaging the converted form. The microscope should be fully enclosed inside a light-proof, temperature-controlled incubation chamber.
2.
Objective capable of TIRF illumination. TIRF requires a numerical aperture (NA) of at least 1.45 in order to generate the high angle rays that will be totally internally reflected from the sample. The lens will therefore be oil-immersion and have a magnification in the range of 60–100 times and is typically specially designed for TIRF excitation.
3.
Computer that can handle the large data sets and rapid data transfer rates—typical PALM datasets are around 5 GB in size. PALM processing and cluster analysis is computationally intensive so a powerful computer with Matlab (Mathworks Inc.) installed is recommended. A typical configuration is at least a 1 Tb hard—drive, 3 GHz quad—core processor and at least 16 GB of fast RAM.
3 Methods
3.1 Sample Preparation
1.
Add 2 μL Lipofectamine LTX reagent to 100 μL OptiMEM in an Eppendorf tube. Add 1 μg of plasmid DNA (typically this will be ∼1 μL in volume) to the mixture. Shake the tube and incubate at 37°C for 30 min (see Note 1).
2.
Meanwhile, discard media from cell culture flask and wash the HeLa cells with 10 mL of 1× DPBS. Add 1 mL of 1× Trypsin–EDTA solution and rock the flask gently. Incubate at 37°C for 5 min until the cells detach. Resuspend the cells in 10 mL fresh, full media (DMEM + 10% FCS + 2% l-Glutamine).
3.
Place TIRF suitable #1.5 (0.17 mm thickness) 18 mm diameter glass coverslips into a 12 well plate and wash three times with 0.22 μm filtered DPBS.
4.
Add 1 mL of cell suspension (∼ 0.5 × 10⁶ cells) to each well. Rock the plate gently to ensure an even distribution.
5.
Dropwise, add the Lipofectamine-OptiMEM-DNA solution to the well. Rock the plate gently to ensure an even distribution. Incubate for 24 h at 37°C in a 5% CO2 atmosphere.
6.
Remove the media from the well and discard. Wash the cells with 1× warm DPBS. Add 500 μL of 4% paraformaldehyde (PFA) in 1× DPBS. Incubate at 37°C for 15 min. Remove the PFA and wash three times with DPBS.
7.
Mount the coverslip in an 18 mm diameter Chamlide microscope chamber. Add 20 μL of 100 nm gold colloidal bead solution and leave for 2 min to settle. Gently add 300 μL of 0.22 μm filtered DPBS.
3.2 Microscope Setup and Data Acquisition
1.
Turn on all imaging equipment. Activate lasers at 405 and 488 nm. Set the camera (EMCCD) temperature to −60°C and the EM-gain to maximum (see Note 2).
2.
Place a drop of immersion oil on the objective and place the sample on the microscope stage. Use the brightfield lamp and the eye-pieces to locate and focus on the cells.
3.
Switch the detection channel to the camera. Using an integration time of 30 ms and 405 nm laser power of ∼10 mW (at the sample) locate a transfected cell and focus on the basal membrane. Ensure that several of the gold bead fiducials are visible in the same field of view (see Note 3).
4.
Switch the microscope to TIRF illumination mode, switch off the 405 nm laser, turn the excitation wavelength to 488 nm (typically ∼15 mW at the sample) and the detection band to the green range (using filters which still allow simultaneous excitation at 405 nm). Fluorescence should still be visible due to previous photo-conversion by the 405 nm laser but this should quickly bleach (see Note 4).
5.
Set the microscope to record a time series of roughly 15,000 frames and begin recording. Very few PSFs should be observed, which blink with a lifetime of just a few frames (see Note 5).
6.
Turn on the 405 nm laser at a very low power (<10 μW at the sample). The density of PSFs detected by the camera should increase. It is important to keep this density low such that there are very few overlapping PSFs.
7.
As the number of viable molecules is depleted over the course of the acquisition, it may be necessary to increase the power of the 405 nm converting later to increase the density of recorded PSFs. It may also be necessary to occasionally re-focus the microscope on the blinking molecules to compensate for drift (see Notes 6 and 7).
8.
Save the data in a format compatible with the available data processing software.
3.3 Data Analysis
1.
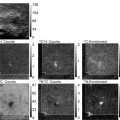
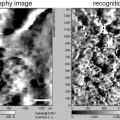
To detect single-molecule fluorescence events over background, calculate the center of these PSFs and, if possible, the precision of localization. There are now a number of different software packages available for obtaining single-molecule coordinates from time-series images. The following discussion gives some examples but is not exhaustive. A commercial PALM microscope is available from Zeiss (Elyra PS.1), which uses Zeiss Zen software to detect and centroid the PSFs. This has options to use the theory developed by Thompson et al. (7) and also full 2-D Gaussian fitting. This software also calculates the localization precision of the generated coordinates and can compensate for sample drift by tracking the immobile gold fiducials. Zen outputs a text file containing a list of the x and y coordinates and the precision of all detected molecules in the time-series. A freely available plug-in for ImageJ called QuickPALM is also available (19). This operates on a saved TIFF image sequence and outputs a list of the x and y coordinates in MS Excel format. New solutions are also being developed such as DAOSTORM which is capable of calculating molecular coordinates even if several PSFs overlap in any given frame as well as algorithms optimized for accuracy or speed (20–22) (see Note 8). Figure 2a, b show representative TIRF and PALM images respectively.
 Introduction: Nanoimaging Techniques in Biology
 Secondary Ion Mass Spectrometry Imaging of Biological Membranes at High Spatial Resolution
 Photoswitchable Fluorophores for Single-Molecule Localization Microscopy
 Functional AFM Imaging of Cellular Membranes Using Functionalized Tips
 Correlative Optical and Scanning Probe Microscopies for Mapping Interactions at Membranes
 Nanoimaging Cells Using Soft X-Ray Tomography


Related posts:
Introduction: Nanoimaging Techniques in Biology
Secondary Ion Mass Spectrometry Imaging of Biological Membranes at High Spatial Resolution
Photoswitchable Fluorophores for Single-Molecule Localization Microscopy
Functional AFM Imaging of Cellular Membranes Using Functionalized Tips
Correlative Optical and Scanning Probe Microscopies for Mapping Interactions at Membranes
Nanoimaging Cells Using Soft X-Ray Tomography
Stay updated, free articles. Join our Telegram channel
Full access? Get Clinical Tree
