Fig. 1.1
Exemplification of the pure stress (arrows) applied on the surface of a rectangular shaped homogeneous medium, which deforms it maintaining its volume. The blue line on the diagram represents the graphic correlation, whereas the red line depicts the modification related to the presence of an inhomogeneity within the same material
SS evaluation model: applying the same force but on a different direction (perpendicular to the former and on one edge) to the same imaginary rectangular-shaped model, the block will again modify its form without any volume variation. Once again images will be obtained at different times, previous and during material modification, and the presence of inclusions will perturb the graphical representation in the same way as explained before.

Fig. 1.2
Exemplification of a shear stress (arrow) applied on an edge of the rectangular shaped homogeneous medium deforms it maintaining its volume
In the purely elastic module described above, stress and strain are linked through the Hook’s law. The equation which explains this relation is  , where σ is the stress applied, E the YM, and ε = ΔL/L the longitudinal strain. The deformations occurring in human tissues are far more complex than what explained here, but these two ideal cases approximate the basis of the two imaging modalities: SS exemplifies ARFI imaging, whereas YM describes those produced by transducer compression.
, where σ is the stress applied, E the YM, and ε = ΔL/L the longitudinal strain. The deformations occurring in human tissues are far more complex than what explained here, but these two ideal cases approximate the basis of the two imaging modalities: SS exemplifies ARFI imaging, whereas YM describes those produced by transducer compression.1.1.2 Shear Wave Imaging
In SW imaging, a time-varying force is applied to the tissue. This force can be a limited transient mechanical force or a fixed frequency oscillatory one [3]. After wave generation two types of plane waves propagate independently in the material: SW and pressure waves (PW) [6]. PWs cannot be used in imaging due to the high wave speed which is orders of magnitude faster compared to the SW one [6]. Therefore, SW imaging is based on the propagation of SWs which propagate in the tissues perpendicularly to the ordinal pulse echo longitudinal waves.
SWs are slow transverse waves which attenuate rapidly compared to the diagnostic longitudinal waves and disappear in the MHz ultrasound band, with a propagation frequency below 1 KHz in vivo. Their velocity is 1000 times slower (i.e., c s = 1–10 m/s) compared to longitudinal waves (c L = 1540 m/s) [1, 5]. Maps of YM are derived from the SW propagation speed in order to display material stiffness. Due to the high water content, biological tissues are considered incompressible and, as a consequence, the YM is three times the shear modulus (![$$ E=2\left[v+1\right]\cdot G\approx 3G $$](http://radiologykey.com/wp-content/uploads/2017/06/A339375_1_En_1_Chapter_IEq2.gif) , where ν is the Poisson’s ratio which is equal to 0.5 in incompressible media and G is the shear modulus) [1, 3]. Another rudiment that a sonographer must kept in mind is that SW does not propagate in nonviscous pure fluid [5].
, where ν is the Poisson’s ratio which is equal to 0.5 in incompressible media and G is the shear modulus) [1, 3]. Another rudiment that a sonographer must kept in mind is that SW does not propagate in nonviscous pure fluid [5].
, where ν is the Poisson’s ratio which is equal to 0.5 in incompressible media and G is the shear modulus) [1, 3]. Another rudiment that a sonographer must kept in mind is that SW does not propagate in nonviscous pure fluid [5].When the free face of the rectangular shape described above is displaced repetitively, the behavior of the medium obeys to classic wave equation [6]. The displacement can occur at low and high frequencies. At low frequencies the response of the medium will peak at specific natural frequencies typical for each material. At high frequencies the response is different in biological tissues due to the irregular shape of organs and imperfect boundaries [6]. Therefore, in high frequencies of displacement imaging techniques, a multiharmonic excitation model, which will produce a uniform vibration without null point, is necessary [6]. The presence of an inhomogeneity within the medium produces a variation in the vibration pattern which is easily identifiable using multifrequency excitations [6].
All these physical theories and models allowed the development of multiple methods, which have been integrated in clinical practice:
- 1.
Strain elastography (SE)
- 2.
Transient elastography (TE)
- 3.
ARFI
- 4.
SW speed measurement and imaging
Strain elastography
Tissue displacement is produced by tissue compression with the probe. Since static compression is subjectively achieved, only strain (ε) is displayed; as a consequence, this type of imaging is only qualitative. Alternatively, pseudo-quantitative methods such as the strain ratio [7] or the comparison of lesion size to the size of the stiffer portion have been used [8].
Transient elastography
A controlled vibrating external piston (which acts as a “punch”) mounted on a probe with a fixed focal spot is used to either generate or evaluate the SW which has been produced. This type of SW quantification is used essentially by FibroScanTM to evaluate tissue stiffness.
ARFI
A focused acoustic radiation force “pushing” pulse is used to deform tissues within a defined region. The probe works as a generator of the push and to monitor tissue displacement sending an imaging pulse prior and after the push impulse. The evaluation of multiple beam lines allows the creation of an image, which displays the intrinsic differences of the tissue.
SW speed measurement and imaging
Using ARFI excitation SW are produced in a preselected point of the organ and then the centrifugal propagation of SW from the pushing pulse location is measured [2]. As previously described for ARFI, the probe generates the SW but also images its spread. The application of ARFI at multiple focal zone configuration, in which each one is interrogated in rapid succession, leads to a more complex tissue-SW interaction with a cylindrically shaped SW extending over a larger depth and enabling real-time SW imaging [2]. This multiple focal zone approach has been termed “supersonic shear imaging” (SSI) [9] .


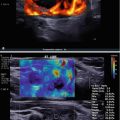
Fig. 1.3
An ARFI model in which the probe initially produces the push pulse (blue oval shaped figure) at a defined spot. After that the SW generated travel away from it. The probe is then switched to imaging modality and the progression of the SW is read at different times within a predefined area
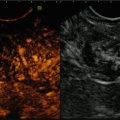
Fig. 1.4
The SSI produces different push pulse at various depths producing a cylindrically shaped SW extending over a larger depth. The high-frequency probe then permits a real-time SW imaging of large areas
1.1.3 Display Methods
Small lesion detection and also the discrimination of multiple discrete small lesions are the major concerns of elastographic imaging.
Strain imaging is now implemented in the majority of ultrasound equipment; however every manufacturer has its own method to measure the displacement, leading to differences in image characteristics (temporal and spatial resolution) and measurement conditions. Several methods are available to image tissue displacement:
- 1.
Spatial correlation method (or speckle tracking method) provides images by tracking the movement of image patterns [1, 2]. If the strain is extremely slight, patterns move while maintaining their speckle pattern. Therefore, setting a region of interest (ROI) and calculating the spatial correlation of the ROI before and after compression, the quantity of movement is easily calculated [1, 2]. This is the simplest method to measure the 1 direction (D) displacement along the beam axis. In reality, a thorough definition of tissue displacement needs a 2D search, both in the range and in the azimuthal direction, due to the movement that each ROI covers in azimuthal direction in the cross section [1, 2]. The advantages of the speckle tracking method are the ability to measure large displacement, even the one that exceeds the wavelength, and the capability of tracking the ROI movement in 2D and in 3D. On the other hand, this technique has drawbacks as the noise effect susceptibility and the lost of real-time capability when the calculation of correlation requires enormous computational power [1, 2]. In addition the accuracy of this method is limited when the speckle patterns are not clear.
- 2.
Phase difference detection method uses the same technique of color Doppler and tissue Doppler [10]. The phase difference of echo signals created by transmitting repeated pulse is received by an autocorrelation method, which permits the displacement calculation [1, 2]. An excellent real-time capability and the relative robustness to noise are the main advantages of the Doppler methods. Conversely the disadvantages are the capability to measure the only 1D displacement in the beam direction due to the angle dependence and moreover the aliasing errors which may occur measuring a large displacement that exceeds half the wavelength [1, 2].Related posts:

Stay updated, free articles. Join our Telegram channel

Full access? Get Clinical Tree