Type of criteria
Criterion
Imaging
Major
Active inflammation
CE-MRI, USPIO-MRI, FDG-PET
Thin FC with large LRNC
MRI, CE-MRI, CT
FC disruption
MRI, CE-MRI, SPECT
Severe stenosis
MRA, CTA, B-mode ultrasonography
Minor
IPH
MRI, CT
Expansive remodeling
MRI
Superficial calcified nodules
MRI, CT
Endothelial dysfunction
–
Various underlying mechanisms which can cause mechanical failure of the fibrous cap, leading to plaque rupture, have been suggested, including biomechanical stress [13–15], hemorrhage within the plaque [10, 16, 17], inflammation within the plaque with an influx of macrophages [18–20], destruction of the fibrous cap by proteolytic enzymes such as matrix metalloproteinases (MMPs) [21], and apoptotic cell death of fibrous cap fibroblasts [18–20].
PET Imaging of the Vulnerable Plaque
PET and SPECT studies allow for the analysis of atherosclerotic plaque composition by imaging the inflammatory process, apoptosis, and metabolism of lipids.
The risk of plaque rupture and thrombus formation depends not only on the thickness of the fibrous cap surrounding the plaque, but also on the composition/state, e.g., the presence of lipid and the inflammation initiated by macrophages [8–11]. The inflammatory process is linked to plaque instability and the risk of acute vascular events. Among the effects, inflammation leads to enzymatic damage and subsequent rupture of the fibrous cap.
Due to the active inflammation, macrophages are of interest in monitoring atherosclerosis. They have a significant glycolytic activity, which can be imaged in PET after the administration of 18FDG [22]. 18FDG is a glucose analog, which is carried by the same transport mechanisms, and is subsequently transformed in the Krebs cycle, taking part in the first step, phosphorylation, only. As a result, the uptake of 18FDG is directly proportional to the glucose transport mechanisms and the activity of hexokinase and therefore the metabolic activity of the tissue.
18F-FDG-PET studies were introduced into clinical practice over 20 years ago and are most commonly used to evaluate neoplastic and inflammatory diseases. Tawakol et al. showed that the degree of 18FDG uptake strictly correlates with the presence of macrophages in the plaque (Fig. 1) [22]. The technique potentially allows for diagnosis of inflammatory vascular lesions, as well as treatment monitoring.
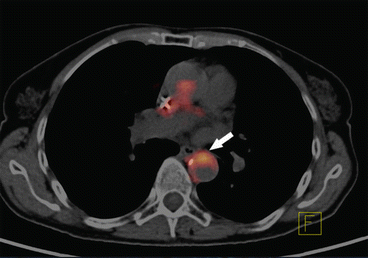

Fig. 1
18FDG-PET/CT of the thoracic aorta. Accumulation of 18FDG in the aortic wall (white arrow) signifies an active inflammatory process in the atherosclerotic plaque
PET has greatly improved after the introduction of hybrid PET/CT [23]. The CT imaging allows for an analysis of density of the surrounding tissue, which is then used to correct the attenuation phenomenon. The second advantage of this technique is image fusion from the two modalities, allowing good anatomical correlation, some assessment of plaque structure, as well as information on the metabolic activity. PET also allows for the evaluation of structures in multiple vascular territories at once, which is advantageous in this systemic disease. Studies have shown that inflammatory changes in atherosclerotic plaques are located diffusely throughout the vascular system. If a plaque is demonstrated to have inflammatory changes, it is common for the morphological changes to be present in other plaques to a similar degree. The presence of a plaque in one carotid artery is often connected with a contralateral, but is more commonly associated with plaques located within the same anatomical area. It has been shown that the uptake of 18FDG in atherosclerotic plaques does not correlate with the degree of calcification. This suggests that calcification is the final step in the disease process and is a more stable state. This observation shows the potential role of functional studies in disease work-up. The systemic nature of the disease can also be determined as illustrated with the increased 18FDG uptake in the area of atherosclerotic carotid plaques of patients who have had a previous myocardial infarction and a higher concentration of serum inflammatory markers (including matrix metalloproteinase (MMP 3 and MMP 9) and C-reactive protein (CRP)).
PET/CT allows for the evaluation of the effectiveness of new generation drugs, which reduce plaque inflammation in some way, by examining their effect on plaque stabilization. Tahara et al. [24] studied the effect of simvastatin on the degree of 18FDG uptake in atherosclerotic plaques in two patient groups: those treated with simvastatin vs. low-cholesterol diet alone (overall population 43 patients). Measuring the 18FDG uptake values before treatment and at 3 months, the18F-FDG uptake in atherosclerotic plaque was markedly smaller in patients treated with simvastatin compared to diet alone, with an added correlation of decreased 18FDG uptake with higher high-density lipoprotein (HDL) levels. Lee et al. [25] established that PET allows for objective conclusions of the effect of lifestyle on disease progression. Prior to the observational period, 362 anatomical areas with increased 18FDG uptake were identified in a cohort of 60 patients. After 17 months the number of areas of increased uptake reduced to 124. The authors also evaluated the whole body 18FDG index. After lifestyle changes, the index decreased from 1.39 to 0.53, which correlated with a decreased total and low-density lipoprotein (LDL) cholesterol concentration. This data illustrates that PET is a useful tool in the study of disease progression, as well as the effectiveness of drugs and lifestyle modification in progression. Fayad et al. [26] used 18FDG-PET/CT combined with MR to study the effect of dalcetrapib on plaque morphology. Dalcetrapib modulates cholesteryl ester transfer protein (CETP) activity to raise HDL cholesterol. The authors were able to demonstrate that PET as well as MRI are acceptable techniques to evaluate drug effectiveness. Furthermore, they have shown that dalcetrapib acts positively on the structure and functional parameters of vessel wall plaques.
Cardiac
Patients with a myocardial infarction do not always demonstrate significant coronary stenosis. However, histological assessment of plaques has often demonstrated features of instability, suggesting that modalities, such as PET, may be helpful in identifying this cohort of patients. A limitation to this method in coronary imaging is the physiological high uptake of 18FDG in myocardial tissue. If the patient was well prepared, with a low-carbohydrate, high-fat meal, myocardial suppression of 18FDG uptake was enhanced allowing for proper evaluation of atherosclerotic plaques in coronary arteries. Wykrzykowska et al. [27] used the diet patient preparation before a PET study, which was correlated to coronary angiography and the results suggested that increased 18FDG uptake matched disease identified on angiography, although the results were not significant in this small study (15 patients had 18FDG-positive coronary vessels).
MRI and the Vulnerable Plaque
MRI is as an established imaging modality for plaque morphology and stenosis evaluation. The technique does not require ionizing radiation, provides high-resolution images, and using multiple sequences can evaluate disease characteristics. The use of different sequences allows for evaluation of plaque structure [28], without the need of intravenous contrast, although this further enhances the technique [29, 30]. It is possible to assess the fibrous cap, lipid-rich necrotic core, or possible intraplaque hemorrhage. In contrast, calcification may be more difficult to analyze.
Plaque Hemorrhage
One of the most common risk factors correlating with a high risk of clinical sequelae is plaque hemorrhage [31, 32]. The reason of bleeding is unclear, but most probably it is caused by fragile neovessels within the plaque [33, 34]. Without proper smooth muscle cell support and with a leaky endothelium it is common for them to rupture and cause a hemorrhage [35, 36]. Bleeding causes an increase in size of the plaque, with extravasated blood having a pro-inflammatory effect, leading to accumulation of macrophages which produce proteases, and a positive feedback loop is created of inflammation and neovascularization [33, 34]. This in turn causes degradation of the fibrous cap. MRI allows for the identification of methemoglobin (which can be used as an endogenous contrast for MRI imaging), among other hemorrhage types, in the area of an atherosclerotic plaque. Methemoglobin has paramagnetic properties and is best identified with a high signal on T1-weighted (T1 W) images. This phenomenon has a high sensitivity and specificity for identifying recent intraplaque hemorrhage [37, 38]. High signal on both spin echo and time-of-flight (TOF) gradient echo T1-weighted images were noted by Yuan et al. [39]. MR imaging with T1-weighted/TOF and T2-weighted/proton density (PD)-weighted sequences can now be used to date the intraplaque hemorrhage (Table 2) [36, 40]. Moody et al. proposed an MR sequence used for direct thrombus imaging—magnetization-prepared rapid acquisition with gradient echo (MP-RAGE)—to image lower-limb deep venous thrombosis [41], which was later modified for plaque imaging, providing sensitive but low-resolution imaging of plaque hemorrhage [42].
Table 2
Stages of intraplaque hemorrhage
Stage of hemorrhage | Characteristics | ||
|---|---|---|---|
Histology | MRI | ||
T1W/TOF | T2W/PDw | ||
Fresh (Type I) | Intact RBC with intracellular methemoglobin | Hyperintense | Isointense |
Recent (Type II) | Lytic RBC with extracellular methemoglobin | Hyperintense | Hyperintense |
Old | Amorphemosid | Hypointense | Hypointense |
The concurrent use of angio-MR (MRA) and plaque analysis is also being developed. Yoo et al. used the maximum intensity projection (MIP) of TOF MRA showing the presence of juxtaluminal hyperintensities indicating plaque hemorrhage [43]. Another imaging method that has been applied is based on phase-sensitive reconstruction of an inversion recovery (IR)-prepared sequence that is timed to produce strongly negative signals in the vessel lumen and strongly positive signals in the vulnerable plaque. One of the difficulties in combining angiography and plaque morphology imaging has been getting good angiographic coverage; for clinical purposes carotid angiography is performed from the aortic arch to the circle of Willis while most plaque imaging is performed with dedicated high-resolution coils over the carotid bifurcation providing great detail of the plaque but limited angiographic coverage if the coil is not changed for a more standard array.
The assessment of intraluminal bleeding, also known as juxtaluminal hemorrhage, is an important sign of plaque vulnerability. This has mostly been studied in small patient groups, but they provide a strong indication of the importance of this feature. Takaya et al. [12] showed that the presence of juxtaluminal hemorrhage is associated with a cerebral infarction in 67 % of non-symptomatic patients with 50–79 % carotid artery stenosis.
Plaque Morphology
Another factor determining the development of complications is the size (and volume) of a plaque.
Arterial expansive remodeling is a process whereby growth of the plaque is not reflected in the narrowing of the arterial lumen [5]. This process has been implicated in plaque vulnerability by disguising large lesions [44, 45]. Such lesions may not manifest themselves in angiography, despite extensive atherosclerotic changes. Numerous studies confirm that there are no clear relationship between the size of a plaque and the degree of vessel stenosis [46]. Volume assessment of a vulnerable plaque is difficult to image well. MRI is a potentially useful method for assessment of the extent of this phenomenon as it allows for simultaneous imaging of both the arterial lumen and wall [47, 48]. The most frequently used sequences are black-blood fast spin echo sequences [44, 47, 49, 50]. Corti et al. [49, 51] studied the effects of simvastatin lipid-lowering therapy on human atherosclerotic lesions (aortic and carotid lesions) demonstrated by changes in both vessel wall thickness (VWT) and vessel wall area (VWA), which are often used as surrogate markers of expansive remodeling. Reductions in both parameters were statistically significant at 12, 18, and 24 months after initiation of the treatment regime.
There are however limitations to MRI for measuring these parameters. Artifacts associated with blood flow and the partial volume effect due to an obliquity of the vessel wall can reduce the accuracy of defining the boundaries of the vessel wall. When using inflow-dependent blood suppression techniques errors are encountered when there is slow or recirculating flow within the imaging slab, which may be as high as 50 %. New imaging methods for inflow-independent blood suppression and 3D imaging to minimize partial volume effects are implemented. 3D sequences additionally improved signal-to-noise ratios, increased longitudinal coverage, improved resolution especially in the through-plane direction, and provided greater acquisition efficiency. The through-plane resolution is important because volumes need to be calculated with larger slice thicknesses making the results less accurate.
To assess the plaque burden it is necessary to accurately define the external and internal walls of the vessel wall; traditionally this has been done by an experienced observed, but a number of software packages have been developed to automate this time-consuming task [52].
Fibrous Cap and Lipid-Rich Necrotic Core
Fibrous cap thickness and lipid-rich necrotic core size are two most readily available parameters from high-resolution MRI, which potentially may give additional information regarding the stability of a carotid atheromatous plaque (Fig. 2) [53, 54]. Mostly histological studies have shown that one of the most common phenotypes of plaques prone to rupture is a thin fibrous cap overlying a large lipid-rich necrotic core [6, 9, 10, 55]. Sequences used to image the FC and LRNC rely on the ability of cholesterol esters, which are the predominant component of lipid-rich necrotic core to shorten T2 relaxation time.
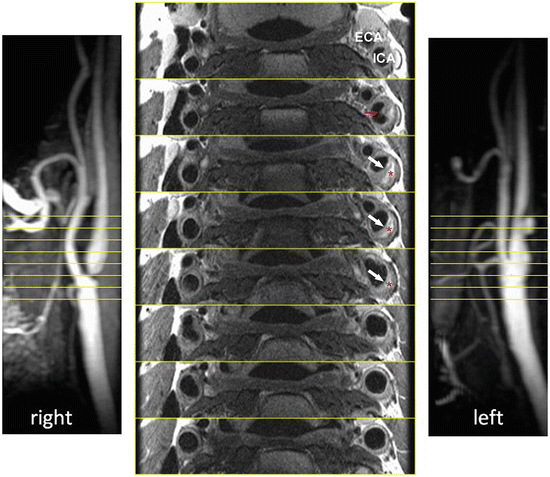

Fig. 2
Plaque morphology. Sequential images of an atherosclerotic plaque within the left internal carotid artery. The typical morphological components are seen, including the lipid-rich necrotic core (red asterisk), the fibrous cap (white arrow), and a possible site of ulceration (red arrow). ECA—external carotid artery; ICA—internal carotid artery
The result is a hypointense area on T2W images representing lipid-rich necrotic core. High intraobserver agreement was noted for the identification of lipid-rich necrotic core and moderate agreement for fibrous cap. Furthermore the accuracy of feature identification on imaging was validated against histology with good results. Hatsukami et al. [56] performed an analysis of the ability of high-resolution MRI to distinguish between differences in fibrous cap thickness and rupture. They used 3D multiple overlapping thin-slab angiography (MOTSA) sequence to identify thick, thin, and ruptured plaques. Results showed an 89 % agreement with histological assessment. Trivedi et al. [57] performed a study of carotid plaque composition with emphasis on depicting lipid-rich necrotic core and fibrous cap (n = 40) using 2D, blood-suppressed, fast spin echo, T2W MRI sequences. A high interobserver agreement was reported between subsequent MRI measurements as well as between MRI and histology. Cai et al. [53] used CE-MRI to measure the dimensions of fibrous cap and lipid-rich necrotic core in intact plaques. Sequences included DIR T1W, TOF, and proton density-weighted (PDw). Measurements obtained from CE-MRI were compared with those from T2 W MRI and histological findings. A good correlation with histology of both measures (fibrous cap and lipid-rich necrotic core) was observed.
It has been shown in prospective studies that plaque ulceration and thrombosis are more common in patients who are symptomatic [58, 59]. In symptomatic patients, a minimum cap thickness under 200 microns was associated with an odds ratio of 5.0 for the presence of fibrous cap rupture [60]. Studies on case series have shown that it is possible to identify fibrous cap disruption of carotid plaques using multisequence MRI with black- and bright-blood sequences [61]. It has to be noted, though, that the histological definition of a thin FC (<250 microns [56]) is below the spatial resolution of conventional MRI. Therefore the plaque can be classified as [17]:
Thick fibrous cap—fibrous cap is clearly visible on contrast-enhanced (CE)-T1W as being between the LRNC and the vessel lumen.
Thin fibrous cap—fibrous cap not evident on CE-T1W as being between the LRNC and the vessel lumen.
Ruptured fibrous cap—fibrous cap absent on all imaging sequences.
Superficial calcified nodules were first reported in coronary arteries, and then subsequently in carotid arteries as well [6]. In the classification of atherosclerotic lesions proposed by the American Heart Association (AHA), plaques with superficial calcifications are classified as lesions Type Vb [56]. Later in a modification to the AHA classification [6] these lesions have been classified as a “calcified nodule” and described as an eruptive nodular calcification with underlying fibrocalcific plaque. The second element is calcification—calcified nodules protruding into the lumen can lead to thrombus formation [73]. Calcified nodules are distinguished from most plaque calcifications, which are separated from the lumen by fibrous tissue and may be indicative of stable lesions [62]. An in vivo MRI study on 123 patients was able to visualize, using fast spin echo multi-contrast imaging, calcifications with a sensitivity of 76 %, specificity of 86 %, and a good intraobserver agreement [55]. However, this analysis was performed without regard to the location of calcified nodules. Juxtaluminal nodules, which are associated with a greater risk of rupture however, are more difficult to visualize than those located deeper within the plaque because they appear as a hypointense signal on T1W, T2W and TOF images and are not easily distinguishable from the lumen. This limitation, however, can be overcome by an addition of bright-blood sequences to the imaging, making the hypointense calcification clearly different from the hyperintense signal of blood on TOF [63].
Recently Underhill et al. [17] proposed a risk assessment system for patients with carotid atheroma based solely on MRI characteristics. The system was designed to aid in objective and uniform, noninvasive stratification of patients’ risk arising from their plaque burden. Additionally the authors aimed to define features of carotid plaques, which may precede the development of fibrous cap rupture and plaque hemorrhage. The classification system was named the Carotid Atherosclerosis Score (CAS) (Fig. 3). Despite being histologically validated, CAS was based on cross-sectional data and will need to undergo a series of prospective studies in order to compare its predictive value against the degree of stenosis seen on angiography.
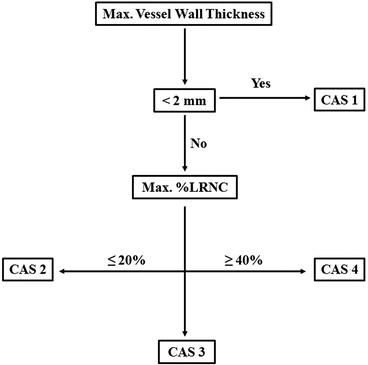

Fig. 3
Carotid atherosclerosis score. CAS 1: low risk; CAS 2: medium-low risk; CAS 3: low-high risk; CAS 4: high-risk plaques. Max % LRNC-maximum percentage of plaque wall occupied by LRNC. Adapted from Underhill et al. [17]. LRNC—lipid-rich necrotic core
Table 3 presents the summary of the various characteristics of carotid plaques and the MRI sequences best used for their evaluation.
Table 3


MRI characteristics of carotid plaques
Stay updated, free articles. Join our Telegram channel

Full access? Get Clinical Tree


