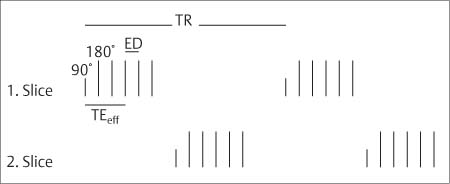
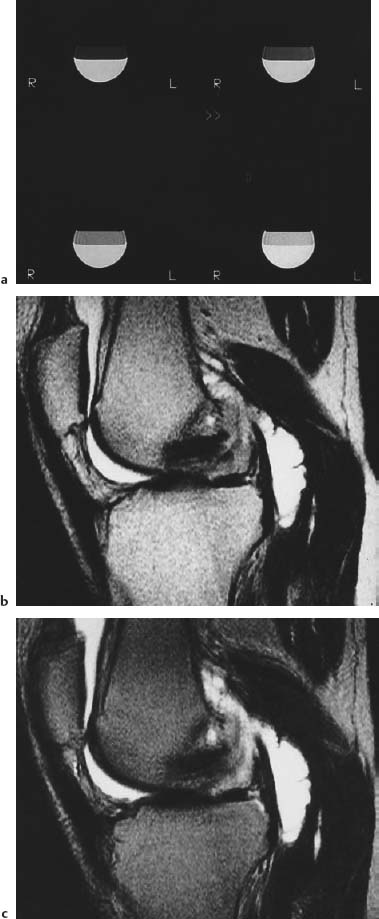
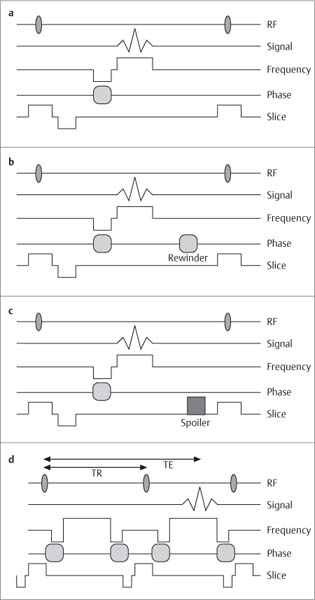
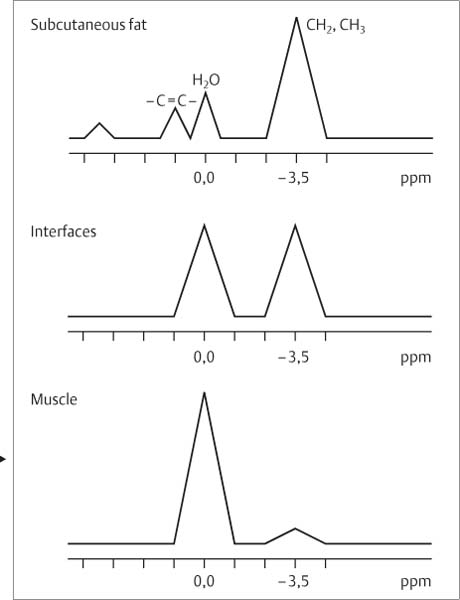
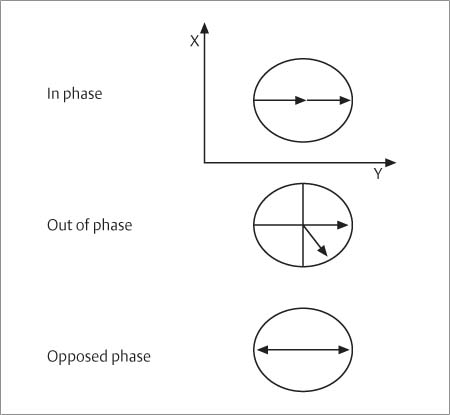
1 Technology of Magnetic Resonance Imaging This chapter will present the fundamental physics underlying the techniques used for magnetic resonance imaging (MRI) as applied to the musculoskeletal system. The discussion will be clinically oriented and focused on how the different techniques affect image contrast, signal-to-noise ratio, application and practicality. Readers who wish to learn more about the physics and techniques of imaging with magnetic resonance should refer to the appropriate literature. To produce a magnetic resonance signal, the patient is placed in a strong external magnetic field (Bo). This outer magnetic field aligns the tissue’s protons, which can be pictured as small magnets with their magnetic fields randomly oriented, parallel to the strong field (longitudinal magnetization Mz). When a suitable high frequency pulse (90 degree pulse) is applied, the magnetic fields of the protons change their orientation, with the change measurable as so-called transverse magnetization (Mxy). After the high frequency (radio frequency [RF]) pulse is turned off, the magnetic fields of the protons return to their original orientation parallel to the outer magnetic field. The transverse magnetization rapidly decays (free induction decay, FID) at a rate dependent on the homogeneity of the external magnetic field and on the tissue itself. This time for decay is given by the constant T2* (star) known as the effective T2 time. Because of the rapid decay, measurement of the signal can only be made for a short time. To resolve this, further suitable RF pulses (180 degree pulses) can be applied producing additional signals. These are known as spin echoes (SE) and can be thought of as echoes of the original signal. They gradually decrease in intensity with time and the time constant for this decay is called the spin–spin or T2 relaxation time. This decay is no longer dependent on external magnetic field heterogeneities and reflects only the intrinsic properties of the tissue being imaged. A second parameter characteristic to each tissue is the time for longitudinal magnetization to return after the 90 degree pulse has been applied. This is given by the T1 time constant and the time is referred to as the spin-lattice or T1 relaxation time. The final signal intensity detected by the MRI scanner is determined both by the T1 and T2 relaxation times, and also by the number of mobile protons present in the tissue. This third characteristic is known as the proton density. To determine the spatial position of any unit (voxel) of tissue from which the signal is received, linear magnetic gradients are applied along the three axes. These are known as the slice, frequency, and phase-encoding gradients, and spatially encode the signal from each voxel with a characteristic frequency and phase. This spatial encoding assigns the magnetic resonance signal its spatial location, ultimately leading to the formation of a gray scale matrix. The gray scale position of each pixel is based on the signal intensity received from each voxel. The contribution made by these three factors to the image is determined by the parameters selected by the operator. In a T1-weighted sequence, for instance, the parameters are selected to emphasize the differences in T1 relaxation time between the different tissues being studied. The choice of sequences performed depends on the clinical question being asked. The two most important parameters varied to alter the contrast weighting are the repetition time (the time between 90 degree pulses [TR]) and the echo time (the time between the 90 degree pulse and the detection of the spin echo [TE]). T1-weighted SE sequences have a repetition time shorter than the T1 relaxation time of the tissue (TR < 700 ms) and a short echo time (TE < 20 ms). They are the basis of MR imaging of the connective tissue and musculoskeletal system. Fat and paramagnetic substances, such as some breakdown products of blood, exhibit a high signal intensity, muscles and most pathologic processes an intermediate signal intensity, and cortical bone and calcifications a low signal intensity. This sequence is less susceptible to artifacts and possesses a high signal-to-noise ratio. It is a helpful sequence for anatomical orientation and proves particularly useful for the identification of fat and hematoma. A T1-weighted SE image should be part of any examination protocol. Proton density-weighted SE sequences have a repetition time much longer than the T1 relaxation time (TR < 1800 – 3000 ms) and a short echo time (TE 10 – 20 ms). These sequences are less important in MR imaging of the connective tissue and musculoskeletal system. T2-weighted SE sequences are produced by long T1 relaxation times (TR < 1800 – 3000 ms) and long echo times (TE 80 – 120 ms). Fat and muscle are less signal intense than on T1-weighted images. In contrast, fluid and most pathologic changes are of high signal intensity. Initially, this was the most important sequence for depicting pathologic changes. T2 sequences are particularly susceptible to artifacts induced by motion or pulsation and are very time consuming. Today, essentially T2-weighted images can be attained with other less time intensive techniques, such as fast (or turbo) spin-echo sequences and gradient echo sequences. These advanced imaging techniques have largely displaced the conventional SE sequences and will be described in more detail. Fast spin echo sequences have evolved from rapid acquisitions with relaxation enhancement (RARE) (16) and from multiple-echo multiple-shot sequences (MEMS) (22). They are essentially SE sequences with multiple spin echoes within the repetition time (TR interval), creating the echoes by an echo train of 180 degree pulses (Fig. 1.1). These are based on standard spin-echo sequences, but multiple echoes are obtained by the application of a train of 180 degree pulses within a single repetition time. Each echo is then separately phase encoded so multiple data for the spatial encoding process can be acquired in a single TR. In comparison to conventional SE sequences, the acquisition time is reduced by a factor corresponding to the number of 180 degree pulses per excitation (echo train length [ETL], turbo factor [TF]). The distance between the echo pulses is referred to as echo spacing (ES). While the echo train length can be arbitrarily selected between 3 to 128, an echo train length of 3 to 16 is characteristically used for examinations of the connective tissue and musculoskeletal system. The image contrast is determined by the echoes of the low order phase encoding, expressed as effective echo time. The maximum echo train length (achieving the shortest acquisition time) is not feasible for all examinations. In bone marrow imaging, for instance, the fat signal can become unusually intense in comparison with conventional SE sequences because of spin coupling, effective rephasing and magnetization transfer effects. This phenomenon is more pronounced with shorter echo spacing and a low magnetic field strength. The time saved by the shortened acquisition time of fast echo sequences can also be used to improve resolution or signal-to-noise ratio, or both, while maintaining an acceptable acquisition time. Using conventional sequences, comparable images can only be achieved with relatively long acquisition times (25 minutes and more). Fig. 1.1 Simplified scheme of the TSE sequence. Several echos of constant distance are produced by 180 degree impulses during the repetition time interval after the 90 degree pulse. The echo time determining the contrast is in the middle of the echo train and is referred to as effective echo time. By using the multi-slice technique, several slices can be interrogated at different times (for instance, two slice cases as illustrated here). ED = echo distance TR = repetition interval TEeff = effective echo time The fast spin-echo sequence images have a few peculiarities that are relevant to the musculoskeletal system. Fat appears bright on fast echo sequence images compared with conventional SE. This can interfere with the detection of pathological processes in the immediate vicinity of fatty tissue, primarily in the extremities. Depending on the clinical question, this potentially undesirable side effect can be ameliorated by shortening the echo train length, with correspondingly less time saving, or by frequency-selective fat suppression (47) (Fig. 1.2). Another aspect of fast spin-echo sequences is the decreased sensitivity to susceptibility effects and, especially with a high echo train length, some blurring (rippling) of the images (43). Fast spin-echo sequences showed good results in musculoskeletal MR imaging in a comparison with conventional spin-echo sequences (50), and fast SE sequences, particularly when combined with fat suppression techniques, are now widely used in place of conventional T2 SE sequences. Rather than using 180 degree rephasing pulses, the gradient-echo sequence produces the image-forming signal by gradient reversal. Furthermore, reducing the flip angles can change the image contrast. Three parameters must be considered in gradient-echo imaging: repetition time, echo time, and flip angle. Gradient-echo sequences permit markedly shorter acquisition times than spin-echo techniques. Gradient echo sequences employ rephasing gradients in place of the 180 degree rephasing pulses that are used in spin echo imaging. In addition flip angles of less than 90 degrees are used. These two factors allow the use of shorter TRs than are possible with spin-echo imaging, and result in shorter image acquisition times. Fig. 1.2a–c a TSE sequences of a fat-water phantom with TR = 3000, TEeff = 100 msec. Fat above, NaCl solution below. Same window setting. Left above ETL = 3, right above ETL = 6, left below ETL = 9, right below ETL = 12. The signal intensity clearly increases with increasing ETL. b The TSE sequence of the knee with TR = 3000 msec, TEeff = 100, ETL = 12. c ETL = 3, same window setting. Large Baker cyst, joint effusion. With an ETL of 3, the fluid-to-fat contrast is higher. ETL = echo train length (number of echoes) Fig. 1.3a–d Scheme of four basic GRE sequences. a Simple GRE sequence. b Steady state GRE. c Spoiled GRE. d Contrast enhanced GRE. The upper line represents the excitation radiofrequency, the second line the corresponding received signal, the third line the frequency encoding gradient and fifth line the slice gradient. RF = radiofrequency pulse TE = echo time TR = repetition time interval Four GRE techniques can be distinguished (7) (Fig. 1.3): The most basic gradient echo technique (Fig. 1.3a) fundamentally corresponds to a SE sequence, except for the missing 180-degree rephasing pulse. This is one of the earliest techniques and is degraded by many artifacts. It is rarely used today. The steady-state GRE sequences (Fig. 1.3b) produce a steady state of longitudinal and transverse magnetization of the tissue. This steady state is maintained through the application of a so-called rewinder gradient. Image contrast depends on the ratio or mixed weighting of the T2 and T1 relaxation times. This only applies to intermediate flip angles (10 – 40 degrees), short repetition times (< 250 msec) and short echo times (< 18 msec). The image contrast for small flip angles (< 5 degrees) has a proton density weighting regardless of the GRE technique used. A large flip angle (> 40 degrees) results in a dominant T2 weighting and long echo times in T2* weighting (effective T2), producing a contrast proportional to free induction decay (FID). The spoiled GRE technique is based on the destruction of the residual transverse magnetization by a so-called spoiler gradient or high frequency pulse (Fig. 1.3c). Since the transverse magnetization does not reach a steady state, the tissue contrast depends on T1 relaxation time and produces a T1-weighted image. With extreme flip angles or long echo times, the above mentioned factors do have an effect on image weighting. With a long TR (> 250 msec) complete dephasing of transverse spins can occur (TR is now longer than T2) eliminating the need for a spoiler gradient. The contrast-enhanced GRE technique samples the echo that is induced by the second 90 degree RF pulse within an acquisition sequence. It is basically a spin echo (SE), but with the difference that no separate 180 degree RF pulse is applied and a gradient reversal is used instead. The nominal echo time of this technique is longer than its repetition time. Because of the strong T2 contrast, the term contrast-enhanced GRE was given to this sequence (Fig. 1.3d). Since this technique passes over late spin echo, its signal-to-noise ratio (SNR) is low. The contrast-enhanced GRE technique has not proved useful in routine applications. Table 1.1 shows a summary of the image contrast of the different gradient-echo sequence techniques. Different manufacturers use their own nomenclature. The most important acronyms are listed in Table 1.2. A common feature of all GRE sequences is that, in contrast to the SE sequences, the gradient rephasing of the signal serves to correct phase shifts induced by the gradient itself. This contributes to the image contrast. In particular, it increases the expression of susceptibility artifacts with longer echo times as well as the sensitivity to the different phase encoding of fat and water protons. The difference in the phases of fat and water is based on the difference between the resonance frequency of these signal components (Fig. 1.4). The phase of the particular component depends on the echo time and, depending on the relative phase of the two components, an image can be in-phase, out-of-phase or in opposed-phase, with adding of the in-phase and subtraction of the opposed-phase signal intensities (Fig. 1.5). Pixels containing a certain ratio of fat and water protons exhibit oscillating signal intensities related to the echo times. A 1: 1 ratio and an echo time in opposed-phase can extinguish the signal, referred to as etching artifact or chemical shift of the second kind. The oscillation period between in-phase and opposed-phase echo times is proportionate to the difference between the resonance frequency Δf of fat and water (3.2 – 3.5 ppm) and therefore also depends on the magnetic field strength (period in msec = 1000/Δf). The oscillation period is about: • 19.7 msec for 0.35 T (Δf ≊ 51 Hz) • 13.8 msec for 0.5 T (Δf ≊ 72 Hz) • 6.9 msec for 1.0 T (Δf ≊ 144 Hz) • 4.6 msec for 1.5 T (Δf ≊ 271 Hz).
Introduction
Spin-Echo (SE) Sequences
 T1-weighted Sequences
 Proton Density-weighted Sequences
 T2-weighted Sequences
Fast (or Turbo) Spin Echo (TSE) Sequences, RARE
Gradient-Echo (GRE) Sequences
Rho | small flip angle |
T1 | large flip angle |
T2 | CE-GRE |
Mixed (T2/T1) | steady state with short TE |
T2* | long TE |
Rho = proton density
T1 = T1 relaxation time
T2 = T2 relaxation time
Mixed = contrast depending on T2/T1
T2* = effective T2 relaxation time
TE = echo time
CE-GRE = contrast-enhanced GRE
With longer echo times, the oscillation period for fat and other composite tissues increasingly deviates from the theoretical values of the dual water–methylene complex since these tissues have additional resonance peaks (e.g., protons adjacent to double bindings, methylene and carboxyl groups) that can lead to inaccuracies (Fig. 1.6). For this reason, different MR units have to be calibrated individually for optimal opposed-phase echo times.
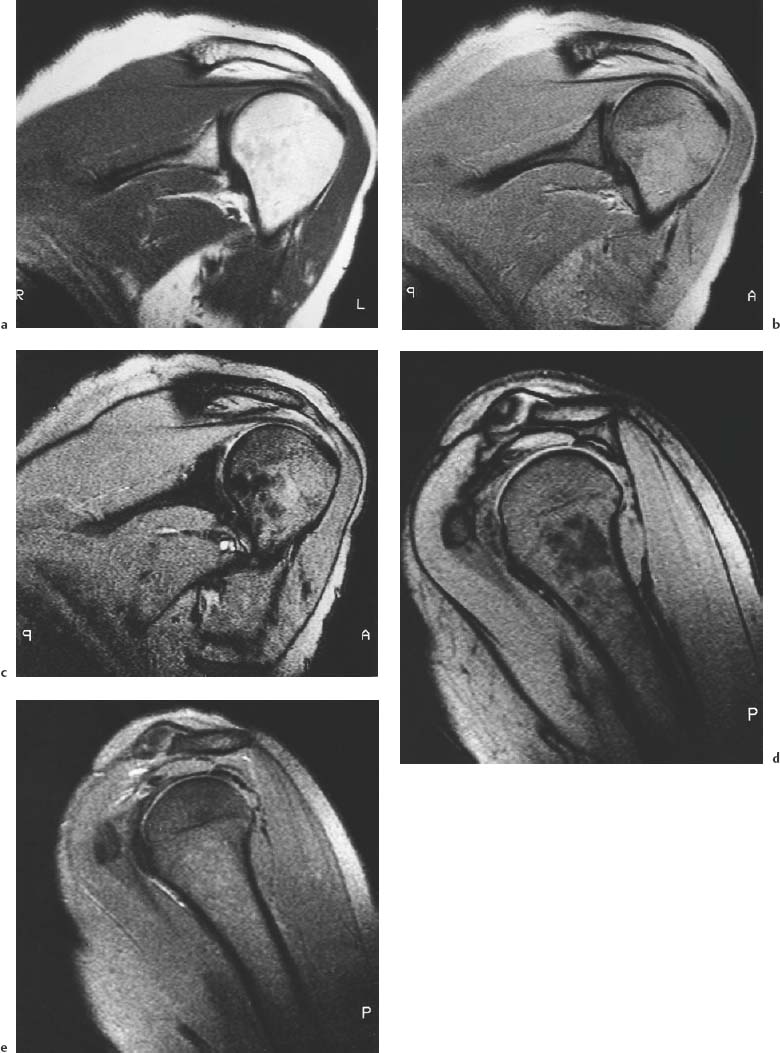
Opposed-phase GRE-images are highly sensitive to visualizing hematopoietic bone marrow (20) and pathologic bone marrow lesions (Fig. 1.7).
Because of the high signal intensity, steady-state GRE sequences have proved useful for the acquisition of three-dimensional data sets with subsequent multi-planar reformatting, especially for the evaluation of joints. Spoiled GRE with short repetition times (TR = 40 – 50 msec), short echo times (TE = 5 – 10 msec) and intermediate flip angle (θ = 30 – 60 degree) combined with fat suppression is useful for visualizing cartilage. Spoiled or steady-state GRE sequences with long repetition times (TR = 450 – 600 msec), two echo times (short in-phase echo, long out-of phase echo) and medium flip angle (θ = 25 – 30 degree) have generally proved useful for the evaluation of the musculoskeletal system (dual echo GRE) (Fig. 1.7) (39). The short echo produces a strong signal for visualizing the anatomy and the second echo a strong T2* contrast for detecting pathologic changes. We have found this sequence useful for routine examinations of the musculoskeletal system as long as the interpretation accounts for peculiarities of the GRE images, such as increased susceptibility effects, especially of the second echo, and dephasing effects, which can cause an apparent magnification of calcifications or disk prolapses.
Fig. 1.4 Diagram of the proton spectrum of subcutaneous fat and musculature. Pixels along the interface between fat and water show about equal contribution of both components.
C = C- = double binding predominantly in unsaturated fatty acids
H20 = water
CH2, CH3 = methylene and methyl groups
ppm = parts per million
Fig. 1.5 Signal vectors of fat and water in the XY planes in GRE sequences. Different phases of the fat and water vectors with different echo times. For pixels with fat and water components the signal intensities are added in-phase and subtracted in opposed-phase.
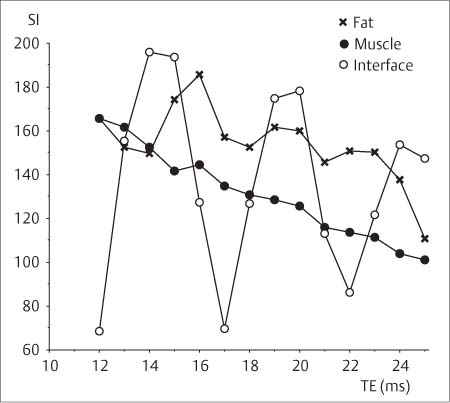
Fig. 1.6 Signal intensities of fat, muscle, and fat–muscle interface in relation to an echo time of 1.5 T for GRE sequences. Muscle shows no signal oscillation and fat only minor oscillation. The interface exhibits a marked signal oscillation at a slightly different oscillation frequency. This difference can be explained by the spectra (see Fig. 1.4) since the spectrum of subcutaneous fat has several peaks (multiple component system) and not just two major peaks (two component system) as found, for instance, in pixels along the interface. The signal maximum is referred to as in-phase and the minimum of opposed-phase echo time.
SI = signal intensity
TE = echo time
Fig. 1.7a–e Shoulder, oblique coronal (a–c) and oblique sagittal (d, e) plane, 0.5 T. a SE (TR = 600, TE = 15). b–e GRE (TR = 600, flip angle = 30 degrees) with different echo times. b TE = 14 msec. c TE = 35 msec. d TE = 7 msec. e TE = 28 msec. The echo times of 35 and 7 msec (c and d) are opposed-phase echo times with low signal intensity of the hematopoietic bone marrow and signal-void fat–muscle interface (etching artifact). With 14 and 26 msec, fat and water protons are in-phase (b and e).
Ultra-Fast MR Techniques
In the recent past, numerous new sequences with very short acquisition times have been proposed (Table 1.3), some of which are still under investigation. In the musculoskeletal system, the high temporal resolution achieved with ultra-fast MR sequences can be used for cinematic motion analysis of the joints (see below) and for dynamic contrast-enhanced imaging.
Low Field Strength Imaging
A low magnetic field strength is used with dedicated extremity MRI systems, which image the extremity of interest by placing it within the magnetic bore while the rest of the body remains outside the field. Images obtained with a low magnetic field strength have a lower signal-to-noise ratio, which may necessitate longer imaging times and decrease spatial resolution. The longer imaging times are partially offset by the gain in acquisition time due to shorter T1 values at lower field strength. Furthermore, contrast-to-noise ratio, which is clinically more relevant since it determines the conspicuity of the lesions, does not decrease significantly with a low magnetic field strength (4 a). Low field strengths are less susceptible to magnetic heterogeneity, but diminish spectral separation (chemical shift) and restrict spectral suppression.
Sequence | Abbreviation | Acquisition time per slice |
Fast GRE |
