How to Image Tendons
- •
Coils and patient position: Whether or not a coil should be used is based entirely on the anatomy to be imaged. Generally, surface coils improve images and should be used. For large areas, such as the thighs or pelvis, this approach is not practical, and surface coils are not used. Patients should be positioned as if the nearest joint were being imaged. Ankle tendons are imaged by positioning the patient and using a coil for an ankle examination.
- •
Image orientation: Generally, tendons are best imaged transversely (perpendicular to their long axis). Occasionally, other planes are helpful to image tendons in their entire length. The triceps, quadriceps, and Achilles tendons are depicted well on axial and sagittal images. The hamstring tendons in the pelvis and the supraspinatus tendon in the shoulder are shown well on coronal and axial images. Given only one option for an imaging plane through a tendon, axial images generally are the most useful.
- •
Pulse sequences and regions of interest: T1W and some type of T2W images are required for complete evaluation of tendons. T2W sequences are useful for showing abnormal fluid surrounding the tendon (tenosynovitis) and tears and most other kinds of tendon pathology. We prefer fast spin echo with fat saturation or STIR sequences for T2W images of tendons. Slice thickness and fields of view are determined by the size of the body part being imaged. A good rule of thumb is that the same field of view and slice thickness that are used to image the adjacent joint would suffice to image a tendon in that same region.
- •
Contrast: There is no need to do contrast-enhanced studies for tendon evaluation except to evaluate possible active tendon disease in inflammatory conditions (eg, rheumatoid arthritis).
NORMAL TENDONS
Anatomy
Tendons are avascular structures that attach muscles to bones. They are made of dense fascicles of collagen fibers. The fascicles of collagen are composed of smaller units, called microfibrils . Microfibrils interdigitate with one another in a regular and structured fashion to form extremely tight bonds, giving tendons their strength. The microfibrils are made of a protein called tropocollagen , which consists of three polypeptide chains arranged in a triple-helix configuration. The helical configuration of the protein tightly binds molecules of water so that tendons have low signal intensity because the hydrogen ions in water are not mobile.
Most tendons are invested with a tendon sheath, which either partially or completely covers the tendon. Tendon sheaths are present where tendons pass through fascial slings, beneath ligamentous bands, or through fibro-osseous tunnels. They exist where closely apposed structures move relative to one another, to decrease friction. The microscopic structure of a tendon sheath is similar to the synovial membrane that lines joints. During fetal development, the tendon invaginates the tendon sheath so that there are inner (visceral) and outer (parietal) layers of the sheath that are closely apposed to each other. A mesotendon is formed where the tendon invaginated the sheath. The mesotendon carries blood vessels and is located on the nonfrictional surface of the tendon. A thin layer of synovial fluid exists between the visceral and parietal layers of the tendon sheath and allows for smooth gliding of the tendon.
Some tendons are located mainly outside of the muscle, such as the distal biceps tendon at the elbow. Other tendons have long segments that are surrounded by muscle and have very little exposed tendon, such as the brachialis at the elbow ( Fig. 3-1 ).

MRI of Normal Tendons
Normal tendons have so few mobile protons that they are usually low signal intensity on all pulse sequences. The major exceptions to this rule include the quadriceps tendon at the knee and distal triceps tendon at the elbow, which have a striated appearance with alternating areas of linear low and intermediate signal intensity (similar to the distal anterior cruciate ligament in the knee) (see Fig. 3-1 ). This striated appearance is caused by the longitudinal arrangement of coarse fasciculi and by the fact that several tendons are fusing to form a single, conjoined tendon. The longitudinal striations in the triceps and quadriceps tendons must not be mistaken for pathology. Similarly, there is a solitary vertical line of high signal intensity in the midsubstance of many normal Achilles tendons, which probably represents the site where the soleus and gastrocnemius tendons (which make up the Achilles tendon) are apposed to one another, or else a vascular channel in the tendon.
There are certain other exceptions to the rule that normal tendons are low signal intensity on all pulse sequences ( Box 3-1 ). Many tendons may show slightly increased signal intensity near their osseous insertions. This increased signal intensity occurs because tendons may fan out as they come to attach to a bone, and nontendinous fatty material is interposed between tendon fibers ( Fig. 3-2 ).
Normal Causes
- •
Coarse fascicles or several tendon layers fusing
- •
Quadriceps and distal triceps tendons
- •
- •
Osseous insertions
- •
Tendons spread, change orientation
- •
- •
Magic angle phenomenon
- •
Tendon orientation at 55 degrees to bore of magnet
- •
Abnormalities
- •
Myxoid degeneration
- •
Partial or complete tears
- •
Xanthoma, tumor, gout deposits

A second major reason for a normal tendon having increased signal intensity is the result of the magic angle phenomenon. The magic angle phenomenon results from the fact that tendons are anisotropic structures. When tendons are oriented at an angle of about 55 degrees to the bore of the magnet, there is high signal intensity within the tendon on short TE sequences (eg, T1W, proton density, and gradient echo sequences). Whether high signal on short TE sequences is from the magic angle phenomenon or from pathology generally can be determined in various ways:
- 1.
Use a pulse sequence with a long TE, in which case the high signal intensity disappears and the tendon appears normal.
- 2.
Observe that the tendon is of normal caliber.
- 3.
Reposition the body part being imaged so that the tendon is imaged at a different angle relative to the bore of the magnet.
Most tendons are round, oval, or flat when imaged transversely. Tendon sheaths are not normally seen on MRI, unless fluid is present in the sheath. Small amounts of fluid may be seen in certain tendon sheaths, particularly in the ankle and wrist. Our general rule is that the fluid should not be considered abnormal unless it completely surrounds the circumference of the tendon.
TENDON ABNORMALITIES ( Box 3-2 )
The major abnormalities that may affect tendons include tendon degeneration, tenosynovitis, partial tears, complete tears, subluxation or dislocation, xanthoma formation, deposits of calcium hydroxyapatite or calcium pyrophosphate crystals, gouty tophi, and clear cell sarcoma. Giant cell tumor of the tendon sheath is a common mass that arises from the tendon sheath. The most common tendon abnormalities seen on MRI are degeneration, tenosynovitis, and tears ( Fig. 3-3 ).

Degeneration
Myxoid degeneration of tendons occurs with aging or from chronic overuse ( Fig. 3-4 ). This is a painless process, but it weakens the tendon so that it is predisposed to partial or complete tears with minimal trauma. The quadriceps, patellar, and Achilles tendons are good examples of tendons that may rupture with no or minimal trauma because of preexisting underlying tendon degeneration.

On MRI examination, a degenerated tendon has high signal intensity within the substance of the tendon on T1W and any type of T2W sequences. The tendon is generally normal or enlarged in caliber; this cannot be distinguished from partial tears of a tendon. Many clinicians use terms such as tendinitis, tendinopathy , or tendinosis to indicate that such abnormal signal intensity of a tendon exists, but that it is impossible to give the precise cause for the findings. The term tendinitis probably should not be used because an inflammatory response in the tendon does not occur. Another way to describe the nonspecific findings of intrasubstance high signal in a tendon is simply to state that it is compatible with degeneration or partial tears because they generally coexist anyway.
Tenosynovitis ( Box 3-3 )
Fluid that completely surrounds the circumference of a tendon indicates an inflammatory process of the tendon sheath, called tenosynovitis . The underlying tendon may be normal or abnormal. The abnormal presence and amount of fluid is required to make this diagnosis regardless of the status of the tendon fibers. Tenosynovitis may occur from chronic repetitive motion or stress on the tendon from overuse, from an inflammatory arthritis, or from a purulent infection.
Causes
- •
Overuse, increased stresses
- •
Inflammatory arthritis
- •
Infection
Stenosing Tenosynovitis
- •
Focal, loculated fluid collections in tendon sheath, often with septations in fluid
MRI
- •
Underlying tendon may be normal or abnormal
- •
Fluid (low signal, T1; high signal, T2) must surround the entire circumference of a tendon—meaningless if tendon sheath communicates with adjacent joint
- •
Septations in loculated fluid of stenosing tenosynovitis are thin, linear, low signal structures; do not confuse with mesotendon
- •
Pannus may be present in tendon sheaths in rheumatoid arthritis
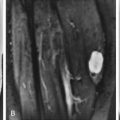
Stenosing tenosynovitis can occur when there are focal, loculated collections of fluid in the tendon sheath. This is a common finding in the flexor hallucis longus tendon around the ankle in patients with the os trigonum syndrome and in the wrist from de Quervain’s stenosing tenosynovitis.
MRI of tenosynovitis shows a rounded collection of fluid that is low signal intensity on T1W and high signal intensity on T2W images, completely surrounding a tendon on images obtained transversely through it. The mesotendon may be identified as a thin, low signal intensity line extending from the tendon to the outer layer of the tendon sheath ( Fig. 3-5 ). The underlying tendon may be normal or abnormal in signal intensity and caliber. Stenosing tenosynovitis can be diagnosed on MRI by the presence of focal distention of a tendon sheath with fluid and thin, linear low signal intensity septations that course through the fluid in the sheath ( Fig. 3-6 ).


Tendon sheaths that communicate directly with an adjacent joint (eg, the long head of the biceps tendon in the shoulder and the flexor hallucis longus tendon at the ankle) should not be considered to have tenosynovitis simply because of the finding of fluid surrounding the circumference of the tendon. If there is an effusion of the joint, fluid can surround the tendon without the tendon or its sheath being abnormal. We consider fluid around these specific tendons to have possible clinical significance only if there is no adjacent joint effusion.
Tendons that do not have a sheath may have inflammatory changes surrounding the tendon, which is called paratendinitis ( Fig. 3-7 ). MRI shows abnormal signal intensity typical of edema (low signal intensity on T1W and hyperintense on T2W images) in the soft tissues surrounding the tendon. The Achilles tendon is a classic location for these findings because it has no tendon sheath.

Tendon Tears ( Box 3-4 )
Several conditions cause weakened tendons and predispose to tears, including chronic repetitive stresses, tendon degeneration, inflammatory processes of tendons (eg, from rheumatoid arthritis, seronegative spondyloarthropathies, systemic lupus erythematosus, or infection of the tendon sheath), chronic renal disease, use of long-term systemic steroids and certain other medications, diabetes, and gout. Partial tendon tears represent incomplete disruption of the fibers. Complete tendon tears indicate total disruption of the fibers of the tendon so that there are two separate fragments. Partial tears often are difficult to diagnose on clinical grounds, whereas complete tears are more obvious.
- •
Tendon degeneration—occurs with age and from chronic stresses
- •
Chronic, repetitive stresses (overuse)
- •
Acute major trauma
- •
Diabetes
- •
Systemic steroids and other medications
- •
Rheumatoid arthritis and other inflammatory arthritides
- •
Chronic renal failure/hyperparathyroidism
- •
Infection of tendon sheath
- •
Gout
Partial tendon tears can have a variable appearance on MRI ( Fig. 3-8 ). The tendon may be thickened (hypertrophic partial tear) or thinned (atrophic partial tear), or remain of normal caliber with abnormal signal being the only evidence of the partial tear. An attenuated tendon is closer to complete rupture than a thickened tendon. A classification system has been proposed to describe tears based on the caliber of the tendon; we prefer simply to describe the findings (partial tear with a normal-caliber, thickened, or attenuated tendon), rather than assign a number from a classification system, because we cannot remember the system ourselves and especially because referring physicians are unaware of the classification system. Tendons sometimes become partially torn in a longitudinal or vertical manner, rather than transversely ( Fig. 3-9 ). A split tendon may be functionally incompetent and act as if it is completely torn, even though it is still in continuity with the muscle and the bone. Another type of partial tear involves delamination of the tendon fibers. This diagnosis is made when fluid is seen to extend through a partial-thickness tear and track within the substance of a tendon, with partial retraction of the fibers along one of its surfaces ( Fig. 3-10 ).


Usually there is high signal intensity in the tendon on all pulse sequences with partial tendon tears, but with chronic partial tears, there may be low signal intensity because of scarring and fibrosis. An abnormal tendon size and tenosynovitis are the only ways to recognize the tendon as abnormal in this situation. Tenosynovitis often coexists with partial tendon tears.
Complete tendon rupture on MRI appears as a focal disruption with absence of the tendon fibers for variable distances ( Fig. 3-11 ). MRI is valuable in documenting the presence of a complete tear, showing the quality of the remnants of tendon, and showing how far retracted the remnants are; all of these features may contribute to determining how to manage the patient. Careful search for tendons on every image is essential not to overlook tears because abnormalities may be present on only one image.

Tendon Subluxation/Dislocation ( Box 3-5 )
Most tendons maintain a normal relationship to adjacent osseous structures by way of retinacula that hold them in place. If the retinacula become disrupted, the tendons may sublux or dislocate from their normal positions ( Fig. 3-12 ). The tendons may have no intrinsic, underlying abnormalities, but partial tears, complete tears, and tenosynovitis are common from irritation with chronic subluxation and wear and tear on adjacent bones. The tendons that may sublux or dislocate include the extensor carpi ulnaris in the wrist, the long head of the biceps in the shoulder, the peroneal tendons over the lateral malleolus at the ankle, and the posterior tibial tendon on the medial side of the ankle.
- •
Wrist
- •
Extensor carpi ulnaris (medial)
- •
- •
Shoulder
- •
Long head of biceps (medial)
- •
- •
Ankle
- •
Peroneal tendons (lateral or medial)
- •
Posterior tibial (medial and anterior)
- •

Miscellaneous Tendon Lesions
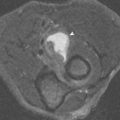
Abnormalities other than tears, tenosynovitis, and dislocations are uncommon. Xanthomas occur in patients with familial hyperlipidemia syndrome and most commonly affect the Achilles tendon and the extensor tendons of the hand ( Fig. 3-13 ).

Deposits of gout crystals also may affect tendons ( Fig. 3-14 ). It is usually impossible to distinguish gouty tophi or xanthomas from partial tendon tears by MRI, and they should simply be kept in mind in the appropriate setting. Calcific tendinitis from deposition of calcium hydroxyapatite crystals is common and easy to diagnose on radiographs, which is a good thing because MRI does not usually show the abnormality well. The hydroxyapatite crystals have low signal intensity on all pulse sequences that are usually difficult or impossible to distinguish from the low signal intensity tendon. If the crystal deposit is large enough, it may show lower signal than the tendon on all pulse sequences, making it visible on MRI ( Fig. 3-15 ).


Tumors of tendons are exceedingly rare, but clear cell sarcoma (malignant melanoma of soft parts) should be considered if one is considering a tumor at all. Tumors arising from the tendon sheath are much more common than a tumor of the tendon itself. Giant cell tumor of the tendon sheath is a common cause of a mass in the hands and feet. It is a localized and extra-articular form of pigmented villonodular synovitis. It manifests as a nonpainful, soft tissue mass. On MRI, it usually is lobulated with intermediate signal on T1W and T2W images, closely apposed to a low signal tendon ( Fig. 3-16 ).

How to Image Muscles
- •
Coils and patient position: Injury or other types of pathology often affect large muscles in large body parts where surface coils are not used. The use of coils depends on the size of the region being imaged. Generally, the patient should be imaged in the same position as if the adjacent joint were being imaged.
- •
Image orientation: Generally, most muscles and muscle groups are best evaluated in the axial plane. Longitudinal (coronal or sagittal) planes are used for orientation of abnormalities relative to osseous landmarks and to show the extent of the disease.
- •
Pulse sequences and regions of interest: T1W and some type of T2W imaging is required. For the T2 sequence, we prefer using STIR because this sequence is exquisitely sensitive to most muscle pathology. T1 sequences also are necessary to show anatomic detail and configuration of the muscle, subacute hemorrhage, and fatty atrophy of muscle. Fields of view and slice thickness depend entirely on the body part being imaged and the extent of the suspected abnormality. We often do a large field-of-view coronal, fast STIR sequence as a scout view. The edema that is present indicates the region that needs to be covered with a smaller field of view and other pulse sequences, and whether or not a surface coil can be used.
- •
Contrast: Contrast-enhanced sequences are unnecessary, unless one is attempting to identify abscesses or areas of muscle necrosis.
NORMAL MUSCLE
MRI Appearance
Normal skeletal muscle has intermediate signal intensity on all pulse sequences ( Fig. 3-17 ). T1W images show a feathery or marbled appearance because of fat that is interposed between adjacent muscles and between muscle fibers within a muscle. In some locations, individual muscle groups can be distinguished because of interposed fat. Where intermuscular fat is sparse, such as in the calf, individual muscle groups blend together and are difficult to identify. Low signal intensity tendons may course through a muscle for long distances, or may arise near the periphery of a muscle; this myotendinous junction is usually the weakest link in the chain from a perspective of strength of the entire unit. On T2W sequences, normal muscle remains intermediate signal intensity, and no high signal is evident between muscles, with the exception of normal vascular structures.

MUSCLE ABNORMALITIES
Several abnormalities of muscle occur that can be evaluated well by MRI, including abnormalities from trauma, inflammatory disorders, tumors, denervation, muscular dystrophies, neuromuscular disorders, and ischemia. Despite the wide variety of pathology that may affect it, muscle responds in only a few ways, and this is reflected in the MRI appearances of most of these entities. Generally, acute muscle pathology manifests as high signal intensity on STIR or fat-saturated T2W images (edema, hemorrhage), whereas chronic muscle pathology typically results in fatty atrophy that is evident as high signal intensity on T1W images. As a result, MRI is exquisitely sensitive to muscle abnormalities, but is usually nonspecific. Because of this, it is important to have a list of differential diagnoses available when a muscle abnormality is encountered on MRI (eg, the abnormalities listed in the outline for this chapter). Clinical findings and biopsy of abnormal tissue play important roles in making a specific diagnosis when abnormalities are proved by MRI, and MRI is useful in directing where a biopsy specimen should be obtained.
Abnormal muscle may have a normal, increased, or decreased size. As mentioned previously, there may be fatty replacement, manifested as high signal intensity in the muscle on T1W images, or there may be areas of high signal intensity on T2W images. A focal mass within muscle is another manifestation of disease.
MUSCLE TRAUMA
Traumatic muscle injuries are extremely common and can be divided into indirect muscle injuries, direct muscle injuries, and miscellaneous muscle injuries. Usually, traumatic injuries are imaged to assess the exact cause of pain and the extent of the injured area.
Indirect Muscle Injuries ( Box 3-6 )
Indirect muscle injuries include (1) delayed-onset muscle soreness (DOMS) and (2) strains (muscle tears). When the force of a contracting muscle exceeds the load placed on it, the muscle shortens, and this is called concentric action (eg, the action of the biceps when lifting a weight). Conversely, eccentric action is when a muscle lengthens or stretches as it contracts (eg, the action of the biceps when lowering a weight). Concentric contractions produce fatigue, whereas eccentric contractions are responsible for indirect muscle injuries with muscle strains (partial or complete muscle tears).
Delayed-Onset Muscle Soreness (Muscle Stiffness)
- •
Pain peaks 2 days after unaccustomed activity
- •
No acute injury or painful event
- •
Damage is at ultrastructural level and reversible
Muscle Strains (Partial or Complete Tears)
- •
Sudden onset of pain occurs during activity
- •
Occurs during eccentric muscle contraction (ie, muscle lengthens as it contracts, such as the biceps while lowering a weight)
- •
Often affects muscles crossing two joints (rectus femoris, biceps femoris, gastrocnemius) and affects myotendinous junction
- •
Three grades
- •
Grade I—few muscle fibers torn, no functional loss, interstitial blood
- •
Grade II—more fibers torn, some loss of strength, focal defect and interstitial blood in muscle, blood surrounding tendon from myotendinous junction injury
- •
Grade III—muscle completely torn, loss of strength, focal and interstitial blood
- •
MRI of Muscle Strains
- •
DOMS and grade I (T2)
- •
Feathery, interstitial signal in muscle
- •
± ↑ signal between muscles
- •
- •
Grade II (T2)
- •
Feathery, interstitial ↑ signal in muscle
- •
↑ signal between muscles
- •
± focal muscle defect
- •
Tendon thinned, irregular, lax
- •
↑ signal surrounding tendon
- •
- •
Grade III (T2)
- •
Feathery, interstitial ↑ signal in muscle
- •
Complete muscle disruption with ↑ signal in gap between retracted segments
- •
↑ signal between muscle fragments—discontinuity of tendon within muscle
- •
Related posts:
Stay updated, free articles. Join our Telegram channel

Full access? Get Clinical Tree


