Although a detailed understanding of nuclear physics is not necessary to interpret magnetic resonance imaging (MRI) studies, it also is unacceptable to read passively whatever images you are given without concern for how the images are acquired, or how they might be improved. Radiologists should have a solid understanding of the basic principles involved in acquiring excellent images. This chapter describes the various components that go into producing high-quality images, stressing the fundamental principles shared by all MRI scanners.
Every machine is different. Clinical scanners are now available at strengths ranging from 0.2 Tesla (T) to 3.0T. Additionally, each vendor has its own language for describing its hardware, software, and scanning parameters, and an entire chapter could be devoted to deciphering the terms used by different manufacturers. Time spent learning the details of your machine with your technologists or physicists would be time well spent. If you are interested, read one of the excellent discussions of MRI physics in articles or other textbooks because, for the most part, in this book we leave the physics to the physicists.
What Makes a Good Image?
LACK OF MOTION
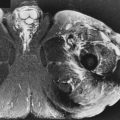
Motion is one of the greatest enemies of MRI ( Fig. 1-1 ). It can arise from a variety of sources, such as cardiac motion, bowel peristalsis, and respiratory movement. For most musculoskeletal applications, motion usually stems from body movement related to patient discomfort. Patient comfort is of paramount importance because even if all the other imaging parameters are optimized, any movement would ruin the entire image.

Patient comfort begins with positioning. Every effort should be made to make the patient comfortable, such as placing a pillow beneath the knees when the patient is supine to reduce the stress on the back or providing padding at pressure points. When the patient is in a comfortable position, passive restraints, such as tape, foam rubber, or sandbags, can be used for maximal immobilization. Music via headphones can help alleviate anxiety; oral sedation may be required for claustrophobic patients.
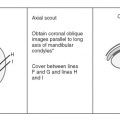
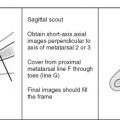
Another cause of patient motion is a prolonged examination, which is one reason why set imaging protocols are useful. By designing streamlined imaging sequences, the necessary scans are obtained in as short a time as possible, resulting in better patient compliance, improved technologist efficiency, and maximal scanner throughput. Standardized protocols also reduce the need for direct physician oversight during the scan and allow for improved image interpretation because the radiologist views the same anatomy in the same imaging planes and using the same sequences each time.
SIGNAL AND RESOLUTION ( Table 1-1 )
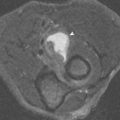
Signal is the amount of information on an image. Other factors are important, but if the image is signal-poor (ie, “noisy”), even the best radiologist would be unable to interpret it ( Fig. 1-2 ).
| ↑ Signal/↓ Resolution | ↑ Resolution/↓ Signal |
|---|---|
| ↑ Slice thickness | ↓ Slice thickness |
| ↑ Field of view | ↓ Field of view |
| ↓ Imaging matrix | ↑ Imaging matrix |

Each image is composed of voxels (volume elements) that correspond to small portions of tissue within the patient. One dimension of the voxel is defined by the slice thickness . The other dimensions are determined by the field of view and imaging matrix (number of squares in the imaging grid) ( Fig. 1-3 ). Because the signal is proportional to the number of protons resonating within each voxel, anything that increases the size of the voxel would increase the signal ( Fig. 1-4 ). Increasing slice thickness or field of view or, alternatively, decreasing the matrix (spreading the imaging volume over fewer but larger boxes), would increase the signal.


Another factor that affects the signal is the number of signal acquisitions (also known as the number of signal averages ). A signal average of 2 means that the signal arising from the protons in each voxel is collected twice, resulting in a doubling of the overall signal, but this also doubles the imaging time.
Finally, signal may be adversely affected if the slices are obtained too close together because of the phenomenon of “cross talk.” When adjacent slices are acquired, some interference from one slice may spill over into the adjacent slice, resulting in increased noise. This is especially true for T2-weighted sequences. This effect is lessened by interposing a “gap” between the slices (a small portion of tissue that is not imaged), resulting in decreased noise and increased signal. Typical gaps range from 10% to 25% of the slice thickness. The larger the gap, the greater the amount of unimaged tissue, and the greater the possibility of missing a small lesion.
Now that we have discussed several ways to improve the signal of the image (also known as increasing the signal-to-noise ratio ), we need to look at the second major factor that makes for a good image: resolution . Resolution is the ability to distinguish small objects. It is absolutely critical in most musculoskeletal applications.
As in life, there is no such thing as a free lunch in MRI, and any changes designed to improve resolution negatively affect the signal. Decreasing the size of the voxel (by decreasing slice thickness, decreasing the field of view, or increasing the imaging matrix) not only would improve resolution but also would decrease the number of protons in each voxel and decrease the signal. Consequently, when designing imaging protocols, there is always a compromise between (1) maximizing signal and (2) optimizing resolution. Another factor, (3) coil selection, can help to minimize this tradeoff.
The image in MR is created using the signal that returns from resonating protons within tissue. Just as it is easier to hear a speaker’s voice the closer he or she is to you, the closer the receiver coil is to the tissues of interest, the better the signal and the lower the noise.
In MRI, every attempt should be made to use the smallest coil possible to produce the maximum signal. Coils that can be placed on or close to the body part of interest are called surface coils and result in markedly improved signal compared with the body coil . A factor that must be considered when selecting a coil relates to its size. A coil must be able to detect signal from the entire length and depth of the tissues of interest; for a flat surface coil, the depth of penetration equals roughly half of the coil’s diameter or width. Beyond this distance, the signal begins to drop off, as evidenced by decreasing signal in that region of the image ( Fig. 1-5 ). To avoid this problem, so-called volume coils often are used in the extremities. These encircle the arm or leg, providing uniform signal throughout the tissues of interest. Most newer coils also are constructed with a phased array design. A phased array coil is composed of several smaller coils placed in a series, resulting in maximal signal from each small coil and from each segment of tissue covered by the coils. The use of a surface coil usually provides more than adequate signal and allows for the use of high-resolution imaging parameters.

TISSUE CONTRAST
Both computed tomography (CT) and MRI are capable of producing high-resolution scans, but the superior soft tissue contrast of MRI (the ability to differentiate different types of tissue based on their signal intensities) sets it apart. A CT image is based on the x-ray attenuation properties of tissues, whereas soft tissue contrast in MRI is related to differences in proton resonance within the tissues. The protons within fat resonate differently than the protons in fluid, and by changing the imaging parameters at the MRI console, differences in these tissue-specific properties can be emphasized. This is known as weighting the image. Tissues can be differentiated based on their signal intensities on various sequences. The signal intensity of a tissue on MRI should be described in relative terms (eg, hyperintense relative to muscle) because the gray scale values of the image are not assigned in a quantitative fashion as with CT but are scaled relative to the brightest voxel on the image.
Pulse Sequences ( Tables 1-2 and 1-3 )
The collection of specific imaging parameters selected for a single scan are called a pulse sequence . A typical musculoskeletal examination includes three to six sequences obtained in various anatomic planes. There are many different kinds of sequences and each has specific strengths and weaknesses. We do not want to get bogged down in technical details at this point; in the following discussion, typical imaging parameters for each pulse sequence are provided in parentheses. These are summarized in Table 1-3 , and there is a glossary at the end of the chapter to help with understanding any unfamiliar terms.
| Sequence | Strength | Weakness |
|---|---|---|
| Spin Echo | ||
| T1 |
|
|
| Proton density |
| Poor detection of fluid and marrow pathology |
| T2 | Detection of fluid and many pathologic processes | Long imaging times— as a result, no longer used |
| Fast Spin Echo | ||
|
|
|
| Gradient Echo | ||
| T2 * |
|
|
| STIR | Marrow and soft tissue pathology | Should not be used with Gd-DTPA |
| Sequence | TR (msec) | TE (msec) | TI (msec) | Flip Angle (°) | ETL |
|---|---|---|---|---|---|
| T1 | ≤1000 | ≤30 | N/A | 90 | N/A |
| Proton density | ≥1000 | ≤30 | N/A | 90 | N/A |
| T2 | ≥2000 | ≥60 | N/A | 90 | N/A |
| FSE T2 | ≥2000 | ≥60 | N/A | 90 | 2-16 |
| GRE T1 | Variable | ≤30 | N/A | 70–110 | N/A |
| GRE T2 * | Variable | ≤30 | N/A | 5–20 | N/A |
| FSE STIR | ≥2000 | ≥60 | 120-150 | 180→90 | 2-16 |
Spin Echo.
Conventional spin echo pulse sequences include T1-weighted (T1W), T2-weighted (T2W), and proton density–weighted sequences ( Table 1-4 ).
| T1 | T2 | |
|---|---|---|
| Fat | ↑↑ | ↑ |
| Subacute hemorrhage | ↑↑ | ↑↑ |
| Proteinaceous fluid | ↑ | ↑↑ |
| Fluid | ↓ | ↑↑ |
| Fibrous tissue/scar | ↓ | ↓or ↑ |
| Cortical bone | ↓↓ | ↓↓ |
| Chronic hemorrhage/hemosiderin | ↓↓ | ↓↓ |
| Air | ↓↓ | ↓↓ |
T1.
T1 (TR <800 msec; TE <30 msec) is considered a “short TR, short TE” sequence. Fat and subacute hemorrhage are bright on these images ( Fig. 1-6 ). Proteinaceous fluid (as in an abscess or ganglion cyst) may be of intermediate or high signal intensity owing to the protein content. Most other soft tissues are of intermediate to low signal intensity on T1W images, and fluid is especially low (hypointense relative to muscle) ( Fig. 1-7 ). T1W images are useful for delineating anatomic planes, marrow architecture, fat content within masses, and subacute hemorrhage. T1W sequences also are used to evaluate tissue enhancement after intravenous (IV) administration of gadolinium-DTPA (Gd-DTPA) (see later in this chapter).


T2.
T2 (TR >2000 msec; TE >60 msec) is considered a “long TR, long TE” sequence. Fluid is bright on T2W images (see Fig. 1-7 ). An easy way to remember this is that fluid (H 2 O) is bright on T 2 W images. Likewise, most pathologic processes (eg, tumor, infection, injury) often are highlighted on T2W images because of their increased fluid content. Fat is less bright than on T1W images, and muscles remain of intermediate signal intensity. Conventional T2W spin echo sequences have been a part of most imaging protocols in the past but now are used much less frequently because of their relatively long imaging times.
Proton Density.
Proton density (TR >1000 msec; TE <30 msec) is considered an “intermediate TR, short TE” sequence. Also known as spin density , these images represent a mixture of T1 and T2 weighting, with contrast being primarily a function of the number of protons within each tissue. This sequence also provides good anatomic detail but relatively little overall tissue contrast because of its intermediate weighting (see Fig. 1-7 ).
Fast Spin Echo.
Fast spin echo (FSE; also known as turbo spin echo ) allows for much more rapid acquisition of images than the conventional spin echo method. Several samples are acquired in the time one sample is obtained with a conventional spin echo technique ( Fig. 1-8 ). The time saved is directly proportional to the number of samples (also designated as the echo train length ). An FSE sequence with an echo train length of 4 would acquire the same amount of information as a conventional spin echo sequence in one fourth the time. Decreased overall imaging time lessens the potential for patient motion. Alternatively, the time saved can be used for obtaining additional signal averages to improve signal. FSE sequences commonly are used in musculoskeletal imaging.