Fig. 9.1
B-mode ultrasound demonstrates normal testicular tissue

Fig. 9.2
Colour Doppler ultrasound demonstrates internal vascularity of the normal testicular tissue

Fig. 9.3
VTIQ velocity colour overlay displays relative shear wave velocities (SWV) according to the adjacent colour spectrum, red areas corresponding to higher SWV values and blue areas corresponding to lower values


Fig. 9.6
In VTI elastography mode, the testicular tissue appears grey, indicating an intermediate stiffness of the tissue

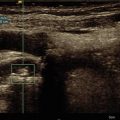
Fig. 9.7
In VTQ mode, the shear wave velocity in the upper pole of the normal testicular tissue was measured with a velocity of v = 0.66 m/s

Fig. 9.8
In VTQ mode, the shear wave velocity was measured in the middle of the normal testicular tissue with a velocity of v = 0.65 m/s

Fig. 9.9
Strain elastogram image shows a homogenous grey colour, as indicating normal testicular tissue. The testis has the same size in the strain elastogram mode in comparison to the B-mode

Fig. 9.10
Ultrasound images of a 35-year-old man. B-mode ultrasound demonstrates a huge testicular lesion measuring 55 mm, with uniform low reflectivity. The surgically proven histological diagnosis was a seminoma

Fig. 9.11
Colour Doppler ultrasound demonstrates a high vascularity within the tumour

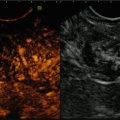
Fig. 9.12
Contrast-enhanced ultrasound confirmed the finding of colour Doppler ultrasound with a high vascularity within the tumour in comparison to the surrounding tissue

Fig. 9.13
VTIQ velocity colour overlay displayed relative shear wave velocities according to the adjacent colour spectrum, red areas corresponding to higher values (stiffer tissue) and blue areas corresponding to lower values (softer tissue). Shear wave velocity (SWV) was measured in the lesion between v = 2.06–3.15 m/s

Fig. 9.14
Same lesion as Fig. 9.12. Using the VTIQ quality map, most of the testis and the lesion are coloured green, indicating a high quality of generated shear waves


Fig. 9.16
In VTQ mode, the shear wave velocity was measured on the right side of the tumour tissue with a velocity of v = 3.02 m/s

Fig. 9.17
In VTQ mode, the shear wave velocity was measured on the left side of the tumour tissue with a velocity of v = 2.21 m/s

Fig. 9.18
In the strain elastogram, the lesion appears dark grey, an indicator of stiff tissue. The border of the lesions is displayed well in this technique

Fig. 9.19
Ultrasound images of a 27-year-old man. B-mode ultrasound demonstrates a hypoechoic lesion. The surgically proven histological diagnosis was a seminoma

Fig. 9.20
Colour Doppler ultrasound demonstrates a high vascularity within the tumour

Fig. 9.21
Contrast-enhanced ultrasound confirmed the finding of colour Doppler ultrasound with a high vascularity within the tumour in comparison to the surrounding tissue

Fig. 9.22
VTIQ velocity colour overlay displayed relative shear wave velocities according to the adjacent colour spectrum, red areas corresponding to higher values and blue areas corresponding to lower values. Shear wave velocity was measured in the lesion v = 1.90–1.91 m/s and in the surrounding tissue level between v = 1.14–1.29 m/s

Fig. 9.23
Same lesion as Fig. 9.22. Using the VTIQ quality map, the entire testicular tissue and the lesion are coloured green, indicating a high quality of generated shear waves


Fig. 9.25
In VTI elastography mode, the tumour appears dark grey indicative of a stiff lesion in comparison to the light grey display of the normal surrounding tissue

Fig. 9.26
In VTQ mode, the shear wave velocity was measured in the normal tissue with a velocity of v = 0.74 m/s

Fig. 9.27
In VTQ mode, the shear wave velocity was measured in the tumour tissue with a velocity of v = 2.61 m/s

Fig. 9.28
In the strain elastogram, the lesion appears in dark grey, an indicator of very stiff tissue. The border of the lesions is displayed well in this technique

Fig. 9.29
Ultrasound images of a 47-year-old man. B-mode ultrasound demonstrates a hypoechoic lesion which was stable for more than 3 years. The diagnosis was a haemorrhagic cyst. The surgically proven histological diagnosis was that of a seminoma

Fig. 9.30
Colour Doppler sonography indicates no vascularity of the lesion

Fig. 9.31
Contrast-enhanced ultrasound confirmed a marginal contrast uptake in the tumour, which is not consistent with a haemorrhagic cyst

Fig. 9.32
VTIQ velocity colour overlay displays relative shear wave velocities according to the adjacent colour spectrum, red areas corresponding to higher values and blue areas corresponding to lower values. Shear wave velocity was measured in the lesion v = 1.79–2.62 m/s and in the surrounding tissue level between v = 1.74–1.97 m/s

Fig. 9.33
Same lesion as Fig. 9.32. Using the VTIQ quality map, the entire testicular tissue and the lesion are coloured green, indicating high-quality shear waves


Fig. 9.35
In VTI elastography mode, the periphery of the tumour tissue appears dark grey, whereas the centre of the tumour appears bright grey/white

Fig. 9.36
In VTQ mode, the shear wave velocity was measured in the normal tissue with a velocity of v = 0.57 m/s

Fig. 9.37
In VTQ mode, the shear wave velocity was measured in the tumour tissue with a velocity of v = 1.89 m/s

Fig. 9.38
In the strain elastogram, the lesion appears in dark blue indicating stiff tissue. The border of the lesions is displayed well in this technique

Fig. 9.39
Ultrasound images of a 41-year-old man. B-mode ultrasound demonstrates a hypoechoic lesion. The surgically proven histological diagnosis was a teratoma

Fig. 9.40
Colour Doppler ultrasound demonstrates a high vascularity within the tumour

Fig. 9.41
VTIQ velocity colour overlay displays relative shear wave velocities according to the adjacent colour spectrum, red areas corresponding to higher values and blue areas corresponding to lower values. Shear wave velocity was measured in the lesion v = 1.86–3.25 m/s and in the surrounding tissue level between v = 0.87–1.07 m/s

Fig. 9.42
Same lesion as Fig. 9.41. Using the VTIQ quality map, most of the testicular tumour is coloured green, indicating the generated shear waves are of good quality. Most of the normal testicular tissue is coloured in yellow, as an indicator for a moderate quality of generated shear waves


Fig. 9.44
In VTI elastography mode, the periphery of the tumour tissue is displayed in red and green, indicating stiffer tissue in the lesion in comparison to the surrounding tissue

Fig. 9.45
In VTQ mode, the shear wave velocity was measured in the tumour tissue with a velocity of v = 1.80 m/s

Fig. 9.46
In VTQ mode, the shear wave velocity was measured in the normal tissue with a velocity of v = 0.89 m/s

Fig. 9.47
In the strain elastogram, the lesion appears red indicative of very stiff tissue. The border of the lesions is well displayed using this technique

Fig. 9.48
Ultrasound images of a 37-year-old man following a soccer trauma. B-mode ultrasound demonstrates a hypoechoic lesion confirming the haematoma

Fig. 9.49
Colour Doppler ultrasound demonstrates no vascularity within the haematoma

Fig. 9.50
Contrast-enhanced ultrasound confirmed no contrast uptake in the haematoma, indicating no active bleeding

Fig. 9.51
VTIQ velocity colour overlay displayed relative shear wave velocities according to the adjacent colour spectrum, red areas corresponding to higher values and blue areas corresponding to lower values. Shear wave velocity was measured in the haematoma v = 1.33–3.00 m/s and in the surrounding tissue level between v = 1.15 m/s

Fig. 9.52
Same lesion as Fig. 9.51. Using the VTIQ quality map, most of the testicular haematoma and the surrounding tissue is coloured green, an indicator of the good quality of the generated shear waves

Fig. 9.53


Same lesion as Figs. 9.51 and 9.52. VTIQ displacement mode showed a low deformation of part of the haematoma displayed as dark blue in comparison to good displacement of the normal testicular tissue displayed in bright blue
Related posts:
Stay updated, free articles. Join our Telegram channel
Full access? Get Clinical Tree
