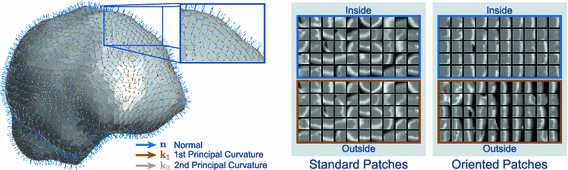
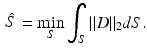
Fig. 1.
Dictionary-based appearance learning and segmentation of post-surgical cortical brain surface in CT images for direct non-rigid registration of with pre-surgical MRI. We use a training set of post-implantation CT image to learn two models of image appearance, one inside the cortical surface and one outside. We then use these models to segment the cortical surface from test CT images. Using the extracted post-op surface, we perform surface-based registration with the pre-op MRI in order to co-visualize post-implantation electrodes with pre-op imaging data.
2 Methods
From a clinical database of  epilepsy patients at our institution, we have a set of images
  , where
  denotes pre-op images acquired at time
  and post-op images acquired at time
  using imaging modality m for patient i. Following the current practice, for each patient we (i) create pre-op and post-op brain surfaces
  and
and  from the MR images by extracting isosurfaces of the brain masks generated by using the Brain Extraction Tool (BET) [14], (ii) rigidly register
  to
to  to produce the transformation
  by maximizing the normalized mutual information (NMI) similarity metric [16], and (iii) non-rigidly register
  to
to  using a free-form deformation (FFD) [13] with 30 mm B-spline control point spacing and maximizing their NMI to produce the transformation
  . We make use of this data to train our model of brain surface appearance in post-surgical CT images.
epilepsy patients at our institution, we have a set of images , where denotes pre-op images acquired at time and post-op images acquired at time using imaging modality m for patient i. Following the current practice, for each patient we (i) create pre-op and post-op brain surfaces and from the MR images by extracting isosurfaces of the brain masks generated by using the Brain Extraction Tool (BET) [14], (ii) rigidly register to to produce the transformation by maximizing the normalized mutual information (NMI) similarity metric [16], and (iii) non-rigidly register to using a free-form deformation (FFD) [13] with 30 mm B-spline control point spacing and maximizing their NMI to produce the transformation . We make use of this data to train our model of brain surface appearance in post-surgical CT images.2.1 Oriented Local Image Appearance
Let  be the 3D image that maps points from the spatial domain
  to image intensity values. We define the set of intensities in an orientable local image patch
  centered about
  :
:
Here,  is a rotation matrix consisting of a set of orthonormal basis vectors and
  is a set of d image intensity values sampled at patch template points
  , whose physical size is controlled by a scale term
  . Typically, standard image patches are aligned with the image axes such that
  uses the standard basis
  , the identity matrix, and
  consists of an isotropic grid of sample points centered about the patch origin. For example, a
  isotropic image patch
  consists of
  sample points
  arranged in a grid about the patch origin.
be the 3D image that maps points from the spatial domain to image intensity values. We define the set of intensities in an orientable local image patch centered about :(1)
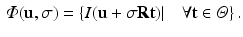
is a rotation matrix consisting of a set of orthonormal basis vectors and is a set of d image intensity values sampled at patch template points , whose physical size is controlled by a scale term . Typically, standard image patches are aligned with the image axes such that uses the standard basis , the identity matrix, and consists of an isotropic grid of sample points centered about the patch origin. For example, a isotropic image patch consists of sample points arranged in a grid about the patch origin.In this work, we use oriented image patches, where the orientation of the patch  is determined by the data. Since we are interested in building a model of image appearance both inside and outside the brain surface, we orient image patches according to local surface geometry. For each point on the surface of interest
  , we compute the local surface normal
  and the directions of principal curvature
  [6]. These normalized vectors form an orthonormal basis
 ![$$\mathbf{R}=\left[ \mathbf{n}|\mathbf{k}_1 |\mathbf{k}_2 \right] $$](/wp-content/uploads/2016/09/A339424_1_En_52_Chapter_IEq33.gif) with which we orient the patch
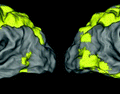
with which we orient the patch  in (1). Figure 2 provides an illustrative comparison between standard and oriented patches at corresponding points along a surface
  . By orienting the patches in this manner, the texture patterns in our patches exhibit greater invariance to changes in location along the surface S.
is determined by the data. Since we are interested in building a model of image appearance both inside and outside the brain surface, we orient image patches according to local surface geometry. For each point on the surface of interest , we compute the local surface normal and the directions of principal curvature [6]. These normalized vectors form an orthonormal basis with which we orient the patch in (1). Figure 2 provides an illustrative comparison between standard and oriented patches at corresponding points along a surface . By orienting the patches in this manner, the texture patterns in our patches exhibit greater invariance to changes in location along the surface S.Fig. 2.
Examples of local oriented image patches compared to their corresponding standard local image patches oriented along the image axes. For the surface S, the local surface normal  and directions of principal curvature
  define a local orthonormal basis by which we orient the image patches. We show patch examples from both inside and outside the cortical surface.
and directions of principal curvature define a local orthonormal basis by which we orient the image patches. We show patch examples from both inside and outside the cortical surface.2.2 Training the Cortical Surface Appearance Model
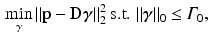
To learn our model of brain boundary appearance, we first map the segmented post-op brain surface to the post-op CT image space, 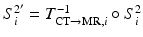 , where
  is the transformation operator. We then create a sparse representation model
  (dictionary) of the intensities inside of the brain and a model
  of the region just outside the brain [9]. These dictionaries will capture the varieties of textural appearance found near the brain surface boundary. We create these models by extracting a training set of overlapping local image patches inside,
  , and outside,
  , points on the surface
  , where
  is the outward facing local surface normal and
  mm defines a narrow band region. As in Sect. 2.1, we use the local surface geometry at
  to orient the image patches.
, where is the transformation operator. We then create a sparse representation model (dictionary) of the intensities inside of the brain and a model of the region just outside the brain [9]. These dictionaries will capture the varieties of textural appearance found near the brain surface boundary. We create these models by extracting a training set of overlapping local image patches inside, , and outside, , points on the surface , where is the outward facing local surface normal and mm defines a narrow band region. As in Sect. 2.1, we use the local surface geometry at to orient the image patches.For each appearance class  , we create appearance vectors
  for each image patch by concatenating the patch values from the set
  , where d is the sample dimensionality determined by the chosen patch sampling template
  in Sect. 2.1, and normalize
  to have unit length. Then, we model the distribution of
  ’s from all N training images using an overcomplete dictionary
  such that
  [1]. Here, n is the number of dictionary atoms and
  is the sparse dictionary weighting coefficients. To reconstruct a given appearance sample
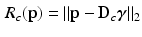
  (normalized to have unit length) from the dictionary with a given target sparsity constraint
  , we solve the sparse coding problem
using an orthogonal matching pursuit (OMP) algorithm [12]. Next, we define the residual error
for both the inside and outside region classes. Using normalized appearance vectors,  , where values of 0 correspond to perfect signal reconstruction (strong membership to class c) and values of 1 indicate
  could not be reconstructed by
  (poor membership to class c). Intuitively,
  for points inside the cortical surface boundary. In contrast to Huang et al. [9]’s multi-scale modeling where multi-scale data is concatenated into appearance vectors, we perform this sampling and training procedure individually for each level
  in a multi-resolution Gaussian image pyramid, which means that we train K dictionary pairs
  .
.
, we create appearance vectors for each image patch by concatenating the patch values from the set , where d is the sample dimensionality determined by the chosen patch sampling template in Sect. 2.1, and normalize to have unit length. Then, we model the distribution of ’s from all N training images using an overcomplete dictionary such that [1]. Here, n is the number of dictionary atoms and is the sparse dictionary weighting coefficients. To reconstruct a given appearance sample (normalized to have unit length) from the dictionary with a given target sparsity constraint , we solve the sparse coding problem(2)
(3)
, where values of 0 correspond to perfect signal reconstruction (strong membership to class c) and values of 1 indicate could not be reconstructed by (poor membership to class c). Intuitively, for points inside the cortical surface boundary. In contrast to Huang et al. [9]’s multi-scale modeling where multi-scale data is concatenated into appearance vectors, we perform this sampling and training procedure individually for each level in a multi-resolution Gaussian image pyramid, which means that we train K dictionary pairs .2.3 Segmenting the Cortical Surface in Post-implantation CT Images
Given a new pair of pre-implantation MRI and post-implantation CT test images not in the training set  , we perform an initial brain surface segmentation estimate
  using an intensity-based rigid registration of
  and
and  and transforming the segmented MR surface
  to post-op imaging space, i.e.
  . For a point on the estimated surface
  , we extract the oriented local image patch
  to create the appearance vector
  , and then compute the difference of the appearance model residuals from (3) such that
Intuitively, if  lies within the true boundary of the cortical surface in the CT image then
 ![$$D(\mathbf{p})>0$$” src=”/wp-content/uploads/2016/09/A339424_1_En_52_Chapter_IEq75.gif”></SPAN>, and if <SPAN id=IEq76 class=InlineEquation><IMG alt=$$\mathbf{u}$$ src=]() is outside the true boundary then
is outside the true boundary then  . Thus, the cortical surface boundary is located at the point
  where
where  . We therefore seek the surface that minimizes the objective function
 Stable Overlapping Replicator Dynamics for Multimodal Brain Subnetwork Identification
 PET Reconstruction with Sparse Image Representation and Anatomical Priors
 Gaussian Process-Based Modelling and Prediction of Image Time Series
 Multimodal Joint Generative Model of Brain Data
 Trajectory and Progression Score Estimation from Voxelwise Longitudinal Imaging Measures: Application to Amyloid Imaging
 Frames for Heart Fiber Reconstruction


, we perform an initial brain surface segmentation estimate using an intensity-based rigid registration of and and transforming the segmented MR surface to post-op imaging space, i.e. . For a point on the estimated surface , we extract the oriented local image patch to create the appearance vector , and then compute the difference of the appearance model residuals from (3) such that(4)
lies within the true boundary of the cortical surface in the CT image then . Thus, the cortical surface boundary is located at the point where . We therefore seek the surface that minimizes the objective functionRelated posts:
Stable Overlapping Replicator Dynamics for Multimodal Brain Subnetwork Identification
PET Reconstruction with Sparse Image Representation and Anatomical Priors
Stay updated, free articles. Join our Telegram channel
Full access? Get Clinical Tree
