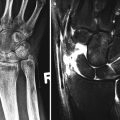
Fig. 14.1
AP foot radiograph in a 67-year-old female diabetic with long-standing foot problems. There is a homolateral Lisfranc fracture dislocation (arrows, the first to fifth metatarsals are dislocated laterally at the TMT joints with associated fractures), there is increased sclerosis, and there is periosteal reaction along the lateral proximal and mid-diaphysis of the first and third metatarsals (arrowheads). The first MTPJ is widened, bony destruction with periarticular erosions and intra-articular debris
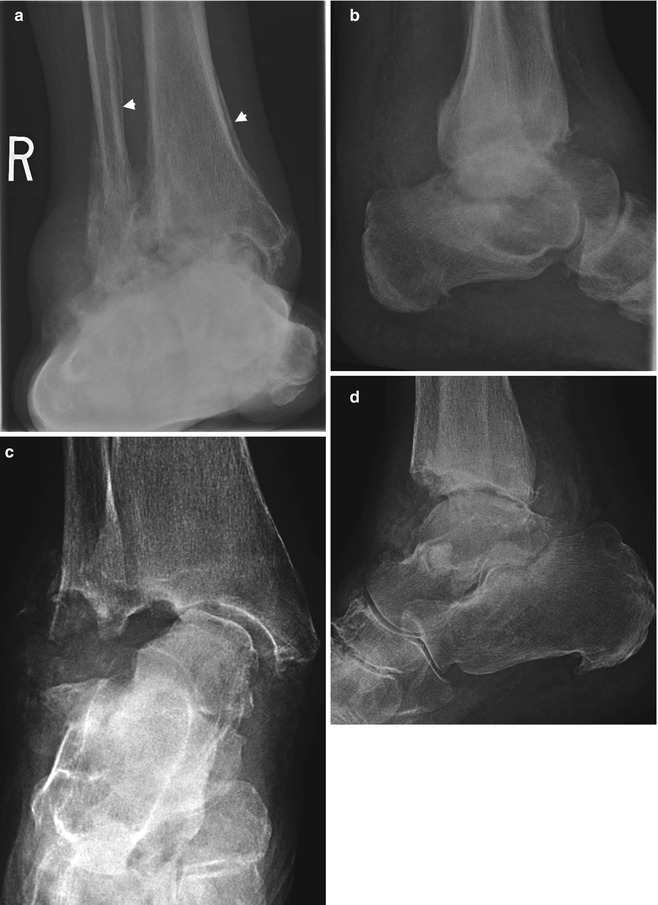
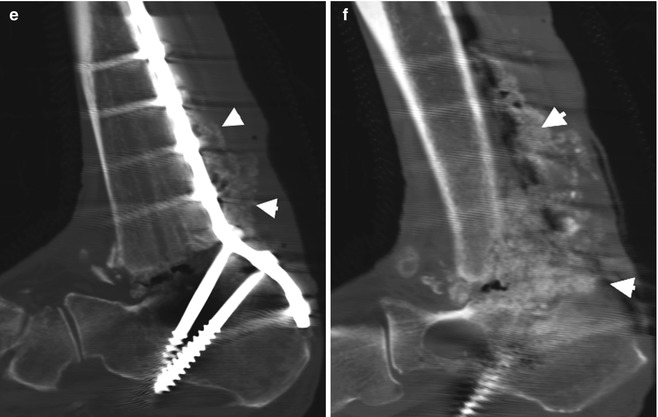
Fig. 14.2
A 55-year-old male diabetic with neuropathic arthropathy of the ankle joint. (a) AP and (b) lat radiographs demonstrate complete joint space loss, large joint effusion, destruction with partial collapse talar dome, extensive erosions tibia, sclerosis, internal debris, osteophytosis and chronic periosteal reaction (arrowheads) of the tibia and fibula. No soft tissue ulceration identifiable (c, d) in different patients with less advanced secondary degenerative change. (e, f) Sag reformatted CT on bone windows in a different patient demonstrates exuberant new bone formation post-ankle joint fusion which is seen in hypertrophic neuropathic joints
In Stage 0, radiographs are typically normal; however it may demonstrate joint space widening. Radiographs of Stage 1 can show demineralization of the bone and findings of bone damage including fragmentation, disorganization, subluxations or osteoarthrosis with subchondral cystic changes. In Stage 2 there is evidence of healing with callus formation, reabsorption of bony fragments and debris and bony remineralization. Persistent changes of subluxations and bone deformity are often present. These changes also carry into Stage 3, though further rounding and smoothing of bony deformities are seen in this chronic healing stage, and bones can develop subsequent ankylosis and/or superimposed degenerative changes.
Magnetic Resonance Imaging (MRI) (Fig. 14.3)

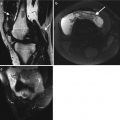
Fig. 14.3
A 44-year-old male diabetic with 6-month history of foot pain diagnosed with Charcot joint with fractures and diffuse soft tissue oedema and tenosynovitis. (a, b) Sag T2 FS of navicular-medial cuneiform (arrow) and 2nd MTPJ, respectively, with extensive bone marrow oedema, tenosynovitis, soft tissue and extensive dorsal subcutaneous oedema without soft tissue ulceration and (c) Sag T1FS PG demonstrate diffuse enhancement areas of oedema without evidence of soft tissue collections
The earliest finding in a neuropathic arthropathy on MRI is bone oedema, with hyperintensity on T2W imaging, often with visible trabecular stress fractures without cortical disruption, seen as hypointensities on T1W imaging. Joint effusion and cartilaginous damage or thinning can be seen. Soft tissue oedema is frequently visible as high signal intensity on T2W imaging of the soft tissues. There are periodically early deforming joint changes with subluxations, even prior to abnormalities on radiograph, though this is more prominent in the subsequent stages. Stage 1 changes encapsulate all of those seen in Stage 0 with progression of bony deformities and damage. In Stage 2, there tends to be improvement in the degree of bony and soft tissue oedema, with development of callus. In Stage 3, the acute oedematous changes have resolved, and persistent bony deformities and changes of osteoarthrosis are seen.
CT (Fig. 14.4)
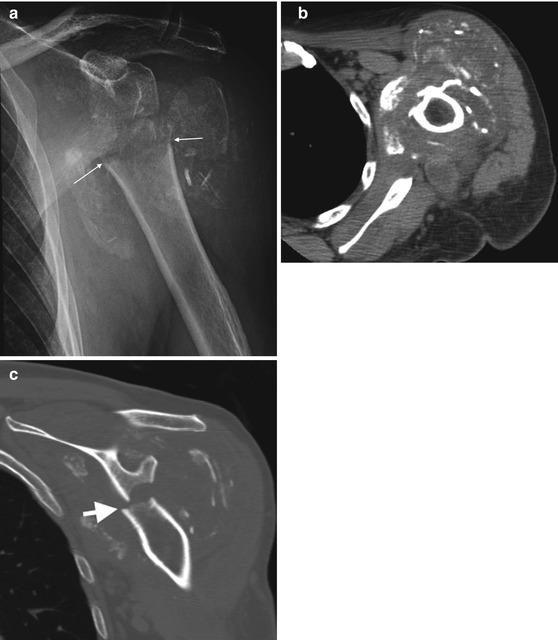
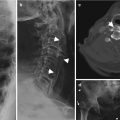
Fig. 14.4
Neuropathic arthropathy of the shoulder on (a) AP radiograph demonstrating diffuse soft tissue and joint swelling, multiple fractures with variable degree of osteolysis of bone fragments, bony debris, disorganization and dislocation without increased density in keeping with an atrophic neuropathic type joint. Note the straight transverse margin surgical neck humerus fracture (arrows); this is surgical like and should always raise possibility of a neuropathic joint when seen. (b) Axial soft tissue and (c) Cor reformatted on bone windows CT of the same joint demonstrating similar changes as described above
CT will demonstrate similar bony and joint findings as described in MRI although it cannot assess bone marrow oedema and is limited in assessing the soft tissues. Occasionally CT will be acquired for a detailed bone assessment prior to surgery.
Ultrasound (Fig. 14.5)
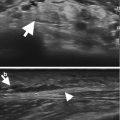
Fig. 14.5
Ultrasound of Charcot ankle joint demonstrating (a) increased internal flow on colour Doppler in keeping with active synovitis surrounding echogenic internal loose bodies (arrows) confirmed as avulsed bony fragments on radiographs (not shown) and (b) extensive periarticular tendinosis and tenosynovitis
Ultrasound has a limited role. It is excellent in assessing related soft tissue pathology, excluding soft tissue collection and assessing joint effusions.
Nuclear Medicine
This has a limited role. The involved joint will demonstrate increased osteoblastic activity and increased uptake on bone scan, but this can be inferred from radiographic findings.
Related posts:

Stay updated, free articles. Join our Telegram channel

Full access? Get Clinical Tree


