Overview
The human circulatory system is extremely complex. Blood flow is influenced by many factors:
- 1.
The heart influences the strength and amount of ejected blood.
- 2.
The elastic arteries store energy during systole and maintain blood flow during diastole.
- 3.
The muscular arteries maintain tone.
- 4.
The arterioles, capillaries, and the venules supply blood to the different organs.
- 5.
The veins ensure adequate return of blood to the heart.
Introduction
At each level, anatomy and physiology contribute to a steady supply of oxygen by maintaining blood flow. Some of the factors responsible for this coordinated action can be measured and described in reasonably simple terms, but many others are complex and difficult to grasp.
Keeping these limitations in mind, this chapter presents a basic review of the dynamics of blood flow through the circulation, some of the factors that influence blood flow, and the hemodynamic consequences of arterial and venous occlusive disease. These considerations are helpful in understanding the normal physiology of blood circulation and the abnormalities that can occur in the presence of vascular obstruction.
Physiologic Factors Governing Blood Flow and Its Characteristics
Arterial and venous compartments
For blood flow to occur between any two points in the circulatory system, there must be an energy difference between these two points. Usually, this difference in energy levels is due to a blood pressure difference. The circulatory system generally consists of a high-pressure, high kinetic energy arterial reservoir and a large venous pool with low pressure and low kinetic energy. These reservoirs are connected by a system of distributing branch arteries and the microcirculation, which consist of arterioles and capillaries ( Fig. 1.1 ).
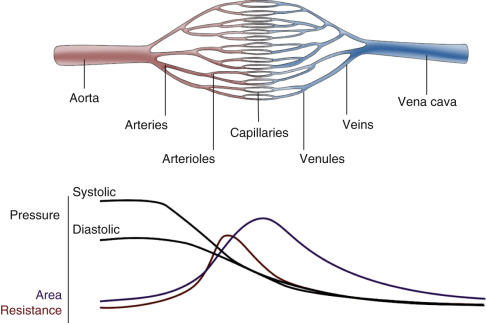
As blood flows through the circulatory system, energy is continuously lost because of the friction between the layers of flowing blood. Both pressure and kinetic energy levels decrease as the red cells transit from the arterial to the venous system. The energy necessary for blood flow is continuously restored by the pumping action of the heart during systole, stored in the elastic wall of the aorta and large arteries, and released during diastole. The generated arterial pressure forces blood to move from the arterial system into the venous system and maintains the arterial pressure and the energy difference needed for blood to keep flowing.
The arterial system has high energy levels as a result of the large volume of rapidly flowing blood and the high pressure in the arterial reservoir. The pumping action of the heart and the mechanical characteristics of arteries work synergistically to maintain adequate volume, flow, and pressure in the arteries. This is in part achieved by maintaining a balance between the amount of blood that enters and leaves the arterial reservoir. The amount that enters the arteries during a cardiac cycle is the stroke volume. The amount that leaves depends on the arterial pressure and on the total peripheral resistance, which is controlled, in turn, by the amount of vasoconstriction in the microcirculation. Both can change from beat to beat.
Under normal conditions, blood flow to all the body tissues is adjusted according to the tissues’ particular needs at a given time. This adjustment is accomplished by local alterations in the level of arteriolar vasoconstriction within a given organ. Maintenance of normal volume and pressure in the arteries thus ensures the distribution of blood flow, and therefore oxygen delivery, to all parts of the body and helps regulate cardiac output.
Potential and kinetic energy
The physical factors that govern how blood once ejected from the heart dissipates energy as it transits through the circulation are related to friction, resistance, and the influences of laminar and turbulent flow. The basic relationships between flow, pressure, and resistance as summarized by Bernoulli’s equation, Poiseuille’s law, and Poiseuille’s equation are discussed. The connecting vascular channels have intrinsic resistances that connect either in parallel or in series. These interconnections modulate how blood flows through the circulation.
The main form of energy stored in flowing blood is the potential energy due to the pressure distending the vessels. This is created by the pumping action of the heart. However, some of the energy stored in blood is kinetic and a direct function of its velocity. Usually, the kinetic energy component is small compared with the pressure energy, and under normal resting conditions, it is equivalent to only a few millimeters of mercury or less. The kinetic energy of blood is proportional to its density (which is stable in normal circumstances) and to the square of its velocity. In essence, over relatively straight arterial segments, the sum of kinetic (blood flow) and potential (blood pressure) energy is constant. The equation that summarizes this relationship is Bernoulli’s equation ( Fig. 1.2 ). If the artery lumen increases, kinetic energy is converted back into pressure (potential energy) as velocity decreases. Conversely, if the artery lumen narrows, the potential energy is converted into kinetic energy. Therefore within certain limits, important increases in kinetic energy occur in the systemic circulation when blood flow is high (e.g., during exercise) and in mildly stenotic lesions where luminal narrowing leads to increases in blood flood velocities. The effects of gravity due to differences in height of the blood vessel (the term ρ gz in the equation) are normally neglected over short arterial segments especially if they are oriented along the horizontal plane.

Energy differences related to differences in the levels of body parts
There is a large variation in the potential energy of blood due to differences in posture. For example, in the standing position the pressure in the feet is increased by an amount that is proportional to the height of the column of blood resting on the blood in the legs. This hydrostatic pressure increases the transmural pressure and the distention of the vessels. Gravitational potential energy (potential for doing work related to the effect of gravity on a free-falling body), however, is reduced in the dependent parts of the body by the same amount as the increase resulting from hydrostatic pressure. Therefore differences in the level of the body parts do not usually lead to changes in the driving pressure along the vascular tree unless the column of blood is interrupted, as may be the case when the venous valves close. Changes in energy and pressure associated with differences in height are noticeable with changes in posture or with activation of the calf pump muscles during walking .
Energy differences due to laminar flow
As a hemodynamic approximation, blood flow is said to be laminar because blood flows in concentric layers or laminae. Each infinitesimal layer flows with a different velocity. In theory, a thin layer of blood is held stationary next to the vessel wall at zero velocity because of an adhesive force between the blood and the inner surface of the vessel. The next layer flows with low velocity, but its movement is delayed by the stationary layer because of friction between the layers, generated by the viscous properties of the fluid. The second layer, in turn, delays the next layer, which flows at a greater velocity. The layers in the middle of the vessel flow with the highest velocity and the basic physics underlying this effect are such that the mean velocity averaged across the vessel is half of the maximal velocity measured in the center. Because the rate of change of velocity is greatest near the walls and decreases toward the center of the vessel, a velocity profile in the shape of a parabola exists along the vessel diameter, and this type of blood flow is typically referred to as laminar flow ( Fig. 1.3A ).

Loss of energy during blood flow occurs because of friction, and the amount of friction and energy loss is largely determined by the dimensions of the vessels. In a small diameter vessel, especially in the microcirculation, even the layers in the middle of the lumen are relatively close to the wall and are thus delayed considerably, resulting in a significant opposition or resistance to flow in that vessel segment. In contrast, the central core of blood is far from the walls in large arteries, and the frictional energy losses are less important. As indicated later, friction and energy losses increase if laminar flow is disturbed.
In a cylinder tube model of radius, R , the linear velocity, v , of blood flow in a given lamina located at a given radial distance, r , from the center is directly proportional to the pressure difference, Δ P , between the ends of the tube and the square of the radius and is inversely proportional to the length of the tube and the viscosity of the fluid. This is summarized by Poiseuille’s equation for velocity:
v(r)=(ΔP4ηL)(R2−r2)
For volume flow, the equation can be integrated showing that volume flow, Q , is proportional to the fourth power of the vessel radius:
Q=(πΔP8ηL)(r4)
Because volume flow is proportional to the fourth power of the radius, even small changes in radius can result in large changes in volume flow. For example, a decrease in radius of 10% would decrease volume flow in a tube model by about 35% and a decrease of 50% would lead to a 95% decrease in volume flow. Because the length of the vessels and the viscosity of blood do not change much in the cardiovascular system, alterations in volume blood flow occur mainly as a result of changes in the radius of the vessels and in the difference in the pressure energy level available for blood flow.
Poiseuille’s equation can be rewritten as follows:
R=ΔPQ
The resistance term, R , depends on the viscous properties of the blood and on the dimensions of the vessels. Although these parameters cannot be measured in a complex system, the pressure difference, Δ P , and the volume blood flow, Q , can be measured, and the resistance can thus be calculated as a systemic vascular resistance. Because resistance is equal to the pressure difference divided by the volume flow (the pressure difference per unit flow), it can be thought of as the pressure difference needed to produce one unit of flow and therefore can be considered as an index of the difficulty in forcing blood through vessels.
Vessel Branching and Energy Dissipation.
Poiseuille’s law applies to constant laminar flow of a simple Newtonian fluid (such as water) in a rigid tube of uniform diameter. In the blood circulation, these conditions are not fully met because blood is a nonnewtonian fluid and most vessels do not stay straight without branching. Instead, the resistance is influenced by the presence of numerous branch vessels with a combined effect similar to that observed in electrical circuits. In the case of vessels in series, the overall resistance is equal to the sum of the resistances of the individual vessels, whereas in the case of parallel vessels, the reciprocal of the total resistance equals the sum of the reciprocals of the individual vessel resistances. Thus, the contribution of any single vessel to the total resistance of a vascular bed, or the effect of a change in the dimension of a vessel, depends on the presence and relative size of the other vessels linked in series or in parallel.
In addition, deviations from the conditions to which Poiseuille’s law applies also occur in relation to changes in blood viscosity, which in turn is affected by hematocrit, temperature, vessel diameter, and rate of blood flow.
Loss of Laminar Flow Patterns.
Various degrees of deviation from orderly laminar flow occur in the human circulation. Minor factors responsible for these deviations include changes in blood flow velocity during the cardiac cycle as a result of acceleration during early systole and deceleration in late systole and diastole and alterations of the lines of flow due to small changes in the diameter of the vessel. Alterations in the blood flow profiles occur at curves ( Fig. 1.4 ), at bifurcations ( Fig. 1.5 ), at any branch point, and at stenotic lesions. Once altered, the laminar (parabolic) velocity profile is often not reestablished for a considerable distance. Instead, the velocity distributions can remain flattened within and just distal to stenotic lesions as plug flow ( Fig. 1.3B ), be skewed after curves and branches ( Fig. 1.4 ), or create a jet at stenotic lesions.


In certain circumstances, laminar flow can evolve into a blood flow pattern that is mixed: a flow profile that has both forward and backward flow velocity components across the diameter of the artery. The transition zone where the lamina has zero velocity is then referred to as the site of boundary layer separation. This phenomenon can occur at branch points and is classically described at the carotid artery bifurcation ( Fig. 1.5 ). At the carotid bifurcation, the blood flow profile in the distal common carotid artery tends to migrate toward the internal carotid artery while a zone of boundary layer separation evolves in the proximal internal carotid artery ( Fig. 1.5 ) opposite to the flow divider. This zone of flow separation can also occur on the opposite side, near the origin of the external carotid artery.
Laminar flow may be altered, become disturbed or fully turbulent, even in a uniform tube. Turbulence occurs when the velocity of blood flow reaches a certain velocity within a tube of a given diameter. This transition point is expressed by the dimensionless Reynolds number (Re ):
Re=2rvρη

Related posts:
 Doppler Flow Imaging and Spectral Analysis
 Ultrasound Diagnosis of Lower Extremity Venous Thrombosis
 Evaluating Carotid Plaque and Carotid Intima-Media Thickness
 Assessment of Upper Extremity Arterial Disease
 Ultrasound Assessment Following Endovascular Aortic Aneurysm Repair
 Evaluation of Organ Transplants
Stay updated, free articles. Join our Telegram channel

Full access? Get Clinical Tree


