and Rakhi Kaila2
(1)
School of Physics, University of New South Wales, Sydney, NSW, Australia
(2)
School of Medicine, University of New South Wales, Sydney, NSW, Australia
Abstract
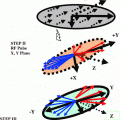
In the presence of an external static magnetic field H0 say applied in the Z-direction the isolated non-interacting (no quantum correlation) spins will try to align themselves along the field. The spins do not stay stationary along the Z-direction. Instead they precess (rotate) randomly at a resonance frequency of ω0 around the field H0. Here ω0 = γ H0, γ being the gyromagnetic ratio (GMR) = (μb/ђ), ђ is the angular Planck’s constant and μb is the fundamental dipole magnetic moment moment of an atom called as the Bohr magneton. The frequency ω0 is referred to as the Larmor frequency. Now if an additional RF electromagnetic field say H1 in the form of a pulse is applied along a perpendicular direction to H0, say in the X-direction the angle of precession around the Z-direction of the spins acquires new angle α = (γH1 τ). This angle α is called as the flip angle and the time τ is called as the pulse time. This simplified picture is true if the applied RF signal has a single frequency and is in exact resonance with the natural frequency of vibration of a single spin i.e. the Larmor frequency. But the pulse has a bandwidth of frequencies Ωi. Further a single spin is not in vacuum and is surrounded by many others of varied nuclear structure. The angle α should thus be α = (Ωi − ω0) τ, different angle for each frequency. In fact it should be α = (Ωi − ω0) T, where T is the time when signal is measured and the time T ≫ τ. The response of the pulse is measured as a decay of the maximum amplitude with time. The rate of decay will be different in different directions. In the X–Z and Y–Z planes it is taken as T1 and in X–Y plane it is T2. The mapping of the anisotropic structure of T1 and T2 in different directions (X, Y, Z) leads to T1 and T2 weighted images.
6.1 T1 and T2 Weighted Images
In the presence of an external static magnetic field H0 say applied in the Z-direction the isolated non-interacting (no quantum correlation) spins will try to align themselves along the field. The spins do not stay stationary along the Z-direction. Instead they precess (rotate) randomly at a resonance frequency of ω0 around the field H0. Here ω0 = γ H0, γ being the gyromagnetic ratio (GMR) = (μb/ђ), ђ is the angular Planck’s constant and μb is the fundamental dipole magnetic moment of an atom called as the Bohr magneton. The frequency ω0 is referred to as the Larmor frequency. Now if an additional RF electromagnetic field say H1 in the form of a pulse is applied along a perpendicular direction to H0, say in the X-direction the angle of precession around the Z-direction of the spins acquires new angle α = (γH1 τ). This angle α is called as the flip angle and the time τ is called as the pulse time. This simplified picture is true if the applied RF signal has a single frequency and is in exact resonance with the natural frequency of vibration of a single spin i.e. the Larmor frequency. But the pulse has a bandwidth of frequencies Ωi. Further a single spin is not in vacuum and is surrounded by many others of varied nuclear structure. The angle α should thus be α = (Ωi − ω0) τ, different angle for each frequency. In fact it should be α = (Ωi − ω0) T, where T is the time when signal is measured and the time T ≫ τ. The response of the pulse is measured as a decay of the maximum amplitude with time. The rate of decay will be different in different directions. In the X–Z and Y–Z planes it is taken as T1 and in X–Y plane it is T2. The mapping of the anisotropic structure of T1 and T2 in different directions (X, Y, Z) leads to T1 and T2 weighted images.
6.2 The k (Wave Number)-Space Imaging
Once the scanning process is over, one has to convert the data obtained in the k (wave number) space to the real (x, y, z) space. The T1 and T2 weighting image, and many other methods, are commonly used techniques, in MRI. The spins have to be selected by their frequency band content, where there resonance frequency lies. Frequency content of each of the species of nuclei is different. The spectroscopic content of the different species in the X, Y, Z directions, can be measured. The frequency selection enables content resolution of the various species in the image. In order to depict sensitivity and resolution in an image one uses the Fourier Transform (FT) imaging technique. In this method one uses the spectrum collected, due to the response to a series of RF pulses of duration τ and, a time T in-between the pulses. Repeating τ and T one can collects data for different frequency bands of interest and over various intervals of time. One needs to reduce the total data collection time, and perform T1 and T2, measurements, and minimizes time of exposure to the patient.
Stay updated, free articles. Join our Telegram channel

Full access? Get Clinical Tree


