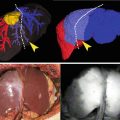
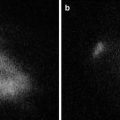
Fig. 27.1
ICG solution injection
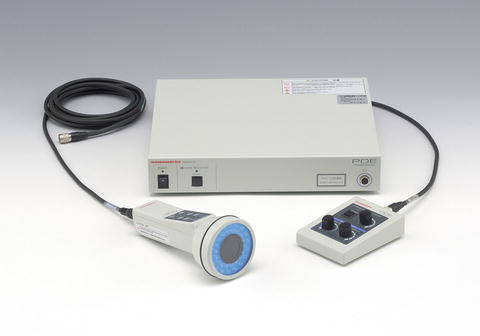
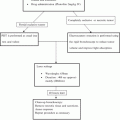
Fig. 27.2
Photodynamic eye (PDE) camera (Hamamatsu Photonics, Hamamatsu, Japan)
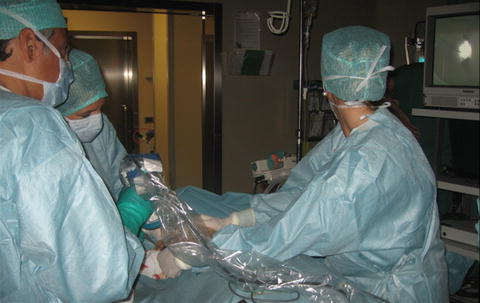
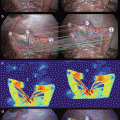
Fig. 27.3
Lymphatic drain real-time visualization
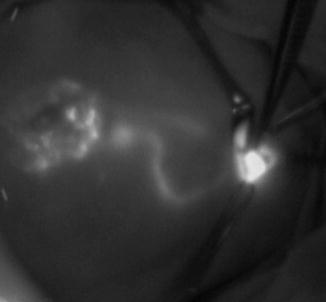
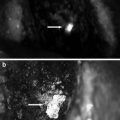
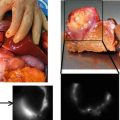
Fig. 27.4
Fluorescent lymph node visualization (permission by Kobe City Medical Center General Hospital, Japan—Hamamatsu)
The number of sentinel nodes (ICG positive, 99mTc positive, or both) removed from each patient was noted. Patient characteristics were also recorded.
Statistical Methods
The study was designed to determine whether the ICG method was equivalent to the Tc method—considered the gold standard—in terms of its ability to detect SNs.
Let A = number of Tc-positive and ICG-positive SNs detected, B = number of Tc-positive and ICG-negative SNs detected, and C = number of Tc-negative and ICG-positive SNs detected. The total number (N) of SNs detected is therefore N = (A + B + C); the proportion of SNs (P Tc) detected by the Tc method is (A + C)/N; and the proportion of SNs (P ICG) detected by the ICG method is (A + B)/N.
The null hypothesis for the equivalence of the two methods is that the difference between the proportions of SNs detected by each method lies outside the interval −δ and +δ, where δ was set as 5 %. Formally, the null hypothesis for equivalence is
 If the null hypothesis is rejected, we may conclude for the hypothesis of equivalence that
 The equivalence hypothesis can be transformed into two one-sided hypotheses: (A) that the difference between the proportions is beyond the lower equivalence margin, null hypothesis A,
  , which, if rejected, permits the conclusion
  and (B) that the difference between the proportions is greater than the upper equivalence margin, null hypothesis B,
  which, if rejected, permits the conclusion
  .
.


 , which, if rejected, permits the conclusion
  and (B) that the difference between the proportions is greater than the upper equivalence margin, null hypothesis B,
  which, if rejected, permits the conclusion
  .
.Hypotheses A and B were tested by comparing the 95 % confidence interval (CI) of the percentage difference in the number of SNs detected between the two methods, with the 5 % equivalence margins (−δ and +δ). A Wald-type sample-based test statistic, based on Lu and Bean algorithm, was used to determine the 95 % CI of the actual difference [38]. To conclude for equivalence, both null hypotheses had to be rejected.
To estimate the number of SNs that needed to be examined, we assumed a detection rate (A + C)/N of 97 % for the gold-standard Tc method, a discordance rate (B + C)/N of 6 %, and set δ at 5 %. We found that 255 SNs are needed to be examined to demonstrate equivalence between the two methods with 80 % power and type I error (α) of 5 % [39, 40]. Sample size was calculated by using PASS 2008 software [41]. Statistical analyses were performed using the SAS statistical software, version 9.2 [41].
Results
Patient and tumor characteristics are shown in Table 27.1. One hundred thirty-four patients provided a total of 246 SNs detected by one or both methods. One, 2, and 3 SNs, respectively, were detected, excised, and examined in 70 (52.2 %), 39 (29.1 %), and 17 (12.7 %) patients; 4–10 SNs were detected and examined in the remaining 8 patients. Tc detected 231 of the 246 (93.9 %) SNs found; ICG detected 245 (99.6 %) of the total SNs found (Table 27.2). The two methods were concordant for 230 of the 246 SNs (93.5 %) examined and discordant for 16 SNs (6.5 %). Fifteen (6.1 % of total) of the latter SNs were detected by ICG and not Tc; the remaining SN (0.4 %) were detected by Tc but not ICG. The difference between the two methods is therefore (15–1)/246 = +5.7 %. Application of the Lu and Bean [15] algorithm yielded 2.6–8.8 % as the 95 % confidence interval (CI) for this difference. Since this CI does not include −5 % (Fig. 27.5), we were able to reject one-sided null hypothesis A and conclude that ICG is not inferior to Tc. However, this 95 % CI does include +5 % (Fig. 27.5), so it was not possible to reject one-sided hypothesis B that ICG is superior to Tc. This does not mean, however, that the ICG method is superior.

Table 27.1
Characteristics of patients and their cancers
Characteristic | N (patients) | % |
|---|---|---|
Tumor size (cm) | ||
≤0.5 | 5 | 3.7 |
>0.5, ≤1 | 33 | 24.6 |
>1, ≤1.5 | 44 | 32.8 |
>1.5, ≤2 | 39 | 29.1 |
>2, ≤3 | 11 | 8.2 |
>3 | 2 | 1.5 |
Histological type | ||
Invasive ductal | 112 | 83.6 |
Invasive lobular | 9 | 6.7 |
Other invasive | 12 | 9.0 |
Ductal intraepithelial neoplasia grade 3 | 1 | 0.7 |
Grade | ||
G1 | 24 | 17.9 |
G2 | 58 | 43.3 |
G3 | 45 | 33.6 |
Not available | 7 | 5.2 |
Median age (range) | 56 (26–80) | years |
Median BMI (range) | 23 (18–40) | kg/m2 |
Table 27.2
Numbers of sentinel nodes identified with the indocyanine green (ICG) and technetium (TC) methods
N | % | |
|---|---|---|
ICG+ Tc+ | 230 | 93.5 |
ICG+ Tc− | 15 | 6.1 |
ICG− Tc + | 1 | 0.4 |
Total SNs | 246 | 100 |

Fig. 27.5
Percentage difference between ICG and radiotracer methods with 95 % confidence interval, in relation to equivalence margins (−5 % and +5 %)
The analysis based on patients was performed by classifying as “concordant” those for whom at least one SN was detected by both methods. As shown in Table 27.3, 121 patients were “concordant” because all SNs removed (range 1–10) were detected by both methods. Among the remaining 13 patients, all were concordant except one. For the single discordant patient, the single SN identified was detected by ICG but not Tc. In addition, a single ICG negative and Tc positive was found in a patient in whom two other SNs were detected by both methods (Table 27.3).
Table 27.3
Numbers of sentinel nodes removed from patients according to whether all nodes were identified by both the ICG and TC methods (n = 121) and whether not all nodes were identified by both methods (n = 13)
N SNs removed | ICG+ Tc+ | ICG+ Tc− | ICG− Tc+ | N patients |
|---|---|---|---|---|
1 | 1 | 0 | 0 | 69 |
2 | 2 | 0 | 0 | 34 |
3 | 3 | 0 | 0 | 12 |
4 | 4 | 0 | 0 | 3 |
5 | 5 | 0 | 0 | 1 |
7 | 7 | 0 | 0 | 1 |
10 | 10 | 0 | 0 | 1 |
Patients in whom all sentinel nodes were identified by both ICG and TC methods (N = 121) | ||||
1 | 0 | 1 | 0 | 1 |
2 | 1 | 1 | 0 | 5 |
3 | 2 | 1 | 0 | 2 |
3 | 2 | 0 | 1 | 1 |
3 | 1 | 2 | 0 | 2 |
5 | 4 | 1 | 0 | 1 |
8 | 6 | 2 | 0 | 1 |
Patients in whom not all removed nodes were identified by both methods (N = 13)
Stay updated, free articles. Join our Telegram channel
Full access? Get Clinical Tree
 Get Clinical Tree app for offline access

| ||||
