Fig. 5.1
Segmental anatomy of the liver based on vascular supply (inferior vena cava, right hepatic vein, middle hepatic vein, left hepatic vein, portal vein (PV) (http://www.siopel.org)
Scanning Technique
A systematic approach will be presented which will cover the required components of a sonographic liver examination. It is crucial that the operator or sonographer establishes a routine by conducting the examination in the same sequence every time to avoid missing any critical findings.
Porta Hepatis
Structures of interest include:
Portal vein—deepest of the three structures and usually most prominent (unless there is underlying pathology)
HA proper and right and left branches
Common bile duct
Technique
The transducer should first be oriented transversely over the right upper quadrant. Because a large portion of the liver is usually situated posterior to the ribs and the lung base, one must ask the patient to hold a deep inspiratory breath. The transducer must then be angled parallel to the structures of the porta hepatis, usually accomplished by rotating it clockwise from the transverse position (so that the part of the transducer previously pointing to the right side of the patient, or 9 oʼclock, then points roughly at 10–11 oʼclock).
At this point, the three main portal structures should be readily identifiable. The portal vein is the deepest of the structures and usually the most prominent unless there is underlying disease such as stenosis or chronic thrombosis. Activating color and spectral Doppler will allow confirmation of monophasic or nonphasic waveforms in the portal vein. In contradiction, the adjacent HA is normally characterized by pulsatile waveforms, characteristic for any healthy systemic artery. Finally, the common bile duct is void of any flow with Doppler interrogation.
Systematic Evaluation
Grayscale
The caliber of the main portal vein, HA, and their right and left branches should be assessed. While Doppler evaluation will allow for confirmation of blood flow through a vessel, the more rapid frame rate of grayscale images is helpful to point out caliber changes. If there is a caliber change, a potentially significant hemodynamic effect can be assessed with Doppler.
Color Doppler
The main portal vein should fill with color if it is patent and should fill with the same color as the HA (Fig. 5.2). If colors on opposite sides of the color spectrum (e.g., red and blue with many vendors) are seen in the same segment of a vessel within one heart beat, then this means that blood is moving towards and away from the transducer during the cardiac cycle—in other words, portal flow is not unidirectional. This can be further detailed with spectral Doppler as below. Please note that it is normal to find colors on the opposing side of the spectrum even in contiguous vessels; this occurs when they physically point in different directions as in the example where one may see “blue” flow (away from the transducer) in the main portal vein and “red” flow in the right portal vein (or towards the transducer). This is simply the product of the main portal vein pointing away and the right portal vein pointing towards the transducer and does not imply bidirectional flow (Fig. 5.3).
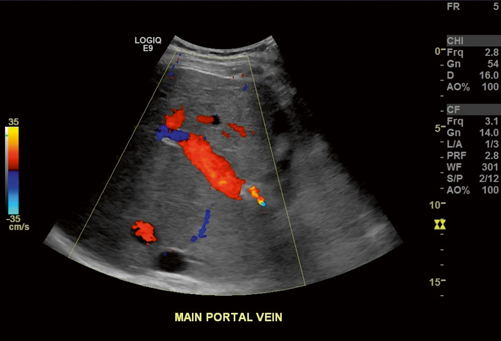
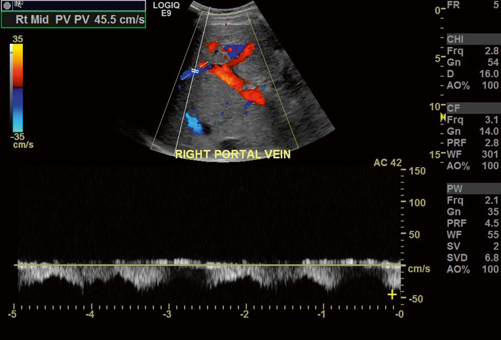
Fig. 5.2
Normal filling of the portal vein with color Doppler. The adjacent hepatic artery (HA) is also red in color indicating that flow is in the same direction, as normally expected, in both vessels
Fig. 5.3
Normal color Doppler appearance of the main, right, and left portal vein branches. Notice that the blue flow of the right portal vein with waveforms below baseline should not be mistaken for flow reversal. This is antegrade flow and is explained by the direction of the right portal vein towards the transducer, whereas the left and main portal veins are physically pointing away from the transducer. Incidentally, the right portal vein waveforms show increased phasicity due to increased pressure transmitted from the inferior vena cava (IVC), hepatic veins and liver parenchyma in this cardiac patient
The HA, in contradistinction to the portal vein, will appear pulsatile with color Doppler, and this will also be further characterized with spectral Doppler.
Spectral Doppler
Waveforms are helpful for identifying structures and including and excluding disease.
Main portal vein waveforms should be unidirectional and therefore on only one side of the baseline on the displayed color graph (Fig. 5.4). The wave should be monophasic (synonymous with nonphasic), but some degree of phasicity is allowed. Pressure is partially transmitted to the portal venous branches from the right atrium and hepatic veins across the hepatic parenchyma. However, a portal vein wave, which reaches baseline or crosses baseline (i.e., hepatofugal flow) should raise concern for portal hypertension. Unidirectional flow with increased phasicity or pulsatility raises concern for right-sided cardiac disease, shunting as can be seen in cirrhosis, or potentially arteriovenous fistula in the appropriate setting. Finally, absent flow is concerning for occlusion whether by bland or tumor thrombus; again, a confirmatory study (such as computed tomography (CT) or magnetic resonance imaging (MRI)) should be considered before definitely diagnosing complete occlusion because slow flow can remain occult even with power Doppler .
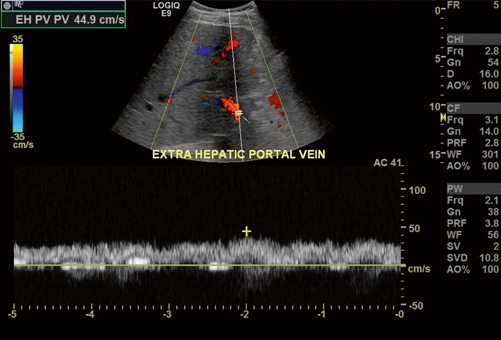
Fig. 5.4
Main portal vein waveforms stay on one side of the baseline and are thus termed monophasic, synonymous with nonphasic. The blood flow is antegrade moving away from the transducer and is represented with “red” flow in the color spectrum and waveforms above the baseline. Please refer to comments in Fig. 5.3 and note that the color and position of the waveforms relative to baseline represent the direction of flow relative to the transducer (and not direction of flow relative to the liver). In Fig. 5.3, antegrade flow in the right portal vein is moving towards the transducer, while in this figure antegrade flow moves away from the transducer
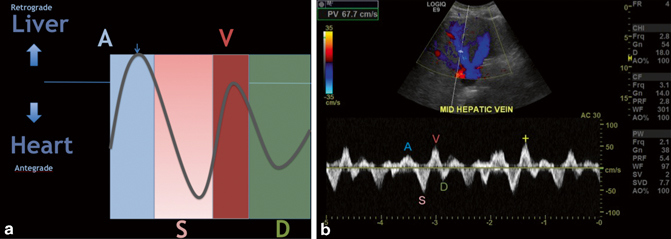
Fig. 5.5
a A, S, D, and V waves represented in diagrammatic fashion. The A wave represents a small amount of flow towards the liver during the atrial kick. The S wave represents flow towards the heart due to decrease in pressure in the atrium during ventricular contraction. The V wave represents atrial overfilling as the ventricle starts to relax; this wave can be below, at, or above baseline in normal patients, but if its amplitude is greater than the S wave, consider right heart or valvular disease. Finally, the D wave represents flow towards the heart during passive filling of the right atrium and ventricle after the tricuspid valve opens. b Normal A, S, D and V waves in a middle hepatic vein
HA waveforms are normally pulsatile and low resistance. That is, a sharp upstroke is seen during systole, and the end-diastolic velocity should be well above baseline with some leeway in postsurgical cases where parenchymal edema may increase the resistance in vascular circuit. The cited normal range of resistive index (RI) varies from publication to publication, but a reasonable range of normal can be considered 0.55–0.70 [5]. An RI below 0.55 is said to be related to decreased resistance which can be caused by upstream stenosis or atherosclerosis. An RI above 0.70 is said to be high resistance and can be caused by downstream stenosis; parenchymal disease (which results in microvascular compression or disease) including cirrhosis, hepatitis, and rejection; and hepatic venous congestion such as, in cardiac disease or occlusive disease such as Budd-Chiari Syndrome [6].
Color Versus Power Doppler
Compared to power Doppler , color Doppler has the distinct advantage of depicting directionality of flow in real time. Power Doppler is more sensitive to flow and is therefore particularly advantageous in areas where flow is not depicted with color Doppler but flow nonetheless suspected. In such cases, the direction of flow is less important and therefore sacrificed in power Doppler to gather evidence for complete occlusion. If flow is seen with power Doppler but not with color Doppler, this is usually said to be related to “slow flow.” If no flow is seen with either technique, then this speaks heavily for complete occlusion and a confirmatory imaging study such as computed tomography angiogram (CTA) may be considered.
Hepatic Veins and IVC
Moving the transducer cranially and oblique along the subcostal margin will allow visualization of this region.
Grayscale
This mode of imaging will allow for rapid assessment of the anatomy. After the right, middle, and left hepatic veins are identified, they should be followed to the confluence with the IVC.
Color Doppler
Unlike in the main portal vein and HA system described above, it is normal to find colors on both sides of the color spectrum in the hepatic veins within one cardiac cycle. This is because hepatic vein and IVC flow is bidirectional and directly related to the cardiac cycle as detailed below.
Spectral Waveforms
Hepatic vein and IVC flow can be characterized four different waveform components, namely, A, S, D, and V waves (shown in Fig. 5.5a, b) and are therefore called triphasic or tetraphasic (depending on whether or not the V wave crosses the baseline). Triphasic and tetraphasic waveforms are both characteristic in normal cases. Rather, it is the individual characteristics of the waveforms which point towards the possibility of disease, but this topic is beyond the scope of this text [6, 8]. A description of these waves in the normal condition is as follows:
The A wave is seen during early systole as the result of the “atrial kick.” Although the atrial kick serves to propel blood into the right ventricle, a small amount of retrograde flow is directed towards the liver and thus towards the transducer. The S wave lies on the opposite side of the baseline relative to the A wave and is related to antegrade flow of blood (towards the heart). This wave represents the relative decreased pressure generated by the contraction of the right ventricle and movement of the tricuspid annulus [7, 8]. The V wave is the result of atrial overfilling as the right ventricle starts to relax and the relative pressure in the right atrium begins to increase as the tricuspid annulus begins to return towards its resting diastolic position. The D wave represents antegrade passive filling of the right atrium and ventricle during diastole (see Fig. 5.5a and b).
Diffuse Parenchymal Changes/Metabolic Disorders
Diffuse parenchymal changes can be best appreciated by comparison to the features of a normal liver noticing anomalies. A normal liver will allow the fibrofatty tissues around the portal veins to appear echogenic, and detail in the posterior aspect of the liver will be preserved (Fig. 5.6a). Chronic parenchymal disease such as fatty infiltration from obesity or alcoholism will usually cause the liver parenchyma to become more echogenic thus reducing the contrast between the parenchyma and the echogenic borders of the portal structures (Fig. 5.6b). In addition, the increased acoustic attenuation in the more echogenic tissues will cause the parts of the liver furthest from the transducer (often the posterior liver with routine scanning technique) to appear more hypoechoic (Fig. 5.6c).
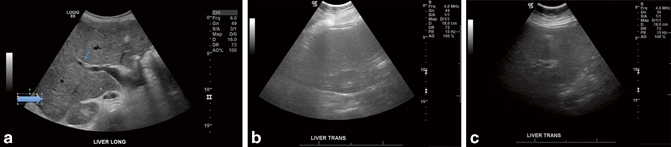
Fig. 5.6
a Normal liver parenchyma. Notice how the parenchymal detail can be seen and nicely contrasts against the echogenic periportal fibrofatty tissues (small arrow). Also, the detail in the posterior liver parenchyma is preserved (large arrow). b Hepatic steatosis. The liver detail is lost and the periportal fibrofatty echogenic tissue contrasts less with the surrounding parenchyma. c Hepatic steatosis. The liver at the posterior aspect of the scan field is hypoechoic due to increased sound attenuation throughout the parenchyma
The liver’s response to insult is often similar regardless of the insult, and the resultant fibrosis/cirrhosis will appear the same regardless of the underlying cause. For example, it should not be surprising that there is no consistent imaging feature that would allow one to distinguish diffuse hepatic disease from Wilson’s disease from other types of hepatocyte injury.
Benign Focal Changes
When evaluating a focal mass, it is useful to keep a few principles in mind. Fluid is anechoic; thus, fluid containing structures such as cysts or cystic components of complex masses will also be anechoic. Fatty tissue, despite what one may read elsewhere, is anechoic to hypoechoic to soft tissue; for proof, simply notice the low echogenicity of the hypodermis on any ultrasound study. However, when fat is encountered as a component of a mass or connective tissue (i.e., angiomyolipoma and perinephric fat), it appears hyperechoic. The reasons for this are beyond the scope of this text, but it is helpful to consider that the ultrasound does not interpret echogenicity simply based on tissue type but rather the speed of sound in the path of the sound wave which is altered by complex tissue interfaces. Because a mixture of fat and other tissue create complex echoes, such fat-containing areas will appear echogenic.
Cysts
Related posts:


Stay updated, free articles. Join our Telegram channel

Full access? Get Clinical Tree


