(1)
Department of Mathematics and Statistics, Villanova University, Villanova, PA, USA
Electronic supplementary material
The online version of this chapter (doi:10.1007/978-3-319-22665-1_2) contains supplementary material, which is available to authorized users.
2.1 Definition
For a given function f defined in the plane, which may represent, for instance, the attenuation-coefficient function in a cross section of a sample, the fundamental question of image reconstruction calls on us to consider the value of the integral of f along a typical line  . For each pair of values of t and
  , we will integrate f along a different line. Thus, we really have a new function on our hands, where the inputs are the values of t and
  and the output is the value of the integral of f along the corresponding line
  . But even more is going on than that because we also wish to apply this process to a whole variety of functions f. So really we start by selecting a function f. Then, once f has been selected, we get a corresponding function of t and
  . Schematically,
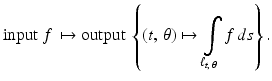
. For each pair of values of t and , we will integrate f along a different line. Thus, we really have a new function on our hands, where the inputs are the values of t and and the output is the value of the integral of f along the corresponding line . But even more is going on than that because we also wish to apply this process to a whole variety of functions f. So really we start by selecting a function f. Then, once f has been selected, we get a corresponding function of t and . Schematically,This multi-step process is called the Radon transform, named for the Austrian mathematician Johann Karl August Radon (1887–1956) who studied its properties. For the input f, we denote by  the corresponding function of t and
  shown in the schematic. That is, we make the following definition.
the corresponding function of t and shown in the schematic. That is, we make the following definition.Definition 2.1.
For a given function f, whose domain is the plane, the Radon transform of f is defined, for each pair of real numbers  , by
, by
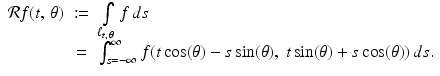
, by(2.1)
A few immediate observations are that (i) both f and  are functions; (ii) f is a function of the Cartesian coordinates x and y while
  is a function of the polar coordinates t and
  ; (iii) for each choice of f, t, and
  ,
,  is a number (the value of a definite integral); (iv) in the integral on the right, the variable of integration is s, while the values of t and
  are preselected and so should be treated as “constants” when evaluating the integral.
are functions; (ii) f is a function of the Cartesian coordinates x and y while is a function of the polar coordinates t and ; (iii) for each choice of f, t, and , is a number (the value of a definite integral); (iv) in the integral on the right, the variable of integration is s, while the values of t and are preselected and so should be treated as “constants” when evaluating the integral.We can visualize the Radon transform of a given function by treating  and t as rectangular coordinates. We depict the values of the Radon transform according to their brightness on a continuum of grey values, with the value 0 representing the color black, 0. 5 representing a neutral grey, and the value 1 representing white. Such a graph is called a sinogram and essentially depicts all of the data generated by the X-ray emission/detection machine for the given slice of the sample. The choice of the term sinogram is no doubt suggested by the symmetry
  as well as by the appearance of the graphs for some simple examples that we will explore next. Sinograms can also be portrayed in color, using an appropriate segment of the rainbow in place of the grey scale.
and t as rectangular coordinates. We depict the values of the Radon transform according to their brightness on a continuum of grey values, with the value 0 representing the color black, 0. 5 representing a neutral grey, and the value 1 representing white. Such a graph is called a sinogram and essentially depicts all of the data generated by the X-ray emission/detection machine for the given slice of the sample. The choice of the term sinogram is no doubt suggested by the symmetry as well as by the appearance of the graphs for some simple examples that we will explore next. Sinograms can also be portrayed in color, using an appropriate segment of the rainbow in place of the grey scale.2.2 Examples
Example 2.2.
As a first example, suppose our patient has a small circular tumor with radius 0. 05 centered at the point (0, 1), and suppose the attenuation-coefficient function f has the constant value 10 there. Now take an arbitrary value of  . In this case, when
  , the line
  will pass through (0, 1) and make a diameter of the circular tumor. Since the diameter of this disc is 2 ⋅ (0. 05) = 0. 1, we get
  . Moreover, for any given
  , the value of
  will be zero except on the narrow band
  .
.
. In this case, when , the line will pass through (0, 1) and make a diameter of the circular tumor. Since the diameter of this disc is 2 ⋅ (0. 05) = 0. 1, we get . Moreover, for any given , the value of will be zero except on the narrow band .Thus, as  varies from 0 to π, the graph will show a narrow, brighter grey ribbon of width 0. 1 centered around
  . In other words, the graph of
  in the
  plane will resemble the graph of the sine function. Similarly, the graph in the
  plane of the Radon transform of a small, bright disc located at (1, 0) will resemble the graph of the cosine function. Figure 2.1 shows the sinograms for these two bright discs. Perhaps these examples helped to motivate the use of the term sinogram for the graph of a Radon transform.
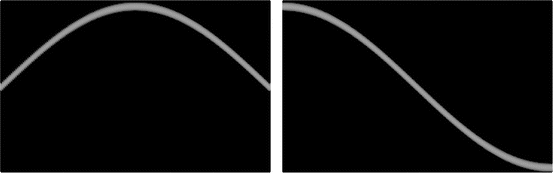
varies from 0 to π, the graph will show a narrow, brighter grey ribbon of width 0. 1 centered around . In other words, the graph of in the plane will resemble the graph of the sine function. Similarly, the graph in the plane of the Radon transform of a small, bright disc located at (1, 0) will resemble the graph of the cosine function. Figure 2.1 shows the sinograms for these two bright discs. Perhaps these examples helped to motivate the use of the term sinogram for the graph of a Radon transform.Fig. 2.1
The sinograms for small, bright circular discs centered at (0, 1) (left) and at (1, 0) (right) resemble the graphs of the sine and cosine functions, respectively.
In the previous example, we considered an attenuation-coefficient function that had a constant (nonzero) value on a finite region of the plane and the value 0 outside of that region. To attach some terminology to functions of this type, suppose  is some finite region in the plane and take
  to be the function that has the value 1 at each point contained in
  and the value 0 at each point not in
  . This function
  is known as the characteristic function, or the indicator function, of the region
  . Thus, in our previous example, we looked at 10 times the characteristic function of a small disc.
is some finite region in the plane and take to be the function that has the value 1 at each point contained in and the value 0 at each point not in . This function is known as the characteristic function, or the indicator function, of the region . Thus, in our previous example, we looked at 10 times the characteristic function of a small disc.When the attenuation-coefficient function is a characteristic function  , its Radon transform is particularly easy to comprehend. Indeed, along any line
  , the value of
  will be 0 except when the line is passing through the region
  , where the value is 1. Thus, for each pair of values of t and
  , the value of
  is equal to the length of the intersection of the line
  with the region
  .
.
, its Radon transform is particularly easy to comprehend. Indeed, along any line , the value of will be 0 except when the line is passing through the region , where the value is 1. Thus, for each pair of values of t and , the value of is equal to the length of the intersection of the line with the region .In general, the object we are testing may comprise a collection of “blobs” of various materials, each with its specific attenuation coefficient. As we shall soon see, the Radon transform of the entire collection will be a composite of the transforms of the separate blobs. Consequently, understanding this basic sort of example will play a central role in assessing the accuracy of various approaches to image reconstruction.
Example 2.3.
For instance, let’s take the region  to be the closed circular disc of radius R > 0 centered at the origin. Then the characteristic function of
  is given by
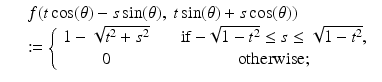
to be the closed circular disc of radius R > 0 centered at the origin. Then the characteristic function of is given byIf we choose a value of t such that | t | > R, then, regardless of the value of  , the line
  will not intersect the disc
  . Thus,
  at every point on
  , and, hence,
  for such t. On the other hand, if | t | ≤ R, then
  intersects
  along the segment corresponding to the parameter values
  in the standard parameterization for the line. The length of this segment is
  . The value of
  is 1 at points in this interval and 0 otherwise. Therefore, for such t, the value of
  is the same as the length of the segment, namely,
  .
.
, the line will not intersect the disc . Thus, at every point on , and, hence, for such t. On the other hand, if | t | ≤ R, then intersects along the segment corresponding to the parameter values in the standard parameterization for the line. The length of this segment is . The value of is 1 at points in this interval and 0 otherwise. Therefore, for such t, the value of is the same as the length of the segment, namely, .In summary, we have shown that
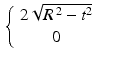
![$$\displaystyle{\mathcal{R}f_{\Omega }(t,\,\theta ) = \left \{\begin{array}{cc} 2\sqrt{R^{\,2 } - t^{2}} & \quad \mbox{ if $\vert t\vert \leq R$,} \\ 0 &\quad \mbox{ if $\vert t\vert > R$.} \end{array} \right.}$$
” src=”/wp-content/uploads/2016/10/A183987_2_En_2_Chapter_Equc.gif”></DIV></DIV></DIV></DIV></DIV><br />
<DIV id=FPar4 class=]()
Example 2.4.
Continuing with the theme of characteristic functions, take  to be the region enclosed by the square whose edges lie along the vertical lines x = ±1 and the horizontal lines y = ±1. This square is centered at the origin and has side length 2. Let
  be the function that takes the value 1 at each point of
  and the value 0 at each point not in
  . That is, let
to be the region enclosed by the square whose edges lie along the vertical lines x = ±1 and the horizontal lines y = ±1. This square is centered at the origin and has side length 2. Let be the function that takes the value 1 at each point of and the value 0 at each point not in . That is, letAs discussed above, for each t and each  , the corresponding value
  , of the Radon transform of
  , will equal the length of the intersection of the line
  and the square region
  . There are two values of
  for which this intersection length is easy to see:
  and
and  . In these cases, the lines
  are vertical or horizontal, respectively. Thus, for
  or
or  , we get
  when − 1 ≤ t ≤ 1 and
  when | t | > 1. In general, the function
  will be piecewise linear in t for each fixed value of
  . Figure 2.2 shows these cross sections for several values of
  .
.
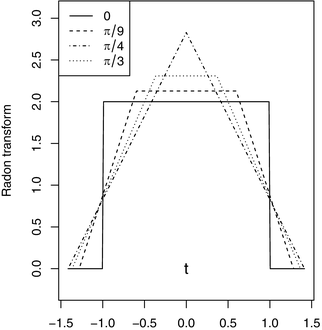
, the corresponding value , of the Radon transform of , will equal the length of the intersection of the line and the square region . There are two values of for which this intersection length is easy to see: and . In these cases, the lines are vertical or horizontal, respectively. Thus, for or , we get when − 1 ≤ t ≤ 1 and when | t | > 1. In general, the function will be piecewise linear in t for each fixed value of . Figure 2.2 shows these cross sections for several values of .Fig. 2.2
Cross sections at  ,
,  ,
,  , and
, and  of the sinogram of the characteristic function of the basic square.
, , , and of the sinogram of the characteristic function of the basic square.Figure 2.3 shows the full sinogram for the function  . Note the symmetry inherited from that of the square region
  . This example will play an important role in the image reconstruction algorithms examined in Chapter 9
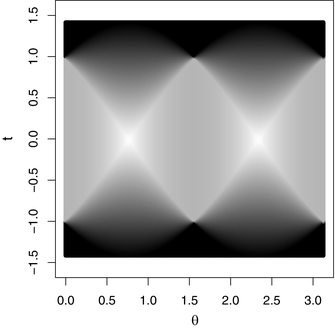
. Note the symmetry inherited from that of the square region . This example will play an important role in the image reconstruction algorithms examined in Chapter 9Fig. 2.3
The sinogram for the characteristic function of the square 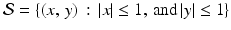 .
.
.Example 2.5.
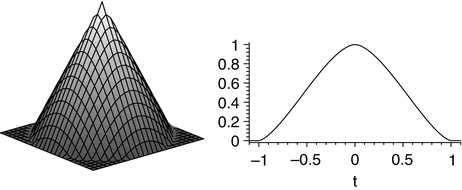
For an example that is not a characteristic function, let f be the function defined by
![$$\displaystyle{ f(x,\,y):= \left \{\begin{array}{cc} 1 -\sqrt{x^{2 } + y^{2}} & \quad \mbox{ if $x^{2} + y^{2} \leq 1$,} \\ 0 &\quad \mbox{ if $x^{2} + y^{2} > 1$.} \end{array} \right. }$$
” src=”/wp-content/uploads/2016/10/A183987_2_En_2_Chapter_Equ2.gif”></DIV></DIV><br />
<DIV class=EquationNumber>(2.2)</DIV></DIV></DIV></DIV><br />
<DIV class=Para>The graph of <SPAN class=EmphasisTypeItalic>f</SPAN> is a cone, shown in Figure <SPAN class=InternalRef><A href=]() 2.4. We have already observed that, on the line
2.4. We have already observed that, on the line  , we have
 It follows that, on the line
  , the function f is given by
 depends only on t and not on
  and that
  whenever | t | > 1. For a fixed value of t such that | t | ≤ 1, the condition t 2 + s 2 ≤ 1 will be satisfied provided that s 2 ≤ 1 − t 2. Thus, for any value of
  and for t such that | t | ≤ 1, we have
whence
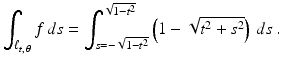
This integral requires a trigonometric substitution for its evaluation. Sparing the details for now, we have
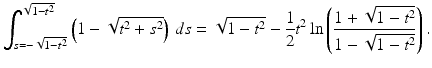
, we have, the function f is given by depends only on t and not on and that whenever | t | > 1. For a fixed value of t such that | t | ≤ 1, the condition t 2 + s 2 ≤ 1 will be satisfied provided that s 2 ≤ 1 − t 2. Thus, for any value of and for t such that | t | ≤ 1, we have(2.4)
(2.5)
(2.6)
Fig. 2.4
The figure shows the cone defined in (2.2) and the graph of its Radon transform for any fixed value of  .
.
.In conclusion, we have shown that the Radon transform of this function f is given by
 is independent of
  , the value of
  corresponds to the area under an appropriate vertical cross section of the cone defined by z = f(x, y). Several of these cross sections are visible in Figure 2.4.
2.3 Some properties of
Get Clinical Tree app for offline access

is independent of , the value of corresponds to the area under an appropriate vertical cross section of the cone defined by z = f(x, y). Several of these cross sections are visible in Figure 2.4.2.3 Some properties of 
Suppose that two functions f and g are both defined in the plane. Then so is the function f + g. Since the integral of a sum of two functions is equal to the sum of the integrals of the functions separately, it follows that we get, for every choice of t and  ,
,
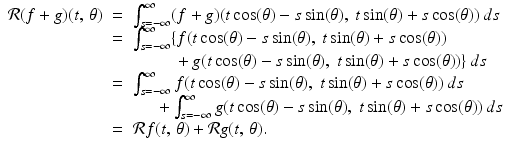 In other words,
  as functions.
, as functions.Similarly, when a function is multiplied by a constant and then integrated, the result is the same as if the function were integrated first and then that value multiplied by the constant; i.e.,  . In the context of the Radon transform, this means that
  .
.
. In the context of the Radon transform, this means that .We now have proven the following proposition.
Proposition 2.6.
For two functions f and g and any constants α and β,
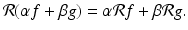
(2.8)
In the language of linear algebra, we say that the Radon transform is a linear transformation; that is, the Radon transform  maps a linear combination of functions to the same linear combination of the Radon transforms of the functions separately. We also express this property by saying that “
 preserves linear combinations.”
maps a linear combination of functions to the same linear combination of the Radon transforms of the functions separately. We also express this property by saying that “ preserves linear combinations.”Example 2.7.
Consider the function
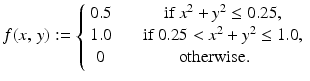 This a linear combination of the characteristic functions of two circular discs. Namely,
  , where
  and
and  are the discs of radii 1 and 0. 5, respectively, centered at the origin.
, where and are the discs of radii 1 and 0. 5, respectively, centered at the origin.Using property (2.8), along with the computation in Example 2.3, it follows that
![$$\displaystyle\begin{array}{rcl} \mathcal{R}f(t,\,\theta )& =& \mathcal{R}(f_{\Omega _{1}})(t,\,\theta ) - (0.5)\mathcal{R}(f_{\Omega _{2}})(t,\,\theta ) {}\\ & =& \left \{\begin{array}{cc} 2\sqrt{1 - t^{2}} -\sqrt{(0.25) - t^{2}} & \quad \mbox{ if $\vert t\vert \leq 0.5$,} \\ 2\sqrt{1 - t^{2}} & \quad \mbox{ if $(0.5) < \vert t\vert \leq 1$,} \\ 0 & \quad \mbox{ if $\vert t\vert > 1$.} \end{array} \right.{}\\ \end{array}$$
” src=”/wp-content/uploads/2016/10/A183987_2_En_2_Chapter_Equ10.gif”></DIV></DIV></DIV></DIV><br />
<DIV class=Para>Figure <SPAN class=InternalRef><A href=]() 2.5 shows the graph of this attenuation-coefficient function alongside a graph of the cross section of its Radon transform corresponding to any fixed value of
2.5 shows the graph of this attenuation-coefficient function alongside a graph of the cross section of its Radon transform corresponding to any fixed value of  and − 1 ≤ t ≤ 1.
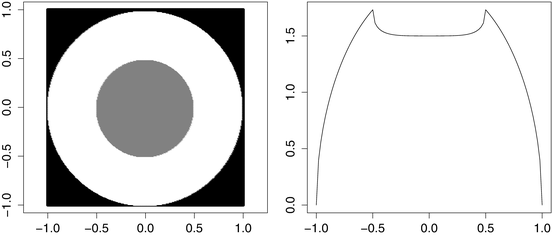
and − 1 ≤ t ≤ 1.Fig. 2.5
The figure shows the attenuation function defined in Example 2.7 alongside the graph of its Radon transform for any fixed value of  .
.
.What happens to the Radon transform if we modify a function either by shifting it or by re-scaling it? That is, suppose we know the Radon transform of a function f, and now look at the functions g(x, y) = f(x − a, y − b), where a and b are some real numbers, and h(x, y) = f(cx, cy), where c > 0 is a positive scaling factor.
In the first case, we obtain the graph of g by shifting the graph of f by a units in the x direction and b units in the y direction. It follows that if we take any line  and shift it by just the right amount, we will get a line
  with the property that
  . What is the correct shift in the value of t? Well, when t = 0, then
  passes through the origin, while the parallel line
  passes through (a, b), as we saw in Exercise 12 of Chapter 1 So, the relationship between
  and the graph of f is the same as that between
  and the graph of g. In other words, the correct shift is
 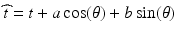 . Figure 2.6 illustrates this correspondence.
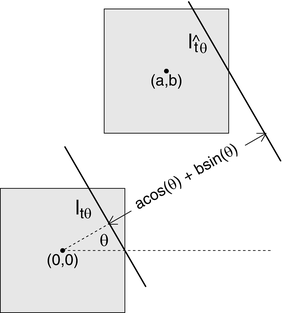
and shift it by just the right amount, we will get a line with the property that . What is the correct shift in the value of t? Well, when t = 0, then passes through the origin, while the parallel line passes through (a, b), as we saw in Exercise 12 of Chapter 1 So, the relationship between and the graph of f is the same as that between and the graph of g. In other words, the correct shift is . Figure 2.6 illustrates this correspondence.Fig. 2.6
The shifting property of  : The lines
  and
and  intersect congruent regions, centered at (0, 0) and (a, b), respectively, along segments of the same length.
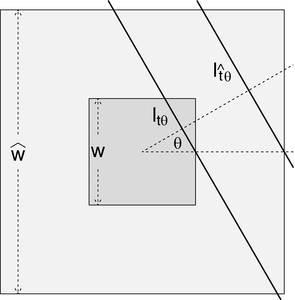
: The lines and intersect congruent regions, centered at (0, 0) and (a, b), respectively, along segments of the same length.In the case of the function h(x, y) = f(cx, cy), we can think of the domain of h as a (1∕c)-times scale model of the corresponding domain for f. Thus, to compute the Radon transform of h for a given choice of t and  , we first have to scale the value of t by the factor c, in order to locate a parallel line that intersects a similar part of the domain of f. Then multiply the corresponding value of the Radon transform of f by 1∕c to get back to the scale of h. That is, for given values of t and
  , we get
 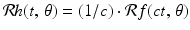 . This relationship is shown in Figure 2.7, in which f and h are taken to be the characteristic functions of two square regions.
, we first have to scale the value of t by the factor c, in order to locate a parallel line that intersects a similar part of the domain of f. Then multiply the corresponding value of the Radon transform of f by 1∕c to get back to the scale of h. That is, for given values of t and , we get . This relationship is shown in Figure 2.7, in which f and h are taken to be the characteristic functions of two square regions.