Introduction
Portal hypertension (PH) is a clinical syndrome characterized by an increase of the pressure gradient between the portal vein (PV) and the inferior vena cava (IVC) above 5 mmHg and develops when there is a resistance in the portal–venous system exacerbated by an increased splanchnic and portal–collateral blood flow.
There are different types of PH, depending on the site of the increased resistance. Most often the resistance occurs within the liver (intrahepatic PH), as in liver cirrhosis; however, it can also be prehepatic, as is the case of portal vein thrombosis (PVT), or posthepatic, as in Budd-Chiari syndrome (BCS), congestive heart failure, constrictive pericarditis, and tricuspidal valve diseases.
Liver cirrhosis represents the most common cause of PH in Western countries, whereas in other parts of the world, schistosomiasis and PVT remain the main cause.
In liver cirrhosis, two different components take part to the increased resistance as structural and dynamic changes, according to the Ohm’s electricity law described by the equation Pressure (P) = Resistance (R) × Flow (F) . Structural changes are caused by distortion of the liver microcirculation by fibrosis, regenerative nodules, angiogenesis, and vascular occlusion. Dynamic changes happen when there is contraction of activated hepatic stellate cells and myofibroblasts that surround hepatic sinusoids and are in the fibrous septa and vascular smooth muscle cells of the hepatic vasculature. The dynamic changes are due to the increased production of local vasoconstrictors (e.g., endothelins, angiotensin-II, norepinephrine, thromboxane A2) and the reduced release of endothelial vasodilators (e.g., nitric oxide). Moreover, there are also dynamic changes that occur in the splanchnic circulation as vascular endothelial growth factor, nitric oxide, and other splanchnic vasodilators that cause splanchnic arteriolar vasodilation and angiogenesis are released; this leads to collaterals formation, plasma volume expansion, and increased cardiac output. All these factors contribute to the rise of the portal pressure by increasing the blood flow toward the liver and play a key role in the development of hypotension, hyperdynamic syndrome, and ascites.
The gold standard for PH assessment in cirrhosis is the measurement of hepatic venous pressure gradient (HVPG), which is obtained by evaluating the difference between wedged hepatic venous pressure (WHVP) and free hepatic venous pressure (FHVP) by a balloon-tipped catheter guided under fluoroscopic control through the right atrium and IVC into the main right hepatic vein (HV). FHVP is obtained by maintaining the tip of the catheter free in the HV, near its opening into the IVC, whereas WHVP is measured after the occlusion of the HV by inflating the balloon at the tip of the catheter. Values of HVPG ≤5 mmHg are normal, whereas an HVPG between 5 and 10 mmHg defines the presence of PH in the absence of clinical manifestations. An HVPG ≥10 mmHg is representative of clinically significant PH (CSPH), which is what matters in the clinical practice because it is associated with the risk of clinical decompensation and onset of complications such as ascites, gastroesophageal varices (GEV) bleeding, hepatic encephalopathy, and hepatorenal syndrome, which represent the main cause of death or liver transplantation. An HVPG ≥12 mmHg is strongly related with high risk of gastrointestinal bleeding, a life-threatening condition. Once cirrhosis is diagnosed and CSPH is confirmed, the clinical management of the patient comprises endoscopy screening for GEV, which allows clinicians to identify the presence of varices and to describe their size and the potential presence of red marks that are indicators of high risk of rupture. However, although HVPG represents the reference standard technique to assess the presence of PH, it is invasive, expensive, implies risks, and is not widely available.
B-mode and Doppler ultrasound (US), integrated in the last years by liver and spleen elastography, represent the first-line imaging in the diagnosis of PH and should be performed every time this condition is suspected because it is noninvasive, repeatable, inexpensive, and able not only to highlight the presence of chronic liver disease (CLD), as it is the case of cirrhotic PH, but also to find other features that reveal the mechanism that leads to PH in cases of noncirrhotic PH. However, the interpretation of US findings of PH needs to be always integrated with clinical and laboratory data.
Which equipment do we need and how do we perform ultrasound to assess the presence of portal hypertension?
Every time we suspect the presence of PH, the liver, spleen, and portal–venous system should be properly examined. US is performed using convex transducers (mean frequencies 3.5–5 MHz). Higher frequency transducers (linear transducers, mean frequencies 7.5–10 MHz) might be needed for children or very lean adult patients or to properly assess the liver surface. The US system needs to have color/power Doppler modes to assess the patency of vessels and to detect hemodynamic parameters of portal and splanchnic arterial and venous circulation. Patients need to fast for at least 6 hours before the examination and are examined in a supine position after 5–10 minutes of rest (food ingestion, posture, and exercise cause hemodynamic changes). Quantitative Doppler measurements should be taken in a suspended normal respiration because deep inspiration/expiration might cause hemodynamic changes. , Age, fever, smoking, and vasoactive drugs or diuretics can modify the hemodynamic parameters of the portal and splanchnic circulation, and they need to be taken into account and properly reported when Doppler measurements are collected.
Limitations of ultrasound examination
The limitations of US for PH assessment are the same as for general abdominal US. The main limitation is bowel gas interposition as it does not allow visualization and examination of the abdominal organs and vessels. US imaging can also be impaired by the presence of massive ascites. Moreover, quantitative Doppler measurements are affected by the interobserver and interequipment variability. For this reason, even though the application of standardized protocols has been proved to reduce such variability, it is preferable the examination be performed by the same operator and using the same US equipment in case of patients in follow-up.
Ultrasound features of portal hypertension in advanced chronic liver disease: Intrahepatic portal hypertension
B-mode ultrasound
Patients with advanced chronic liver disease (ACLD) or known liver cirrhosis may already have signs of CSPH evaluated by HVPG even when in the compensated ACLD (cACLD) stage.
Therefore signs of liver cirrhosis should be always investigated. A normal-looking liver has the left lobe usually smaller than the right lobe, a regular surface, homogeneous echotexture, a sharp margin, and a normal-sized caudate lobe ( Fig. 8.1 ).

Liver cirrhosis is usually characterized by changes in liver volume distribution (right lobe hypotrophy, left lobe hypertrophy, caudate lobe hypertrophy), surface nodularity, rounded margins, heterogeneity, brightness, and coarsening of the hepatic architecture. Several studies have shown an overall B-mode US sensitivity of 65%–95% for ACLD diagnosis, with a positive predictive value of 98%. The most accurate single sign of liver cirrhosis is a nodular surface, which is more sensitive on the posterior surface of the liver than on the anterior surface (86% vs. 53%, respectively). Moreover, the sensitivity improves when the liver surface is assessed using a high-frequency linear transducer ( Fig. 8.2 ).


Caudate lobe hypertrophy and caudate/right lobe (C/RL) ratio are also used in the assessment of liver cirrhosis in which there is hypotrophy/atrophy of the right lobe with hypertrophy of the caudate lobe. To calculate the C/RL ratio we use an axial slice image immediately below the bifurcation of the main PV. Then we draw three lines:
- ■
line 1: a parasagittal line drawn through the right lateral border of the PV;
- ■
line 2: a parasagittal line drawn through the left lateral border of the caudate lobe; and
- ■
line 3: line orthogonal to lines 1 and 2 midway between the PV and the IVC extended to the right liver edge.
The right lobe is measured along line 3, from right liver edge to line 1. The caudate lobe is measured along line 3, between line 1 and line 2. A C/RL ratio <0.60 is considered normal, whereas a value of >0.65 or >0.73 is 96% and 99% likely to be representative of cirrhosis, respectively.
An alternative placement of line 1 has been proposed by Awaya et al. as being more sensitive and specific. Rather than line 1 intersecting the right lateral border of the main PV, they describe drawing line 1 through the right lateral aspect of the right PV bifurcation.
However, it is the combination of different signs that increases the accuracy of US for the diagnosis of cirrhosis ( Table 8.1 ).
| Ultrasound | Finding | Normal | Clinically Significant Portal Hypertension (HVPG ≥ 10 mmHg) * |
|---|---|---|---|
| Liver surface | Regular |
| |
| Liver echotexture | Homogeneous |
| |
| Caudate lobe hypertrophy | No |
| |
| C/RL | <0.65 |
| |
| Spleen |
|
|
|
| PV | Diameter | ≤13 mm | >13 mm |
| Velocity |
|
| |
| Flow direction | Hepatopetal |
| |
| Congestive index | <0.075 | ≥0.08 | |
| SMV | Diameter | <11 mm | ≥11 mm |
| Respiratory variation of diameter | ≥40% | ≤40% | |
| Flow direction | Hepatopetal |
| |
| SV | Diameter | <11 mm | ≥11 mm |
| Respiratory variation of diameter | ≥40% | ≤40% | |
| Flow direction | Hepatopetal |
| |
| Portosystemic collaterals | Absent | Paraumbilical vein recanalization, left gastric vein, short gastric veins, perigastric, perisplenic, splenorenal shunt, paravertebral, pericholecystic, others | |
| HA |
|
|
|
| SA |
|
|
|
| RA | RI | ≤0.65 | >0.65 |
| SMA |
|
|
|
| HVs | Phasicity | Triphasic |
|
* All findings reported in this column have varying degrees of sensitivity and specificity and they may not be present even in cases of severe portal hypertension. HVPG, hepatic venous pressure gradient.
Once cirrhosis has been diagnosed, US provides important information on the presence and severity of PH. Even though the majority of studies have been performed using the presence of GEV instead of HVPG values and the correlation between HVPG and US parameters is only slight/moderate, US signs have a very high positive predictive value for the noninvasive diagnosis of CSPH. Therefore the diagnosis of CSPH can be confidently established when a US sign or a combination of US signs are detected. However, it is important to bear in mind that the absence of US signs of PH cannot definitely rule out the presence of CSPH.
One of the most common signs of PH is splenomegaly, which is defined by a bipolar diameter (craniocaudal length) >12 cm (13 cm in very tall persons) or an area >45 cm 2 measured by a left intercostal approach and using the splenic hilum as landmark to have a reproducible value ( Fig. 8.3 ).

Splenomegaly is detected in 60%–80% of patients with cirrhosis of different etiologies who have developed PH. There is a good correlation between spleen diameter and HVPG values, and spleen size is significantly associated with CSPH.
Splenomegaly is frequently found in patients with a more severe disease as in patients with decompensated liver cirrhosis and esophageal varices (EVs). , Moreover, spleen diameter also correlates with the presence and size of EVs in patients with compensated cirrhosis. , However, in 20% of patients the spleen size can be normal despite the presence of CSPH, especially in alcoholic cirrhosis, , and splenomegaly might be present in many other conditions especially in hematological and infectious diseases. Sometimes, millimetric hyperechoic spots without acoustic shadowing may be found scattered throughout the splenic parenchyma in severe PH ( Fig. 8.4 ). These splenic siderotic and fibrosiderotic nodules, also known as Gamna-Gandy bodies of the spleen, are small focal deposits of iron and calcium within fibrous tissue and elastic fibers followed by fibroblast reaction, and they are the result of microhemorrhage.

Other sonographic findings commonly associated with PH include enlarged diameter of the PV >13 mm, measured at the crossing point of PV by the hepatic artery (HA), and lack of respiratory variation in the splenic vein (SV; see Table 8.1 ). Even though PV dilation has a specificity of 95% for the diagnosis of PH and seems to be consistently associated with the presence of EVs, the sensitivity of this sign is quite poor, ranging from 50%–70% in published studies, meaning that a normal-sized PV does not rule out the presence of PH. Dilation of splenic and mesenteric veins more than 11 mm and the reduction of the respiratory variations of their diameter less than 40% are also very specific signs, and they should be routinely explored (see Table 8.1 ; Fig. 8.5 ).


When the resistance to the blood flow through the liver increases, many alternate pathways called portosystemic collaterals, from which the blood from the gut reaches the systemic circulation, might develop. US imaging is a useful tool to detect the presence of the portosystemic collaterals such as a patent paraumbilical vein, dilated left gastric (coronary) vein, short gastric veins, splenic collaterals, and splenorenal shunt. In patients with known PH, portosystemic abdominal collaterals can be observed in approximately 70%–80% of cases, and they are 100% specific signs of PH. The left gastric or coronary vein is the most common portosystemic shunt, occurring in 80% to 90% of patients, and is imaged in the epigastric region posterior to the left lobe of the liver. The recanalized paraumbilical vein is easily sonographically recognized as a tubular structure at the falciform ligament, exits the anterior aspect of the liver and courses under the skin surface to the umbilicus where a “caput medusa” can be observed. Short gastric collaterals are located in the left hypochondrium, posterior to the upper splenic pole. Other portosystemic collateral vessels include gastric, retroperitoneal/paravertebral, and gallbladder varices. Gastric varices might be seen around the stomach in the epigastrium posterior to the left lobe of the liver and near the spleen. Retroperitoneal/paravertebral varices are very difficult to visualize with US. Careful scanning may reveal tortuous vessels also between the liver and right kidney. A splenorenal shunt might be detected scanning the splenorenal region and represents a connection between the splenic and left renal vein (see Table 8.1 ; Fig. 8.6 ).


Subclinical ascites is an accurate sign of PH in the context of decompensated liver cirrhosis, and US is extremely sensitive to detect it. The perihepatic space is the most usual site of visualization of minimal ascites, and high-frequency transducers improve the sensitivity of its diagnosis (see Table 8.1 ).
Color-doppler and pulsed-doppler
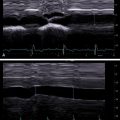
The PV normally exhibits a monophasic, low-velocity Doppler signal with slight respiratory variation. The normal range of portal flow velocity is large but is usually between 20 and 40 cm/s (time averaged peak velocity). The flow is continuous, hepatopetal (from the gut and spleen toward the liver), and should demonstrate little pulsatility. The flow in the splenic vein (SV) and superior mesenteric vein (SMV) is hepatopetal and exhibits a low-velocity and monophasic pattern. HA blood flow is in the same direction as the PV (hepatopetal) and shows a low-resistance (resistive index [RI] <0.70) waveform with continuous forward flow throughout the cardiac cycle. The HVs drain blood from the liver into the IVC. The normal Doppler waveform obtained from the HVs is triphasic ( Fig. 8.7 ).

Portal blood flow reversal develops when the intrahepatic resistance is greater than the resistance inside the portosystemic collaterals. It is a 100% specific sign of PH, and it can be observed in any tract of the portal system (SV, SMV, portal trunk, and lobar portal branches) and in collaterals (coronary/gastric vein, paraumbilical vein). Hepatofugal portal blood flow is usually associated with a more severe liver disease with compromised liver function and with the presence of large shunts, mainly a splenorenal shunt. Slow flow that alternates in direction between anterograde and retrograde is also a sign of PH ( Fig. 8.8 ).

Prominent pulsatility of the PV is also abnormal and may be indicative of PH but also of other conditions such as right heart failure, tricuspid regurgitation, and HV/PV fistula.
PV blood flow velocity can be assessed with good reproducibility if some technical rules aimed to reduce the intraobserver and interobserver variability are carefully followed. The landmark where the portal blood flow velocity should be measured is the crossing point of the PV by the HA. The PV blood flow velocity reduces as the resistance and then the PH increase. A time averaged peak velocity <16 cm/s is strongly suggestive of CSPH, whereas a value <24 cm/s is indicative of cirrhosis. , In some cases the blood flow inside the PV can slow so much as to become stagnant, increasing the risk of developing PVT (see Table 8.1 ; Fig. 8.9 ).


