Fig. 10.1
Depiction of basic B-mode screens of a high frequency linear probe (left) and a curvilinear probe (right)

Fig. 10.2
Examples of curvilinear (left) and high frequency linear (right) probes with corresponding indicator marks
4.
Adjust the depth —Most lung ultrasound exams can be done with a visual depth of 3–4 cm. Each ultrasound screen will have a depth caliper to the side of the image window. Usually this caliper is on the right side of the screen. Adjust the depth using the proper depth button or dial to achieve a maximum depth of 3–4 cm.
5.
Position your patient and begin scanning —It is best for most POCUS pulmonary exams to be done with the patient in the supine position. If clinical condition makes this unavailable, place the patient in their most comfortable position taking note again that air will rise and fluid will fall.
There are three main lung windows (areas commonly scanned) used for POCUS assessment of the pulmonary system. They are known as the upper and lower BLUE-points (Fig. 10.3) and posterior and/or lateral alveolar and/or pleural syndrome (PLAPS) point (Fig. 10.4).


Fig. 10.3
The BLUE points . The upper hand is applied with the little finger against the lower border of the clavicula (in its long axis). The finger tips touch the midline. The lower hand is applied below the first hand. The thumbs do not count. The upper BLUE point is at the base of the middle and ring fingers of the upper hand (upper cross). The lower BLUE point is in the middle of the palm of the lower hand (lower cross). In this subject, the lower BLUE point is near the nipple. This definition makes a symmetric analysis, usually avoiding the heart. The lower edge of the lower hand roughly indicates the phrenic line (arrow), i.e., the end of the lung. Note that the shape of the hands has been studied in order to correct the obliquity of the clavicula, yielding a roughly transversal phrenic line (from Whole Body Ultrasonography in the Critically Ill, Springer)
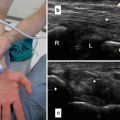
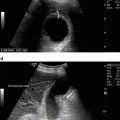
Fig. 10.4
The PLAPS point (PLAPS: posterolateral alveolar and/or pleural syndrome). The probe is applied at the PLAPS point, i.e., the intersection between the transversal line continuing the lower BLUE point (dotted line), and the longitudinal posterior axillary line (arrow), or, as seen here, as far as possible behind. This will immediately detect small and large pleural effusions (and 90 % of cases of alveolar consolidations in the critically ill patient) (from Whole Body Ultrasonography in the Critically Ill, Springer)
These areas allow evaluation of lungs free of obstructive anatomy (such as the heart ) and have been found to be accurate for evaluating for consolidation and effusions [1]. When scanning these areas, the indicator marking on the probe should be pointed toward the patient’s head, achieving a long axis view of the pulmonary system. The probe should be oriented perpendicular to the coronal plane of the body except during the PLAPS point view where the probe should be oriented pointing towards the central axis of the body along the posterior axillary line.
Normal Anatomy of the Pulmonary System
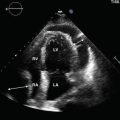
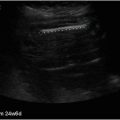
When examining the pulmonary system in any of the three lung windows the anatomy is similar except for one small difference that may occur in the PLAPS point view. The basic images obtained in a normal patient will appear as in Fig. 10.5. The landmarks that first help to orientate one to an image of a lung are the rib shadows. These can best be described as bright hyperechoic arcs with posterior shadowing. It is customary to include two rib shadows and an intercostal space in a viewing window. Above the rib shadows is a layer of chest wall muscle that should appear as striated linear fibers that run across the top of the ribs. Above the muscle layer usually sits a more hypoechoic layer of subcutaneous fat and then skin. These layers also appear linear. Below the level of the ribs and in the intercostal space lies the window the lungs. The first image seen is the pleural interface with the chest wall. This is depicted as a hyperechoic line traversing the intercostal space. In real time imaging, the line can be observed to be sliding back and forth as the patient breaths. Below this line lies the lung parenchyma. This area is displayed as a grainy hypoechoic region below the pleural line. Given the amount of air present, not a lot of lung tissue can be visualized. Therefore the ultrasound is grainy in appearance. It is important to note that a normal lung will have fluid filled alveoli near the pleura. These fluid filled alveoli produce a “reverberation” artifact consisting of hyperechoic arcs that move down to the bottom of the screen. This results in an appearance of moving white lines that move with the slide of the pleura . These are commonly referred to “flashlights,” “comet tails,” or “lung rockets.” Seeing 2–4 of these in an intercostal space is normal.

Fig. 10.5
Basic images obtained in a normal patient
How to Use POCUS as It Pertains to the Pulmonary System: What Does the Evidence Show?
From the ongoing Rational Clinical Examination series published in JAMA of evidence-based clinical diagnoses [2], many disappointing findings were elucidated and discussed concerning the clinical exam and physician gestalt in regard to the pulmonary system.
1.
There is no individual finding or combination of physical exam findings that will accurately rule out airflow limitation .
2.
A clinician’s overall impression showed wide variability in their ability to diagnoses all levels of severity of airflow limitation (15–95 % sensitivity).
3.
There are no combinations of a patient’s medical history or physical examination findings that are sufficient to confirm the diagnosis of pneumonia .
4.
The predictive rules for pneumonia only yield a maximum positive probability of disease of 50 % in the absence of chest radiography.
5.


There was considerable interobserver variability in the recording of a patient’s symptoms and a clinician’s physical examination findings when the diagnosis of pneumonia was considered.
Related posts:
Stay updated, free articles. Join our Telegram channel
Full access? Get Clinical Tree
