Thoracic Imaging of the Intensive Technique of Portable Chest Radiography Communication between Radiologists and Clinicians Catheters and Monitoring Devices Pulmonary Hemodynamics and Edema in ICU Patients Adult Respiratory Distress Syndrome Approximately 30% of all chest radiographs are taken at the bedside. The American Thoracic Society (ATS) still recommends that daily routine chest radiographs be obtained for: Immediate chest radiographs are recommended: A clinical indication for chest radiographs exists in: However, the old policy of “routine daily radiographs” in the intensive care unit (ICU) is no longer followed today, owing to greater awareness of the radiation risks and mounting pressures to curtail costs. Published reports on the frequency of “unexpected” findings on routine chest radiographs range from less than 1% to more than 40%. A study of 525 routine portable chest radiographs taken in a surgical ICU yielded significant cardiopulmonary findings in less than 1% of the patients. In a medical ICU, on the other hand, 45% of 500 routine chest radiographs were abnormal while more than 40% yielded unexpected findings, and ca. 40% of the radiographs had a direct influence on patient management. Recently, a paradigm shift has been observed on the work floor, away from routine daily radiographs to imaging based on clinical indication and for control after interventions. It appears that a differential strategy is called for, depending on whether the setting is a predominantly medical ICU (older, multimorbid patients) or a surgical ICU. While routine chest radiography has indeed been proven inadequate, clinical experience has also taught that the time interval between bedside chest radiographs should not be stretched over several days. Interpreting pulmonary opacifications in an ICU patient frequently involves consideration of the aspect “alterations over time,” and this information might be lost if control radiographs were spread over too-long a period. In the absence of automatic exposure control, the exposure (dose) must be estimated by the technologist. The principal variables are: Changing the tube voltage or kilovoltage (in kV) significantly affects image contrast. No single guideline is given in the literature, with values ranging from 70 to 125 kV. When the kilovoltage is reduced by 20% (e. g., from 100 to 80 kV), the milliampere-seconds (mAs) value must be approximately doubled to deliver the same dose. The film–focus distance (FFD) is controlled manually. It should be remembered that even small changes in the FFD result in sizable dose changes. For example, changing an FFD of 1 m by just 10 cm will cause a 20% change in dose. An FFD of 1 m can be used for bedside radiography in either the sitting or supine position. An FFD of 1 m allows a shorter exposure time than the FFD of 1.8 m that is typically used for upright chest radiographs. This is advantageous for dyspneic patients who are unable to perform breath-holds. Motion artifacts are more likely to occur when exposure times exceed 10 ms. The x-ray source should not be closer than 1 m to the film, as this would result in undesired magnification. Also, most grids require a minimum distance of 1 m. Radiographs without a grid. In the majority of institutions, portable chest radiographs in ICU patients are taken without a grid. Radiographs without a grid have poorer quality in the high-absorption regions of the mediastinum and retro-cardiac space, especially in heavy-set patients. This results in poorer delineation of lines and tubes. Retrocardiac and retrodiaphragmatic abnormalities, such as infiltrates and small pleural effusions, are difficult to detect. It is uncertain, however, whether the poorer imaging characteristics of gridless radiographs actually affect the management of ICU patients. The authors are unaware of any studies on this topic. Radiographs with a grid. The use of the grid technique in chest radiography requires a higher dose than radiography without a grid (factor of 3–6 = ca. 2 exposure points). or grid encasement that can be slipped over a standard cassette. Disadvantages of these grid cassettes are the increased weight of the assembly and the need for precise centering. The advantage of a linear grid over a focused grid is that only one direction is vulnerable to off-centering (perpendicular to the grid lines); angulation of the beam along the direction of the grid lines will not adversely affect image quality. The higher the grid ratio, the smaller the tolerance angle before a “grid effect” will occur (e.g., 0.5° with an 8 : 1 grid and 10° with a 4 : 1 grid). The tolerance angle is asymmetrical in a parallel grid, being greater on the side that is farther from the x-ray tube. “Hole grids” are less sensitive to grid effects but are less effective in reducing scattered radiation. Chest radiographs in ICU patients are usually obtained in the supine position. On the one hand, it is good practice to position the patient “as upright as possible” to eliminate potential sources of error in the interpretation of supine films. But it is equally true that a good supine radiograph still has greater diagnostic utility than a poor radiograph in the sitting position. Consequently, patients should be elevated to a sitting position only if their general condition will allow it. Additional views. Some clinical questions may require the acquisition of additional radiographic views: 1. Cross-table views of the supine patient with a laterally placed cassette may be useful for the localization of pathology in the retrocardiac space and posterior mediastinum. 2. Left or right lateral decubitus views with a cross-table beam may be ordered to differentiate an effusion from pleural plaque or intrapulmonary infiltrate. 3. Tangential views in an oblique anteroposterior (AP) projection are useful for detecting an anterior pneumothorax. 4. A 60–70-kV radiograph in the supine position or with the right or left side elevated is useful for detecting rib fractures. Indications 2 to 4 can be addressed more easily and efficiently with bedside ultrasonography in cases where an experienced sonographer is available. Incomplete visualization of the lungs. The radiographs should completely cover the lung fields with no cut-off of the apices or costophrenic angles (Fig. 2.1). Incomplete visualization of devices. All tubes and lines should be defined fully and with adequate contrast, especially in the initial radiograph. This requires complete visualization of the pulmonary apex and, if necessary, the distal cervical soft tissues for evaluating a central venous catheter. The radiograph should include the upper abdomen to define the position and tip of a nasogastric tube. It can be difficult in heavy-set patients to distinguish a tracheostomy tube from a nasogastric tube in the high-absorption region of the mediastinum and upper abdomen; this may require the special processing of digital data (window leveling, edge-enhancing filter) or even repeating the exposure at a higher dose, greater collimation, or a different patient position. Another option is to opacify the device with radiographic contrast medium. Undesired oblique projection. The medial ends of the clavicles provide anterior landmarks for detecting an oblique projection, while the spinous process of the upper thoracic vertebrae serve as posterior landmarks. In a patient with a symmetrical physique, these landmarks should be symmetrically positioned in an unrotated frontal view. If the view is rotated, the lung that is more posterior will appear smaller and more opaque (whiter) and the mediastinum will appear widened (Fig. 2.2). Undesired lordotic projection. The central ray is angled toward the patient’s head in a lordotic view, causing the lung fields to appear foreshortened and projecting the diaphragm at a higher level. A lordotic projection will inevitably occur when the patient lies flat and the x-ray machine is positioned at the foot of the bed, causing relative angulation of the central ray (Fig. 2.3). The easiest way to correct the projection is by elevating the patient’s upper body. Inadequate depth of inspiration. If the radiograph is not taken at full inspiration, both lungs will show increased opacity making it more difficult to distinguish between atelectasis and pneumonia. The heart will be transversely oriented and appear enlarged, and there will be apparent widening of the mediastinum (Fig. 2.4). An adequate depth of inspiration is confirmed on supine radiographs by noting that the hemidiaphragm is well defined in the midclavicular line (MCL) at the level of the anterior fifth rib. Fig. 2.1 Incomplete visualization. Tension pneumothorax with incomplete visualization of the left costophrenic angle. Fig. 2.2 Oblique projection. This view is rotated to the right, causing an apparent widening of the mediastinum on the right side. Note the asymmetric position of the heads of the clavicles. Fig. 2.3 Lordotic view. The stand for the x-ray tube was placed too near the foot of the bed, causing the central ray to be angled toward the patient’s head. This causes an apparent foreshortening of the lung and elevation of the diaphragm. Normally the anterior first rib is projected below the clavicle, but it appears above the clavicle in this projection. Fig. 2.4 a, b Good and poor inspiration. Note the apparent change in lung density and shape of the cardiac silhouette. a Shallow inspiration. b Full inspiration. Grid effect. If the central ray is not perpendicular to the film cassette when a grid is used (Fig. 2.5), a “grid effect” may result (Fig. 2.6). This effect causes one side of the chest to be underexposed (diffuse haziness of one hemithorax) due to the increased absorption of primary roentgen rays by the metal strips of the grid. The laterally asymmetric opacity throughout one lung should not be mistaken for a pleural effusion tracking toward the apex. A grid effect can be confirmed by noting that the extra-pulmonary soft tissues on the affected side also appear hazy. Fig. 2.5 Scatter-reduction grid. Radiographs with a scatter-reduction grid require up to triple the dose (even in digital radiography) but improve penetration of the mediastinum. (This film, though taken in a heavy-set patient, shows a retrocardiac air bronchogram and clearly defines the nasogastric tube.) Faulty processing. Constant processing conditions should be maintained when digital technology is used. Any change in processing should be noted, and suboptimal processing (excessive edge enhancement or structural contrast) should be avoided. Due to a lack of automatic dose control (automatic shutoff), underexposure and overexposure were the most frequent causes of poor image quality in conventional radiography; they could be recognized by the direct visual assessment of film density. This method cannot be used for dose estimation in digital radiography, because image density and dose are independent variables when digital technology is used. Nevertheless, dose control is still an essential concern in digital radiography: Fig. 2.6 Grid effect. Off-centering of the grid has caused diffuse haziness over the right hemithorax that mimics a pleural effusion (note the extension of haziness over the extrathoracic soft tissues on the right side). Dose indicators. Dose indicators are numerical values that are displayed on the film or monitor screen. They vary in their definition and calibration, depending on the manufacturer (Table 2.1). It should be noted that a dose indicator does not correlate with the patient entrance dose but with the dose delivered to the detector. Thus, two images from the same patient with or without pneumonia may have exactly the same patient entrance dose but different dose indicator readings. Similarly, the dose indicator will vary in different projections and body regions while the patient entrance dose remains the same. In our own analysis of follow-up chest radiographs of ICU patients, we found that the dose indicator varied over a range of approximately ± 50% of the mean value. But despite these variations with individual absorption characteristics, the dose indicator—when averaged over one group of patients and a prolonged time period (longitudinal studies)—is useful for detecting any creeping upward of the radiation dose over time. As a result, both medical and technical personnel should be familiar with the dose indicator and how it functions. Newer systems. Newer detector systems are based on mobile flat-panel direct radiography technology. They automatically give a direct readout of the current dose– area product (DAP; patient entrance dose) and therefore allow for immediate dose control. The orders for radiology services fall into two main categories: routine and emergency. Routine orders. Routine services can be smoothly integrated into the workflow of the ICU and require a onetime coordination of the departments involved. Staff should be available in ICU to assist with setting up the equipment or taking the radiographs, while other staff members may vacate the room to avoid exposure. Emergency orders. Emergency orders are performed immediately and rely on the prompt availability of necessary staff and equipment, usually furnished by the radiology department. Clinical information. The following clinical information is relevant to the radiologic evaluation of ICU patients: Routine orders. Daily joint conferences should be held with ICU physicians for reporting the findings of radiology services. The purpose of these interdisciplinary conferences is to review relevant clinical data, discuss current findings, and consider possible further diagnostic and therapeutic actions. The frequent low specificity of morphologic findings in the chest underscores the importance of this interdisciplinary teamwork in the care of ICU patients, as the interpretation of radiologic findings is critically influenced by an awareness of clinical information such as fluid balance, ventilation therapy, and inflammatory markers. Clinical information plays a vital role in intensive-care radiography, because image analysis must take into account not only the variety of primary pathologic processes, but also any previous therapeutic and/or diagnostic actions, which may affect the detectability of findings and will definitely affect their interpretation. Emergency orders. Emergency orders require the direct reporting of findings because the results may have immediate therapeutic implications. The findings should be promptly reported by telephone, by direct conversation, in handwritten form, or as a voice recording if an electronic dictation system is available. Other digital options are the use of text blocks or speech recognition technology for the rapid creation of digital text files. As a document with high evidential value, the radiology report is valid only when accompanied by a handwritten or digital signature. Otherwise the recognition of unsigned or verbal findings in court will depend on the degree to which their integrity or actual transmission (timing, contents) can be substantiated by proper documentation. One of the principal tasks of intensive care radiology is to evaluate the placement of monitoring and therapeutic devices (catheters, lines, tubes, electrodes, drains). The chest radiograph is the method of first choice for detecting device malposition and complications while also providing a document for medicolegal purposes. The following basic rules apply in evaluating the position of tubes and lines: Evaluating the position of tubes and lines makes it imperative to define the complete intrathoracic course of these devices. Conventional chest radiographs should employ a high kilovoltage (and a slightly higher dose if necessary) to improve mediastinal detail. In digital radiography, adjusting the contrast level (window leveling for monitor images, processing for films) is more effective than increasing the dose or adjusting the kV (Fig. 2.7). Device localization. As a rule, line and tube placements in ICU patients are checked entirely on the basis of AP radiographs. This can cause problems with the accurate localization of these devices. Thus it is correct to describe the position of a catheter, for example, by stating that it is “projected onto” a certain vascular structure. If correct positioning cannot be definitively confirmed based on a single radiographic view, additional measures should be taken. These include obtaining additional views and injecting contrast medium into catheters or drains and documenting the contrast distribution. Contrast use. The correct intravenous placement of central venous catheters is confirmed at some institutions by opacifying the catheters with contrast medium when the initial radiograph is taken. Although very small amounts of contrast medium (about 10 mL) are generally sufficient, it is still necessary to consider the relative and absolute contraindications to the use of nonionic iodinated media. The examiner should check for contrast pooling or an atypical contrast distribution when evaluating the catheter position. Fig. 2.7 a, b Contrast adjustment. Poor visualization of tubes and lines on the monitor (a) is improved by window leveling. Note the looping of the nasogastric tube below the diaphragm (arrows in b). The current policy at most institutions—due partly to the risks of contrast use—is to withhold localization by contrast injection if the catheter is functioning normally (no resistance to blood aspiration or injection). Of course, this limits the information on catheter placement and cannot exclude potential problems such as catheter adherence. An increasing number of reports describe the use of ultrasonography for localizing tubes and lines, especially for the detection of device-related complications. Ultra-sound scanning provides a fast, sensitive, and noninvasive bedside technique for evaluating patients with a suspected myocardial perforation and hemopericardium (resulting from a catheter or pacemaker implantation). Other possible indications are evaluating the extent of a hematoma at the insertion site and, in difficult cases, accurate localization of the internal jugular vein prior to catheterization (especially in patients with low central venous pressure). Ultrasonography is the primary modality in the ICU for detecting thrombosis of the subclavian vein or internal jugular vein in patients with a long-in-dwelling central venous catheter. Dynamic imaging modalities such as x-ray fluoroscopy provide additional information only with regard to specific clinical questions such as contrast distribution or excessive tube mobility. CT has no role in the routine localization of catheters and monitoring devices, but it is the modality of choice in patients with equivocal findings on projection radiographs. CT can confirm the correct placement of an inter-lobar or pleural drain and exclude malposition outside the lung (Fig. 2.8). Multislice spiral CT, with its multiplanar reformatting capabilities, has further improved the accuracy of catheter localization. The most important indication for CT is clinical suspicion of an acute complication associated with catheter insertion. Thin slices greatly improve the accurate localization of a bleeding site related to catheter insertion. Fig. 2.8 a, b Localization of a chest tube using CT. CT, with its multiplanar capabilities, is better than chest radiographs for evaluating the position of chest tubes and other devices. In this case CT shows sharp angulation and intraparenchymal placement of the tube on the right side. The chest radiograph will show malposition of the endotracheal tube (ETT) in 12–15% of intubated patients. In most cases the malposition of an orotracheal or nasotracheal tube is not detected by physical examination alone (asymmetric breath sounds or chest excursions), and so every endotracheal intubation should be followed by a chest radiograph to confirm proper placement. Since tube manipulations (e. g., retaping) or patient coughing may alter the position of the ETT, published guidelines (including recommendations from the American College of Radiology) advocate daily repetition of the chest radiograph in intubated patients. Increasingly, this practice is no longer followed in patients with stable cardiopulmonary status, although the position of the ETT should be rechecked and evaluated whenever a new chest radiograph is obtained. The tip of the ETT is marked with a radiopaque strip, making it easier to locate on chest radiographs. The tip position is usually described in relation to the carina, which is at the level of the T 5 ± 1) vertebra in 95% of patients. When the head is in the neutral position, the tip of the ETT should be 5–7 cm above the carina. The tip of the tube may move considerably with flexion and extension of the neck. Because the tube is secured to the nose or mouth, only its distal end can follow movements of the head and neck, moving up to 2 cm downward with flexion and up to 2 cm upward with extension. Hence the tip of the ETT should be at least 5 cm above the carina when the head is in neutral position. If it were placed lower, a simple change in head position could cause the tip to enter one of the main bronchi. Rotation of the head may also cause the tip to move 1–2 cm. To minimize airway resistance, the lumen of the tube should occupy one-half to two-thirds of the tracheal lumen. Fig. 2.9 a–c Malposition of the endotracheal tube. a The endotracheal tube has been placed too low; its tip is only 1 cm above the carina. The cuff is overinflated and distends the tracheal wall. The pulmonary artery catheter and central venous catheter are normally positioned. b The tip of the tube is in the right main bronchus (arrow), accompanied by complete atelectasis of the left lung. c The tube has been placed too high; its tip is 8 cm from the carina, with risk of spontaneous extubation, aspiration, and injury to the larynx (vocal cords) from the cuff. The Quinton catheter and nasogastric tube are normally positioned. Cuff. The inflated cuff of the ETT should occupy all of the tracheal lumen without distending the tracheal wall (Fig. 2.9a). High cuff pressures on the tracheal wall may compromise blood flow leading to ischemia of the tracheal mucosa and irreversible mucosal damage. Modern high-volume low-pressure cuffs have greatly reduced this risk by lowering the internal pressure and distributing it over a larger area. The cuff should not extend below the lower end of the tube, as a “cuff herniation” might occlude the lumen. In ca. 10–20% of cases, imaging localization indicates a malposition of the ETT that requires correction. Unilateral endobronchial intubation. The most common positioning error is unilateral endobronchial intubation, usually of the right main bronchus (Fig. 2.9b). Unilateral intubation of the right main bronchus may lead to atelectasis of the left lung and/or right upper lobe with hyperinflation of the ventilated lung areas and risk of tension pneumothorax (ca. 15%) due to barotrauma. Too low or too high. If the tip of the ETT is too close to the carina, it may lead to undetected unilateral endobronchial intubation or direct mechanical irritation of the mucosa. Additionally, transbronchial aspiration may cause mucosal lesions at the level of the carina. Positioning the ETT too high carries a risk of spontaneous extubation and aspiration past a leaky cuff seal within the larynx or pharynx (Fig. 2.9c). There is also a risk of injury to the larynx (vocal cords) from the overinflated cuff. Esophageal intubation. Misdirected insertion of the ETT into the esophagus is recognized clinically in most cases. The ETT appears to the left of the tracheal outline on the chest radiograph, accompanied by overdistension of the esophagus and stomach and displacement of the trachea by the inflated cuff. A 25° right anterior oblique projection of the chest with the head turned to the right can clearly display the tube running posterior to the tracheal border. Rupture of the larynx, trachea (usually the membranous part), or main bronchi (usually after a difficult intubation) is a rare but serious complication of endotracheal intubation (Fig. 2.10). Air escaping from the ruptured trachea or bronchus may cause a pneumomediastinum, soft-tissue emphysema, or even a pneumothorax. A symptomatic or asymptomatic tracheal stenosis, tracheomalacia, intrathoracic vascular erosion, or tracheo-bronchial fistula may develop as a rare, late complication of an overinflated cuff or long-term intubation. A tracheotomy is performed in patients who require long-term ventilation or have an upper airway obstruction. When the tracheostomy tube has been inserted, a chest radiograph is obtained to assess its position and exclude complications. The tracheostomy tube should run down the tracheal air column, parallel to its longitudinal axis. The tip of the tube should be located several centimeters above the carina. At least two-thirds of the straight portion of the tube should be intratracheal (Fig. 2.11a). The tracheostomy tube should occupy one-half to two-thirds of the tracheal lumen to minimize airway resistance. The tip of the tube may be pressed or jammed against the anterior or posterior tracheal wall, leading to pressure necrosis or perforation of the tracheal wall (detectable on lateral radiographs) (Fig. 2.11b). Very rarely, this mal-position may cause pressure erosion of the left brachiocephalic artery in front of the trachea or give rise to a tracheobronchial fistula. If the inner and outer ends of the tracheostomy tube are superimposed on the chest radiograph, occupying the same plane, the tube is not passing normally down the trachea and must be repositioned. Clinical examination is sufficient in most cases, but a lateral radiograph is helpful in rare instances. The chest radiograph after a tracheotomy will often show mild cutaneous emphysema in the neck and a pneumomediastinum without pathologic significance. Massive subcutaneous emphysema, however, most likely indicates a tracheal perforation in the setting of the tracheotomy. A pneumothorax may result from pleural injury during the tracheotomy or from a tracheal perforation. Widening of the mediastinum after a tracheotomy is suggestive of hemorrhage. Rare, late complications of tracheotomy are tracheal stenosis, tracheomalacia, intrathoracic vascular erosions, and tracheobronchial fistula. Fig. 2.10 a–d Iatrogenic tracheal rupture. a The tip of the endotracheal tube is within the right main bronchus following a difficult intubation. b After the tube was repositioned, the patient developed extensive mediastinal and subcutaneous emphysema. c, d CT shows an irregular wall contour of the right main bronchus at the site of the bronchoscopically confirmed rupture (not clinically apparent until the catheter was withdrawn). There is an associated left pneumothorax. Fig. 2.11 a, b Tracheostomy tube. a Correct position. b The intratracheal segment of the tube is too short, causing the tip of the tube to engage against the lateral tracheal wall (risk of pressure necrosis and perforation). Postinterventional chest radiographs demonstrate malposition of the central venous catheter (CVC) in up to 33% of patients. The following points should be noted when evaluating the catheter position on the chest radiograph: The catheter is usually introduced via the subclavian vein or internal jugular vein, and its tip should be visualized in the superior vena cava (Fig. 2.12a). In the AP chest radiograph, the catheter tip should lie close to the level of the azygos vein (between the sternal attachments of the first three ribs). Catheters introduced via the subclavian vein and internal jugular vein should appear to cross each other on the AP radiograph. If they do not, the possibility of an extravascular or intra-arterial catheterization should be considered. Intracardiac malposition of the CVC in the right atrium or right ventricle may lead to valvular or endocardial lesions. Other risks are arrhythmias and myocardial perforation with hemopericardium and pericardial tamponade. Intramural malposition often produces no clinical manifestations but should be corrected owing to potential complications such as thrombosis or vascular erosion. Common positioning errors. The radiographic detection of CVC malposition requires an accurate knowledge of thoracic venous anatomy (Fig. 2.13). The most common error with catheters placed through the subclavian vein is to advance the catheter into the ipsilateral internal jugular vein (ca. 15% of cases, Fig. 2.12b). Another common error is to advance the catheter across the midline into the contralateral brachiocephalic vein (Fig. 2.12c). A catheter introduced via the internal jugular vein may erroneously enter the veins of the upper limb. These types of malposition are very easy to recognize on AP chest radiographs. Fig. 2.12 a–c Central venous catheter. a Correct position: the tip of the catheter is projected at the junction of the superior vena cava and right atrium. b Right subclavian catheter is malpositioned in the internal jugular vein. The right jugular vein catheter occupies a normal position. A right pneumothorax is also present following chest tube insertion. c Right jugular vein catheter is malpositioned in the contralateral internal jugular vein. Fig. 2.13 Diagrammatic representation (ap and lateral view) of the anatomy of the thoracic veins. 1 Internal jugular vein 2 Subclavian vein 3 Brachiocephalic vein 4 Superior vena cava 5 Internal thoracic vein 6 Pericardiophrenic vein 7 Azygos vein 8 Accessory hemiazygos vein Positioning errors that are rare or difficult to detect. Catheter malposition in the azygos vein or internal thoracic vein is more difficult to detect and may require biplane radiographs or contrast opacification. Malposition of the catheter tip in the azygos vein is evidenced by a loop projecting over the termination of the azygos vein in the superior vena cava (Fig. 2.14a). Malposition in the azygos vein is clearly detected in the lateral radiograph by noting posterior deviation of the catheter (Fig. 2.14b). Rarely, a catheter may be positioned in the internal thoracic vein, recognized in the lateral radiograph by its retrosternal course (Fig. 2.14c). Rare sites include the pericardiophrenic vein (catheter runs along the cardiac border), left superior intercostal vein, and inferior thyroid vein. The most common variant of venous anatomy is a persistent left superior vena cava, which is present in 0.3% of the normal population and in 4.3% of patients with cardiac anomalies. Typically the catheter descends through the left side of the mediastinum following puncture of the left internal jugular vein or subclavian vein (Fig. 2.15). Fig. 2.14 Central venous catheter (CVC) malpositioned in the azygos vein. a The tip of the CVC is in the azygos vein. Note the catheter loop projected over the proximal azygos vein. b Lateral radiograph confirms CVC malposition in the azygos vein by the posteriorly directed catheter position. c The internal thoracic veins on both sides have been opacified by contrast injection. Fig. 2.15 Persistent left superior vena cava. The catheter runs down the left side of the mediastinum following catheterization of the left internal jugular vein or subclavian vein. Fig. 2.16 Intra-arterial placement of the central venous catheter. The catheter runs too close to the midline on the chest radio-graph, having been placed inadvertently in the descending aorta. An intra-articular CVC is recognized by its atypical course—medial to the expected location of the subclavian vein (Fig. 2.16). The most frequent complication of catheter insertion is pneumothorax (6% incidence after subclavian catheterization). Pneumothorax is much less common with jugular vein catheterization but may still occur. A delayed pneumothorax should be suspected in cases where respiratory deterioration occurs hours or days after line placement. Intracardiac placement of the catheter in the right atrium or ventricle may rarely lead to myocardial perforation with hemopericardium and pericardial tamponade. Inadvertent arterial catheterization may lead to extensive soft-tissue hematomas, mediastinal hematomas, or a hemothorax. These complications are manifested on radiographs by soft-tissue opacities, mediastinal widening, and pleural effusion. The extravascular placement of a CVC in the mediastinum or pleura combined with the infusion of large fluid volumes leads to an infusion mediastinum with rapidly progressive mediastinal widening and pleural effusion (Fig. 2.17a). The catheter position should be adjusted in cases where the catheter tip rests against the right lateral wall of the superior vena cava (Fig. 2.17b). This placement is most commonly seen with catheters that have been introduced via the left subclavian vein. It increases the risk of endothelial damage and vascular perforation, which typically occurs hours to days after catheter insertion (Fig. 2.17c). Long-term catheterization, looping, intimal lesions, and infections promote the development of intravenous thrombosis. Thrombotic material is found around the CVC in up to 73% (!) of patients who have had the catheter in place for 2 weeks. Doppler ultrasound scan is the primary technique for detecting thrombosis of the subclavian vein and internal jugular vein in ICU patients. CT with IV contrast administration in both arms is recommended for assessing the extension of thrombosis toward the superior vena cava.
Care Patient 2
 patients on mechanical ventilation
 patients with acute cardiopulmonary problems
 after the insertion or replacement of most medical devices (endotracheal tubes, catheters, drains, etc.)
 patients under cardiac surveillance
 Daily routine portable chest radiographs are no longer standard in the ICU, owing to concerns about radiation safety and cost.
Technique of Portable Chest Radiography
C. Schaefer-Prokop
Technical Factors
 kV and mAs
 film–focus distance
 patient size
 grid factor (if a grid is used)
 When the kV is reduced by 20%, the mAs must be doubled to achieve the same exposure.
Film–Focus Distance
 With an FFD of 1 m, changing its value by 10 cm will alter the exposure by 20%.
Scatter-Reduction Grid
 Chest radiographs with a grid require greater exposure than radiographs without a grid.
Projections
Causes of Poor Image Quality
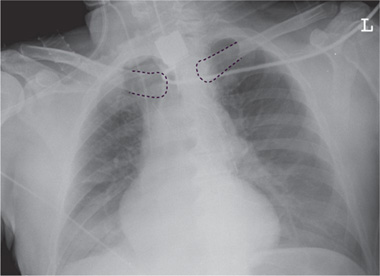
 The depth of inspiration for a supine radiograph is adequate when the hemidiaphragm is displayed in the MCL at the level of the fifth anterior rib.

Dose Control in Digital Radiography
 If the dose is too high, it will not degrade image quality but may pose a radiation hazard to the patient (especially in children and other radiosensitive patients).
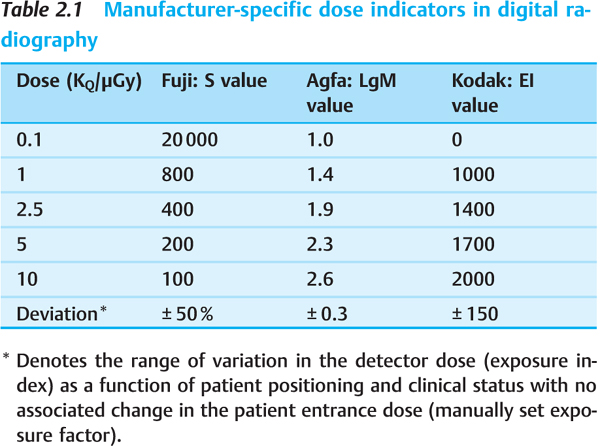
 Manufacturer-specific dose indicators allow for immediate dose control in digital radiography.
Communication between Radiologists and Clinicians
C. Schaefer-Prokop
Ordering Radiology Services
 patient history and status (level of consciousness, mechanical ventilation)
 nature, course, and dates of previous events (e. g., surgery, trauma, hemorrhage, aspiration, transfusions, shock, resuscitation, adverse drug reactions)
 nature, course, and dates of previous interventions (e. g., endoscopies, punctures, intubations, catheterizations)
 acute or preexisting impairment of cardiac, renal, or cerebral function
 recent changes in blood-gas analysis, temperature, blood pressure, or ventilation (indicating numerical values as needed)
Reporting of Findings
 Awareness of previous therapeutic and diagnostic actions will influence the interpretation of imaging findings and their clinical implications.
Catheters and Monitoring Devices
E. Eisenhuber-Stadler and P. Wunderbaldinger
 Intrathoracic tubes and lines should be completely visualized on radiographs.
 All catheters and monitoring devices introduced into the body should be radiopaque so that they will be visible on chest radiographs. If this is not the case, the catheter should be opacified with contrast medium during the initial position check.
 The insertion of any catheters, lines, tubes, electrodes, or drains should be followed by a chest radiograph to evaluate and document the position of the device and detect any complications.
 An unsuccessful percutaneous procedure should also be followed by a chest radiograph to exclude possible complications.
 Despite a correct initial placement, it is always possible for catheters, tubes, lines, electrodes, and drains to become shifted or dislodged spontaneously or as a result of position changes or spontaneous movements of the patient. This is why chest radiographs should be obtained regularly (daily if necessary) in ICU patients.
 The position of all tubes and lines should be individually checked and evaluated whenever a new chest radiograph is obtained.
Diagnostic Strategy
Radiography
Ultrasonography
Fluoroscopy
Computed Tomography
 CT is justified by clinical suspicion of an acute complication relating to catheter insertion.
Endotracheal Tube
 Every endotracheal intubation should be followed by a chest radiograph to evaluate tube position.
Normal Position
 With the head in a neutral position, the tip of the endotracheal tube should be 5–7 cm above the carina.
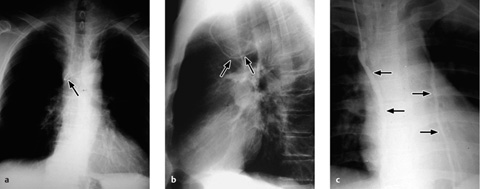
Malposition
Complications
Tracheostomy Tube
Normal Position
Malposition
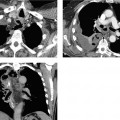
 Rupture of the larynx, trachea, or main bronchi is a rare but serious complication of endotracheal intubation.
Complications
Central Venous Catheter
 The intrathoracic course of the catheter should be completely visualized from the insertion site to the catheter tip.
 Even with an unsuccessful insertion, a chest radiograph should still be obtained to rule out possible complications (hematoma at the insertion site, pneumothorax).
 Some colleagues recommend contrast instillation for the initial radiograph to check for extravascular catheterization or malposition in small vessels. In most practical situations, however, it is sufficient to assess the function of the catheter (no resistance to aspiration or infusion) and evaluate its position on plain radiographs, obtaining contrast views only in selected problem cases.
Normal Position
 If catheters introduced via the subclavian and internal jugular vein do not cross each other in the frontal radio-graph, the possibility of an extravascular or intra-arterial catheterization should be considered.
Malposition
Complications (Table 2.2)
 A pneumothorax after subclavian catheterization is the most frequent complication of CVC.
 If the dose is too low, it will result in greater image noise and poorer image quality, especially with low-contrast structures. This could result in a loss of diagnostic information.
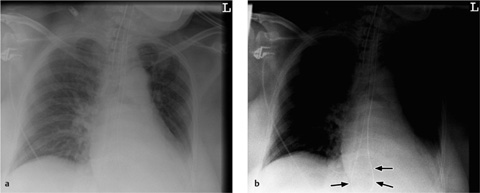
Complication | Typical radiographic signs | Comments |
Hematoma at the insertion site | Soft-tissue opacity | Caution: A hematoma may form even after an unsuccessful puncture |
Pneumothorax | Expanded pleural space, pleural line, loss of pulmonary vascular markings | Pneumothorax often has an anterior or subpulmonary location in supine patients |
Mediastinal hematoma, hemothorax | Rapidly progressive mediastinal widening, pleural effusion | Seen with extravascular or arterial malposition |
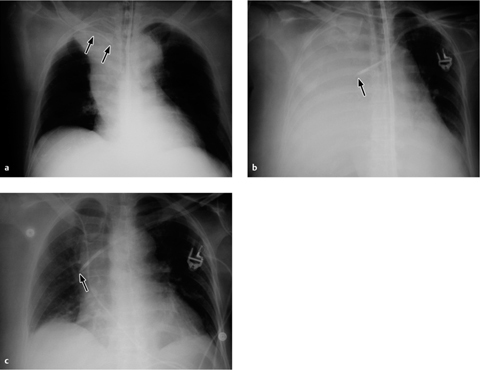
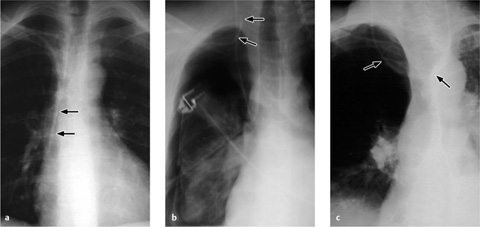
Fig. 2.17 a–c Extravasation due to perforation.
a The tip of the left subclavian catheter should be repositioned, as it rests against the right lateral wall of the superior vena cava.
b Two days later the tip has perforated the superior vena cava, causing complete opacity of the right hemithorax.
c Extravascular malposition of a right subclavian catheter in the mediastinum is marked by rapid progression of mediastinal widening.
Pulmonary Artery Catheter
Pulmonary artery catheters (Swan–Ganz catheters, flow-directed catheters) are used in ICU patients to monitor cardiopulmonary function and to direct therapeutic measures. The catheter monitors the pulmonary capillary wedge pressure, which is a measure of the pressure in the left atrium. Cardiac output and other important hemodynamic variables can also be measured or calculated.
The principal indications are:
 septic shock
 severe respiratory failure (ARDS)
 heart failure
 major operations (especially cardiac surgery)
Typically, the catheter is passed through an introducer sheath into the subclavian vein or internal jugular vein and floats from there through the superior vena cava, right atrium, right ventricle, and into the main trunk of the pulmonary artery. Placement of the pulmonary artery catheter—even when characteristic pressure waveforms are obtained—should always be followed by a chest radiograph to confirm the catheter position and exclude complications.
 A chest radiograph should always be obtained after the insertion of a pulmonary artery catheter.
Normal Position
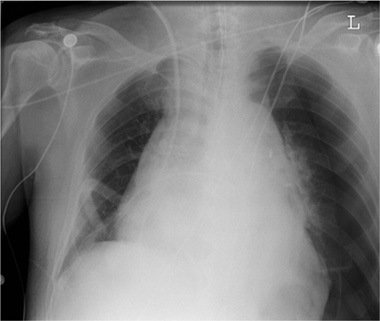
The normal position of the catheter tip is variable depending on its functional state (wedge position). Its position in the “resting state” ranges from the right ventricular outflow tract and main pulmonary trunk to the right or left pulmonary trunk (Fig. 2.18a). Ideally, the pulmonary artery catheter should be placed so that when the balloon is inflated, the catheter can easily advance into the lung for monitoring wedge pressures. While in the wedge position, the tip of the pulmonary artery catheter is located in a pulmonary artery branch and blood flow often carries the tip into a posterior area of the lung.
Malposition
The most common positioning error is a peripheral malposition in which the catheter tip is in a pulmonary artery branch located more than 2 cm from the hilum. This distal placement may result in a pulmonary infarction, or the tip may perforate a pulmonary arterial branch, causing hemorrhage. If placed too far proximally in the right ventricle, the catheter may cause arrhythmia, endothelial damage, or perforation.
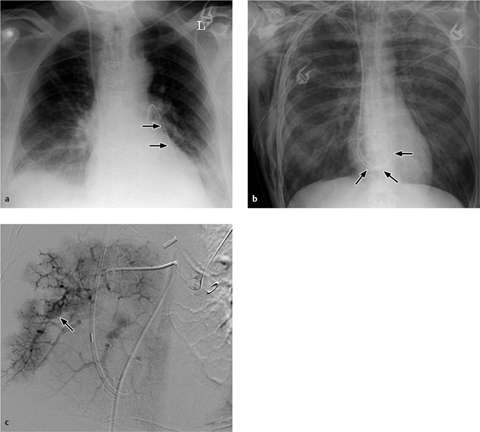
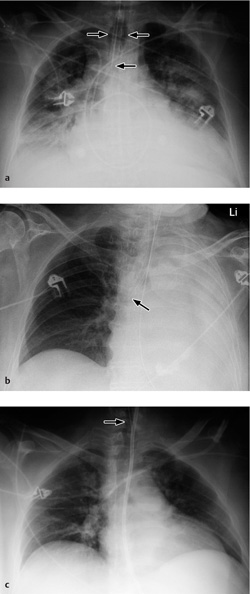
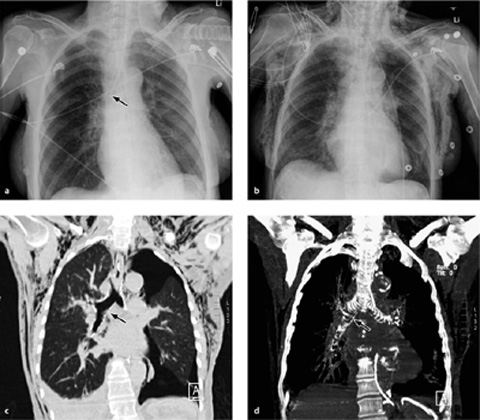
Fig. 2.18 a–c Pulmonary artery catheter.
a The Swan–Ganz catheter is correctly positioned with its tip in the inferior branch of the left pulmonary artery.
b Malposition of the pulmonary artery catheter, which was introduced via the right jugular vein. Looping has occurred within the right atrium. The chest radiograph also shows a right-sided pneumothorax with chest tube in place, soft-tissue emphysema, and intrapulmonary vascular congestion.
c The Swan–Ganz catheter is positioned too far distally, giving rise to an intrapulmonary aneurysm in a segmental arterial branch.
Complications
The most frequent complication visible on radiographs is pulmonary infarction, which may occur when the catheter has been placed too distally or the balloon has been inflated for too long. The infarcted area usually appears as a focal opacity in the lung region peripheral to the catheter. It is rare to find a classic homogeneous, wedge-shaped area of subpleural consolidation (the “Hampton hump”).
Looping or coiling of the catheter within the atrium or ventricle may provoke atrial and ventricular arrhythmias (Fig. 2.18b).
A rare complication is rupture of the pulmonary artery leading to pulmonary hemorrhage. Other rare complications are pseudoaneurysms involving the pulmonary artery or a segmental branch (Fig. 2.18c), intracardiac knotting of the catheter, and localized thrombosis.
Intra-aortic Balloon Pump
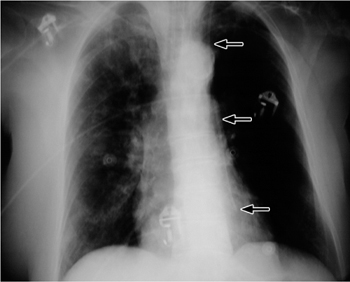
The intra-aortic balloon pump (IABP) is a device that provides mechanical circulatory assistance. It consists of a catheter tipped with an inflatable balloon 26–28 cm long. Controlled by the patient’s ECG signals, the balloon is inflated during diastole with ca. 40 mL of gas (usually helium) and is deflated during systole. A chest radiograph taken during diastole shows the IABP as an elongated gas-filled structure in the descending aorta. The balloon itself is not visible during systole because it is deflated, but its position is still indicated by a small radiopaque marker at the tip.
The IABP improves oxygen delivery to the myocardium and brain during diastole (balloon inflation) and reduces the cardiac afterload during systole (balloon deflation).
The following are indications for an IABP:
 low-output syndrome
 cardiogenic shock
 weaning difficulties from a heart–lung machine
 perioperative support in patients at high cardiac risk
 bridging to heart transplantation
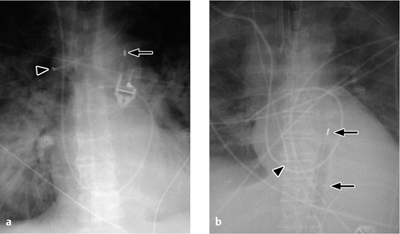
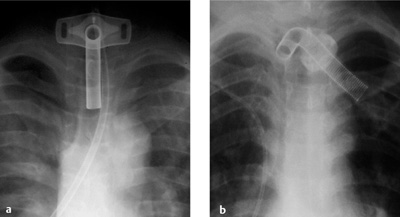
Fig. 2.19 a, b Intra-aortic balloon pump.
a The balloon is deflated during systole, but a metal marker at the catheter tip is projected over the aortic arch distal to the origin of the left subclavian artery, confirming correct placement. A malpositioned CVC is visible in the azygos vein (arrowhead).
b Gas makes the inflated balloon visible during diastole. The metal-tagged tip is malpositioned, being projected too far peripherally in the descending aorta. The CVC is malpositioned on the right side with its tip low in the right atrium (arrowhead).
Normal Position
Correct placement of the IABP is easily confirmed on plain radiographs. The catheter can be introduced percutaneously via the femoral artery or surgically through an arteriotomy. Transfemoral insertion, in which the catheter is advanced in retrograde fashion into the thoracic aorta, is usually performed under fluoroscopic guidance. Ideally, the tip of the catheter, bearing a radiopaque marker, is positioned just distal to the origin of the left subclavian artery in the aortic arch (junction of middle and lower thirds) in the AP chest radiograph (Fig. 2.19a).
In rare cases an IABP is placed intraoperatively from a proximal approach, passing through the aortic arch and into the descending aorta. In this case the small metal bead marks the distal rather than proximal end of the device. An IABP advanced into the aorta from a proximal site will also require operative removal.
 The tip of the IABP catheter should be located in the aortic arch (junction of middle and lower thirds) in the AP chest radiograph.
Malposition
If positioned too far proximally, the IABP may occlude the left subclavian artery or the arteries supplying the brain, with consequent risk of cerebral embolism. If placed too far distally, the device will cause a functional deficit with risk of visceral artery obstruction (Fig. 2.19b).
Impella Device
The Impella device is a catheter-based cardiac-assist device with a small pump mounted at its tip. The catheter can be introduced percutaneously via the femoral artery or may be inserted directly into the aorta. The pump can be positioned in the left ventricle (or rarely in the right ventricle) to provide a temporary increase in cardiac output. The pump rotates at about 40 000 rpm and can generate a stroke volume up to 2.5 L/min, providing effective hemodynamic support. Unlike the IABP, the effectiveness of the Impella does not depend on preexisting cardiac performance. The indications for the Impella are similar to those for the IABP.
The Impella device has also been used in conjunction with the IABP or with ECMO (extracorporeal membrane oxygenation, see below).
Normal Position
As the diagram in Fig. 2.20 a shows, part of the Impella is distal to the aortic valve plane while the rotor-bearing part is proximal to the valve plane, that is, within the ventricle. Accordingly, the two metallic markers at the ends of the device should be located proximally and distally of the aortic value on the chest radiograph.
Malposition
Positioning the Impella too far proximally or distally (Fig. 2.20 b) will reduce its functional performance, and the device may injure or even perforate the ventricular wall.
Chest Tubes
Thoracostomy tubes (chest tubes) are used to evacuate air or fluid from the pleural cavity. Fluid collections tend to gravitate to posterior sites in the supine patient while air collections rise to anterior sites. Accordingly, the tube may occupy various positions depending on the indication. Chest radiographs should be obtained routinely after thoracostomy tube insertion to evaluate tube position, exclude complications (e.g., pneumothorax when draining a pleural effusion), and evaluate response.
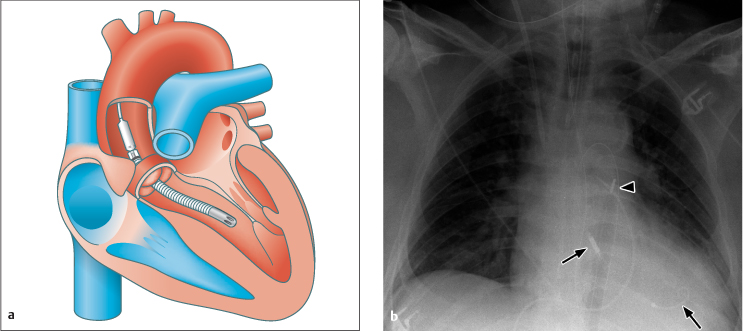
Fig. 2.20 a b Impella device.
Diagram of the normally positioned device (a) and clinical example of malposition (b), in which the device has been positioned too far peripherally. The proximal metal part (rotary pump) (left arrow) should be within the aorta, just distal to the aortic valve, while the distal intake tube is within the left ventricle (right arrow). The radiograph also documents peripheral malposition of the IABP (arrowhead) while showing normal positioning of the endotracheal tube, Swan–Ganz catheter, Quinton catheter, and nasogastric tube.
Normal Position
The radiographic criteria for evaluating the position of a chest tube depend on the indication:
 The tip of a tube for evacuating a pneumothorax should be placed close to the pulmonary apex at the level of the anterior axillary line and should be directed anterosuperiorly.
 The tip of a tube for draining pleural fluid should be placed posteroinferiorly between the sixth and eighth intercostal spaces at the level of the midaxillary line. Particular care is taken that the sideholes (appearing as breaks in the radiopaque line) are intrathoracic.
 Loculated air or fluid collections require atypical tube positions. The tubes are inserted separately under ultrasound guidance or, increasingly, under CT guidance.
Malposition
Up to 25% of thoracostomy tubes placed under emergency conditions are found to be malpositioned. The tube is assumed to be malpositioned if the radiograph after insertion does not show immediate release of signs of tension or gradual decrease of pneumothorax or pleural fluid, respectively. Chest tubes may be located in the interlobar fissures, in the lung parenchyma, or in the extrapleural thoracic soft tissues.
 The radio-graphic criteria for evaluating chest tube position depend on the indication.
CT scans can confirm an intrafissural (interlobar) position by locating the tube to the interlobar fissures.
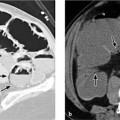
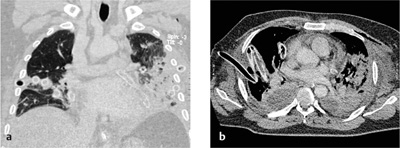
If the tube is not closely aligned with the interlobar fissures, an intraparenchymal malposition should be assumed. In most but not all cases, this type of malposition is also associated with hematoma formation around the tube (Fig. 2.22). This collection, usually distributed around the tip of the tube, may also be visible on the initial chest radiograph. If a hematoma has not formed around the tip of an intraparenchymal tube, or if extensive consolidation is present (e.g., due to a pulmonary contusion), even CT may be unable to distinguish between an interlobar and intraparenchymal malposition (note the course of the fissures).
Complications
Possible complications include bleeding due to laceration of an intercostal artery, the liver, or the spleen. Inserting the tube into the lung tissue will cause a parenchymal laceration with hematoma formation. Malpositioned chest tubes may even injure large central vessels (aorta, vena cava, pulmonary vessels). In rare cases intraparenchymal placement may be followed by a bronchopulmo-nary fistula. An abscess or empyema may develop as a late complication of a malpositioned chest tube.
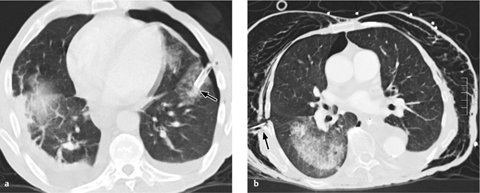
Fig. 2.21 a, b Thoracostomy tube.
a Intrapulmonary malposition with surrounding hematoma.
b Peripheral placement in the chest wall with extensive soft-tissue emphysema (chest wall fistula) and pulmonary contusion.
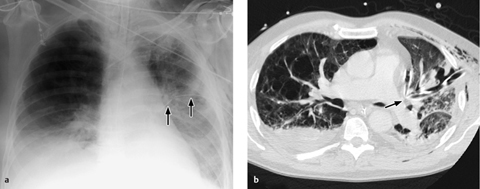
Fig. 2.22 a, b Intrapulmonary malposition of a thoracostomy tube with parenchymal laceration.
The malposition and the extent of the injury are poorly visualized on the chest radiograph but are well defined by CT. Note the kinked condition of the chest tube, which prevents normal drainage (with kind permission of H. Shin, Medizinische Hochschule Hannover).
Feeding Tubes
Gastric, duodenal, or jejunal tubes may be used for enteral nutrition or drainage. Malposition is not uncommon and often produces no clinical signs. Thus, a chest radiograph should be obtained routinely after the insertion of a new feeding tube.
 A malpositioned feeding tube often produces no clinical signs, so a chest radiograph should always be obtained after tube insertion.
Normal Position
Feeding tubes have a radiopaque stripe which aids their localization on chest films. It should be emphasized that feeding tubes are poorly visualized if the film is underexposed or the tube is not very radiopaque. Localization can be aided in these cases by opacifying the tube with radiographic contrast medium. Most feeding and drainage tubes have sideholes distributed along the distal 10 cm of the tube. The tip, then, should be located at least 10 cm distal to the gastroesophageal junction. Duodenal and jejunal tubes are generally introduced under endoscopic or fluoroscopic guidance.
Malposition
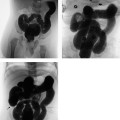
Malpositioned feeding tubes are not at all uncommon in ICU patients. The tip of a gastric tube may double back into the pharynx or esophagus, leading to the aspiration of nutrient solution (Fig. 2.23a). The feeding tube may inadvertently enter the tracheobronchial tree leading to pneumonia or to bronchial perforation with subsequent pneumothorax (Fig. 2.23b).
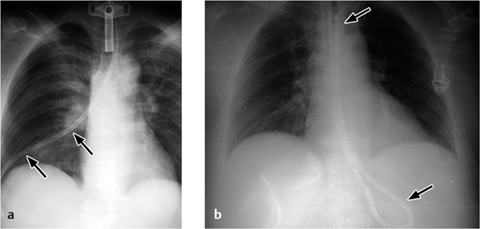
Fig. 2.23 a, b Nasogastric tube.
a Malpositioned in the lower lobe of the right lung.
b Tube doubled back on itself (risk of aspiration).
Complications
Esophageal perforation is a rare complication of feeding tube insertion. It may lead to mediastinal widening and pneumomediastinum.
Cardiac Pacemakers and Defibrillators
Cardiac pacemakers. Temporary pacemaker leads in ICU patients are usually inserted by the transvenous route via the subclavian or internal jugular vein. Generally, the wire lead is placed under fluoroscopic control at the apex of the right ventricle, where the lead is anchored in the trabeculae. Cardiac surgery is usually followed by temporary epicardial pacing with leads that are placed intraoperatively and are removed after the immediate postoperative period. The leads are usually anchored in the epicardium over the right atrium and right ventricle (or bipolar leads may be placed on the right atrium). They terminate over the pericardium, typically in the right parasternal area of the chest wall, where they can be connected to a pacemaker as required.
Defibrillators. Various systems are available for defibrillation by implantable cardioverter defibrillators (ICDs). The following types are distinguished based on the nature of the components:
 epicardial patch electrodes (usually two patches)
 transvenous defibrillator lead plus a subcutaneous patch in the chest wall
 transvenous defibrillator lead without a patch electrode
The transvenous defibrillator lead usually has two wire-wrapped expansions, one of which is placed at the junction of the superior vena cava with the right atrium or in the brachiocephalic vein. The other is placed on the floor of the right ventricle. The tip of the defibrillator lead is screwed into the apical portion of the right ventricle.
Combinations. An ICD may be combined with a pacemaker. Depending on the type of arrhythmia, the tips of the pacing wires may be located in the right atrium, right ventricle, coronary sinus, and in the left ventricle with biventricular pacing.
Normal Position
Anteroposterior (AP) and lateral radiographs are both necessary for accurate localization (Fig. 2.24). In the AP view, the tip of the transvenous pacemaker lead is projected onto the floor of the right ventricle, just medial to the left cardiac border. In the lateral view, the pacemaker lead should run anteriorly. Only the lateral view can show posterior deflection of the wire due to placement in the coronary sinus.
 AP and lateral radiographs are both necessary for the accurate localization of cardiac pacemakers and ICDs.
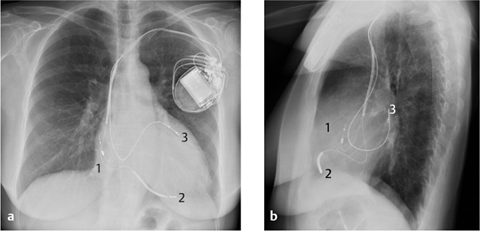
Fig. 2.24 a, b Implantable cardioverter defibrillator. The tips of the wires are located in the right atrium (1), right ventricle (2), and coronary sinus (3).
a AP view.
b Lateral view.
Because the position of transvenous defibrillator leads is highly variable depending on the system, the radiologist should know the type of system used and its normal radiographic appearance.
Malposition
Malposition in the superior or inferior vena cava, right atrium, pulmonary trunk, or pulmonary arteries can usually be detected on the basis of abnormal impulse conduction.
Complications
Myocardial perforation may be difficult to detect unless the tip of the pacemaker lead is definitely projected outside the myocardium or epicardial fat stripe. Myocardial perforation does not cause detectable changes in most cases. Rare cases may present with hemopericardium and pericardial tamponade, or with a pneumothorax (Fig. 2.25).
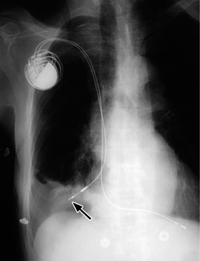
Fig. 2.25 Myocardial perforation by a cardiac pacemaker.
The right atrium has been perforated by an atrial pacing lead with migration into the pleural space, pericardial and pleural effusion, and a basal pneumothorax.
Drains after Cardiac Surgery
Drainage tubes after cardiac surgery may be found in various types, numbers, and locations depending on the particular surgeon and patient. The drains may be located in the anterior or posterior mediastinum, pericardium, or pleural cavity.
Pericardiocentesis and Pericardial Drainage
Fluid collections in the pericardium may be acutely life-threatening in patients who develop signs of pericardial tamponade. The treatment of choice is immediate (ultrasound-guided) drainage by pericardiocentesis. The needle position should be evaluated to exclude incorrect needle placement and injury to the great vessels or cardiac chambers. After the needle has been introduced, the fluid aspirated, and the needle position confirmed, a pigtail catheter is usually inserted into the pericardial sac.
Normal Position
Correct placement of the catheter should be verified by a chest radiograph after contrast administration, or by ultrasonography.
Complications
The main risk of pericardiocentesis is injury to adjacent organs or vessels (liver, stomach, lung, pleura, internal mammary artery, coronary artery, ventricle). Rare complications are pneumothorax, cardiac arrhythmias, and infection.
Extracorporeal Membrane Oxygenation
Extracorporeal membrane oxygenation (ECMO) has assumed growing importance in recent years, especially in adults with acute respiratory failure (see also ARDS, p. 37). Two types of ECMO are used: venovenous and venoarterial.
In venovenous ECMO, a catheter is advanced into the right atrium via the internal jugular vein. Blood aspirated from the right atrium is oxygenated and then returned to the right atrium through a double-lumen catheter or via a large peripheral vein (usually the femoral vein).
In venoarterial ECMO, blood is aspirated via a catheter passed into the right atrium via the internal jugular vein. It is then oxygenated and returned to the ascending aorta through a catheter in the carotid artery.
Pulmonary Hemodynamics and Edema in ICU Patients
S. Metz-Schimmerl and C. Schaefer-Prokop
Evaluation of Hemodynamics
Radiography
The use of a standardized radiographic technique can improve evaluations of the heart and vessels and facilitates comparison with previous images. Patient position, projection, film–focus distance, depth of inspiration, and ventilation parameters in patients on mechanical ventilation will critically influence the morphology and evaluation of cardiovascular status on radiographs.
Criteria
The following criteria are useful in the radiographic evaluation of hemodynamics:
 cardiac size
 the vascular pedicle (width of the upper mediastinum)
 diameter and outlines of the intrapulmonary vessels
 parenchymal density
 thickness of the chest wall
These parameters provide qualitative information on an increase or decrease in vascular pressure and the volume of extravascular fluid in the lung parenchyma or the “third space” (pleural cavity and chest wall). This permits an indirect assessment of left-heart function and fluid balance.
Cardiac size. Even in the supine position, cardiac size can be evaluated by determining the ratio of the transverse diameters of the chest and heart. When the different magnification factor (AP versus PA) and supine patient position are taken into account, the threshold value is adjusted upward and is >0.53 (versus <0.5).
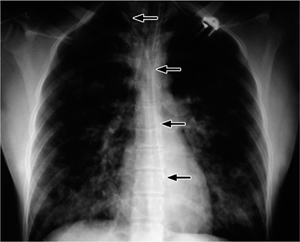
Vascular pedicle. The vascular pedicle in the upper mediastinal shadow can be used to estimate the intravascular volume. Consisting of the superior vena cava, azygos vein and descending aorta, it is measured as the distance between the point where the right main bronchus crosses the superior vena cava and a vertical line drawn through the origin of the left subclavian artery from the aorta (Fig. 2.26).
An increase in the width of the vascular pedicle (generally toward the right side) correlates with an increase in intravascular volume. An increase of ca. 0.5 cm corresponds to an approximate 1-L increase in the intravascular fluid volume, while a 1-cm increase corresponds to approximately 2 L. It should be noted, however, that rotating the patient to the right or changing from a sitting to supine position will also cause apparent widening of the vascular pedicle. A width of 7 cm is accepted as the upper limit of normal, although it is more meaningful to evaluate the progression of widths than the absolute value.
A decrease in mediastinal width may be caused by hypovolemia, a high ventilation pressure, or rotation of the patient toward the left side.
 Widening of the vascular pedicle by 1 cm corresponds to an approximate 2-L increase in the intravascular volume. Caution: patient rotation to the right or moving from sitting to supine can mimic mediastinal widening.
 A standard radiographic technique and comparison with previous images will improve the evaluation of cardiovascular status.
Intrapulmonary vessels. Evaluation of the intrapulmonary vessels is often difficult due to superimposed infiltrates or atelectasis, and is a highly subjective assessment. Often it is more meaningful to evaluate the progression of findings.
In bedside chest radiography, the supine position itself is sufficient to cause an equalization of vessel calibers in the upper and lower lung zones. By contrast, “vascular inversion,” or an upper zone redistribution of blood flow, is a sensitive criterion that is independent of patient position. Even in supine patients it is a useful indicator of pulmonary venous hypertension. A diffuse caliber increase is suggestive of hypervolemia.
Chest wall thickness. Chest wall thickness is an important consideration because fluid is mobilized much faster from the soft tissues than from the vascular compartment. As a result, changes in chest wall thickness are a more direct indicator of hydrostatic pressure changes than pulmonary vascular calibers: a 1-cm increase corresponds to an approximate 1-L increase of fluid volume in the extravascular compartment.
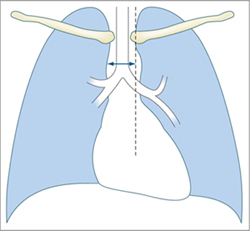
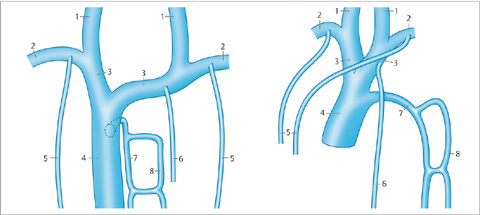
Fig. 2.26 Upper mediastinum.
Measuring the width of the upper mediastinum (vascular pedicle) on the chest radiograph.
Edema
Pulmonary edema refers to an extravascular accumulation of intrapulmonary fluid. Initially the fluid is confined to the interstitium and may remain there (predominantly) or may spread to the alveolar spaces.
 Pulmonary edema is classified pathophysiologically as one of two types: hydrostatic edema and permeability edema.
Types. Pulmonary edema is subdivided into two main pathophysiologic categories:
 Hydrostatic edema, which is caused by increased capillary pressure. This type leads to an excessive filtration of low-protein fluid through the capillary wall into the interstitial or alveolar spaces.
 Permeability edema, which is caused by increased permeability of the capillary wall. This increases the filtration of high-protein fluid into the interstitial space and alveolar wall.
This two-part classification is simplistic, as it disregards the fact that increased capillary pressure damages the capillary wall (“stress failure”) and also culminates in the leakage of protein-rich fluid.
Radiography
As with radiographs in the upright position, a distinction is made between interstitial edema and alveolar edema in bedside radiography. In communicating with clinicians, it has proven useful to classify pulmonary edema qualitatively as “mild,” “moderate,” or “severe,” its progression as increasing or decreasing, and identify grades of edema (Tables 2.3, 2.4).
Interstitial Edema
Radiographic signs of interstitial edema are as follows (Fig. 2.27 and Table 2.3):
 blurring of vessel margins
 subpleural thickening
 thickened interlobar septa
 peribronchial cuffing
 septal lines
A (predominantly) interstitial fluid accumulation is characteristic of grade 2 pulmonary edema.
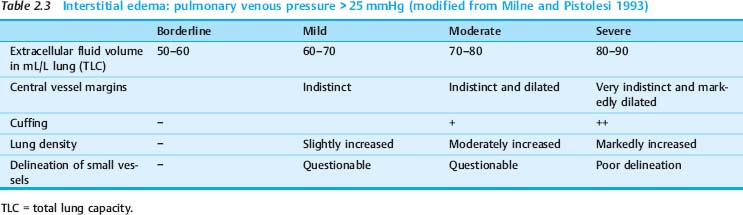
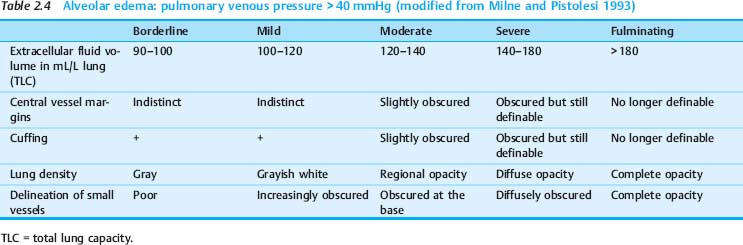
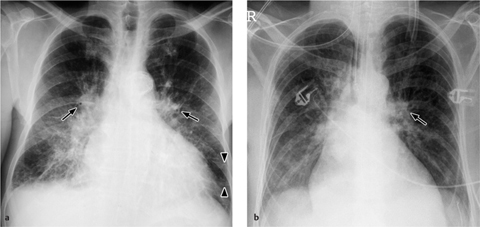
Fig. 2.27 a, b Appearances of predominantly interstitial edema.
Bronchial wall thickening (bronchial cuffing) (arrows), Kerley lines (arrowhead), and blurring of vascular margins due to interstitial fluid accumulation.
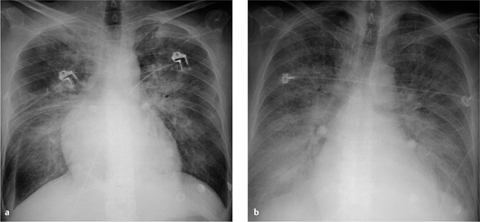
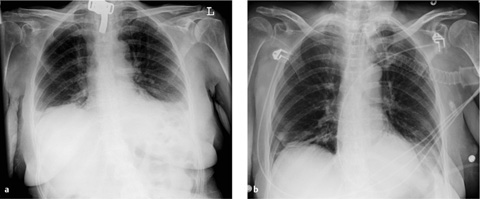
Fig. 2.28 a, b Appearances of predominantly alveolar edema.
Butterfly pattern of perihilar consolidation. The vessels are no longer defined. Note the absence of air bronchograms (differentiation from pneumonia) and the sparing of the subpleural space.
Alveolar Edema
Radiographic signs of alveolar edema are as follows (Fig. 2.28 and Table 2.4):
 Increased density, which is often uniform and diffuse in the acute phase.
 With progression, density is mainly increased in dependent (posterobasal) lung zones.
Alveolar edema may be focal or diffuse, symmetrical or very asymmetrical, and may even show a nonuniform patchy distribution (Fig. 2.29). A symmetrical, predominantly perihilar distribution is known as butterfly edema (Fig. 2.28a and Fig. 2.29a). It should be noted that underlying parenchymal changes (scars, emphysema, bullae) and heart disease (e.g., mitral regurgitation) affect the distribution of edema. Given the significant interindividual variations, the presentation in a given individual is remarkably constant, and it may be helpful to compare the radiographs with images taken at earlier stages of decompensation.
A (predominantly) alveolar fluid accumulation is characteristic of grade 3 pulmonary edema.
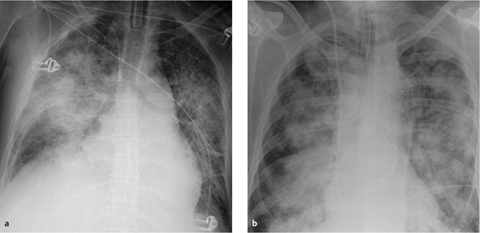
Fig. 2.29 a, b Alveolar edema.
Alveolar edema may be very asymmetrical (a) or may show an inhomogeneous patchy distribution (b).
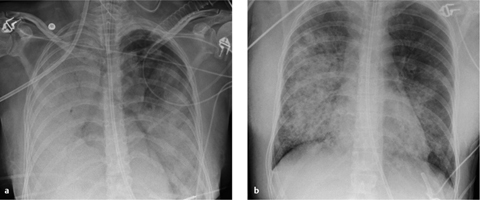
Fig. 2.30 a, b Regression of alveolar edema.
Alveolar hydrostatic edema (a) and ARDS may have identical appearances. But hydrostatic edema responds to treatment within hours, and shows marked improvement within 24 hours (b) compared with a time scale of several days or weeks in ARDS.
The following signs are helpful in differentiating alveolar edema from pneumonia:
 typical position dependence of the edema
 rapid onset
 prompt regression in response to therapy
 usual absence of an air bronchogram (the bronchi are often filled with fluid)
 Interstitial (grade 2) edema and alveolar (grade 3) edema are on a continuum and often coexist.
It is noteworthy that radiographic findings lag behind hemodynamic findings by up to 24 hours. Thus, edematous changes may still be radiographically visible even though the capillary venous pressure has fallen or returned to normal. A hallmark of pulmonary edema is its tendency to regress within 12–24 hours in response to therapy (Fig. 2.30); this contrasts with the greater persistence of infiltrates due to infection and the more gradual resolution of permeability edema (see ARDS, p. 37).
The changes of interstitial edema (grade 2) and alveolar edema (grade 3) are on a continuum, and it is common for radiographic signs of both forms to coexist. Accordingly, the findings described in the tables should be construed as “dominant” findings with various gradations rather than absolute differentiating criteria. As a rule, alveolar edema is more mobile and position-dependent than interstitial edema.
Differentiation of Hydrostatic (Cardiogenic) Edema from Permeability Edema (ARDS)
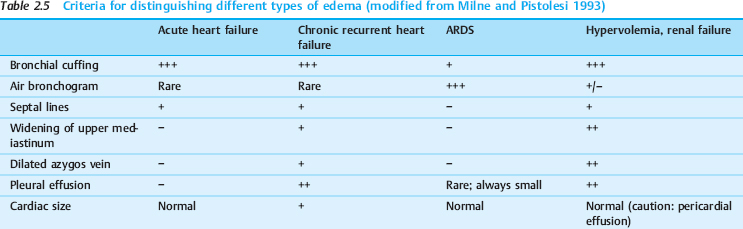
Besides the clinical presentation, the following radiographic signs are helpful in identifying the cause of pulmonary edema (Table 2.5).
 Bronchial cuffing is a classic sign of hydrostatic edema. It is also found in approximately one-third of patients with permeability edema, indicating a coexistence of both types in these cases.
 Septal lines are a rare finding and are seen in approximately one-third of patients with hydrostatic edema or hypervolemia. They almost never occur in permeability edema.
 Air bronchograms are very rare in hydrostatic edema, even in cases where alveolar fluid accumulation has already occurred (the bronchi are also filled with fluid). By contrast, air bronchograms are a characteristic early finding in permeability edema.
 The width of the upper mediastinum (vascular pedicle), the size of the cardiac silhouette, and the diameter of the azygos vein are indicators of the circulating blood volume. This volume is normal or even reduced in permeability edema and acute heart failure, while it is increased in chronic heart failure or overhydration. A mediastinal width greater than 7 cm and cardiomegaly have proven to be the most accurate criteria for distinguishing hydrostatic edema from permeability edema (> 70% diagnostic accuracy).
 Cardiomegaly or a large azygos vein in a patient with permeability edema suggest that the increased hydrostatic pressure has a secondary cause (overhydration).
 Pulmonary vascular redistribution to the upper zones (vessel diameters larger in the upper zones than in the lower zones) is a typical sign of cardiogenic hydrostatic edema (> 50%).
 The lung volume is diminished in both hydrostatic and permeability edema, but it may be increased due to fluid overload in renal failure.
Edema Due to Other Causes
Table 2.6 and Figs. 2.31, 2.32, 2.33, 2.34 list the causes and features of noncardiogenic forms of edema. The morphologic features of interstitial or alveolar edema may predominate in any given case, depending on the degree of severity. Noncardiogenic edema tends to resolve spontaneously and has a good prognosis.
Permeability edema without diffuse alveolar damage
|
Pulmonary syndrome after hantavirus infection
|
Neurogenic edema
|
Reexpansion edema
|
Postobstructive edema
|
Tocolytic therapy (μ-adrenergic agonists)
|
After pulmonary embolism
|
After lung transplantation
|
After pneumonectomy
|
 Heroin overdose (often shows upper lobe predominance)
 Cytokine therapy (melanoma)
 After nutritional disorders (anorexia, refeeding syndrome)
 After bone marrow transplantation (capillary leak)
 Intense immune response, diffuse capillary leak, frequent severe liver failure with an unfavorable prognosis
 Follows severe CNS insult
 Bilateral alveolar edema, typically in the upper zones, tends to resolve spontaneously
 Does not contraindicate organ removal for transplantation
 Follows rapid reexpansion of the lung after a pneumothorax or large effusion (lung compression for > 3 days); alveolar edema is typically unilateral, rarely bilateral due to blood-borne mediators
 Bilateral perihilar edema that resolves within 24 hours
 Follows clearing (!) of an upper airway obstruction (e. g., laryngospasm, epiglottitis, strangulation, impacted foreign body)
 Broad vascular pedicle (increased pulmonary venous return after elevated intrapulmonary pressure falls with expiration)
 Multifactorial cause (vascular volume overload and/or decreased plasma protein content, corticosteroid therapy); good prognosis
 Massive pulmonary embolism (> 50% obstruction) causes edema to develop in lung areas that are still perfused.
 Caused by impaired lymphatic drainage; typically begins at 24 hours, followed by spontaneous resolution over the next 10 days.
 Caused by hyperperfusion of residual lung (see
  A mediastinal width > 7 cm and cardiomegaly are signs of hydrostatic edema (aid differentiation from permeability edema).
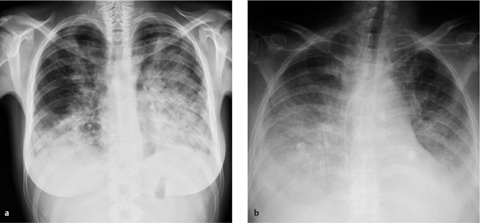
Fig. 2.31 a, b Permeability edema without diffuse alveolar damage.
a Refeeding syndrome in a girl with anorexia.
b Capillary leak after bone marrow transplantation.
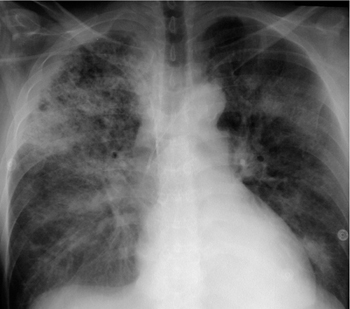
Fig. 2.32 Neurogenic edema.
Upper lobe predominance of edema following head trauma.
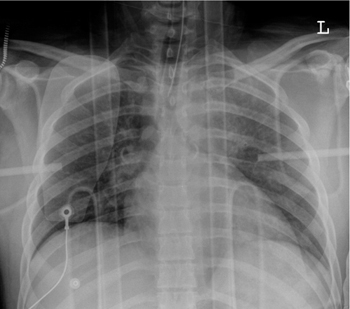
Fig. 2.33 Postobstructive edema.
Upper lobe predominance of edema following strangulation.
Computed Tomography
Pulmonary edema is evaluated on chest radiographs and is rarely an indication for CT.
On the other hand, edema should always be included in the differential diagnosis of thoracic CT findings in ICU patients and mainly requires differentiation from consolidation due to infection. The radiologist should therefore be familiar with the highly variable CT morphology of edema.
The CT features of intrapulmonary edema (Fig. 2.35) are as follows:
 Increased parenchymal density combined with superimposed thickened (fluid-filled) interlobular and intralobular septa (“crazy paving” pattern; Fig. 2.35a). Like radiographs, CT scans also show thickening of the central bronchovascular interstitium (bronchial cuffing).
 The increased density ranges from ground-glass opacity (parenchymal architecture and vessels are still visible) to dense consolidation (completely obscuring the parenchymal architecture), depending on the degree of intra-alveolar fluid accumulation. The degree of opacity correlates with the extravascular fluid volume (Fig. 2.35b).
 Edema requires differentiation from infection during the interpretation of thoracic CT in ICU patients.
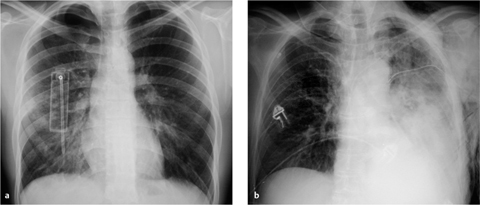
Fig. 2.34 a, b Reexpansion edema.
a Reperfusion edema following a right-sided pneumothorax.
b Reexpansion edema following a massive left-sided pneumothorax.
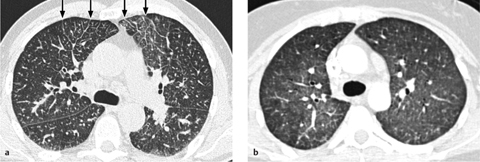
Fig. 2.35 a, b Edema as seen by CT.
Pulmonary edema can have a range of appearances on CT scans.
a Interstitial edema with thickened interlobular septa (Kerley lines).
b Diffuse ground-glass opacity due to alveolar fluid accumulation.
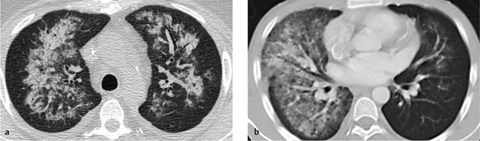
Fig. 2.36 a, b “Infiltrative” spread of pulmonary edema.
Edema, like consolidation, may show an “infiltrating” pattern of involvement. Note the asymmetrical distribution and sparing of the subpleural space.
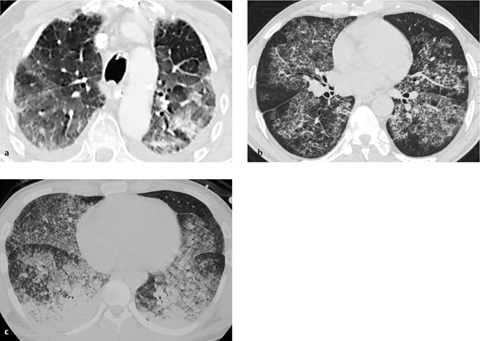
Fig. 2.37 a–c Differential diagnosis of edema.
Diffuse alveolar opacities are nonspecific in themselves and may result from a range of conditions.
a ARDS.
b Alveolar proteinosis (“crazy paving”).
c Parenchymal hemorrhage in Goodpasture syndrome (antero-posterior gradient).
 The subpleural space is typically spared or less severely involved (Fig. 2.36a). Sometimes the opacities show a geographic pattern in which they are sharply demarcated by interlobular septa.
 Alveolar edema is gravity-dependent. As a result, ground-glass opacity and consolidation are most pronounced in the dependent portions of the pulmonary lobes (increased lobar anterodorsal density gradient). Thickened interlobular septa, on the other hand, are most clearly defined in anterior lung regions.
 The opacities are generally bilateral but are not necessarily symmetrical. As on radiographs, the edema pattern may be very patchy and inhomogeneous, sharply delineated from areas of nonconsolidated lung (Fig. 2.36b).
 The clinical presentation, course, and distribution of opacities can help narrow the differential diagnosis. Edema should always be considered in the differential diagnosis of ICU patients.
Differential Diagnosis
Pulmonary edema does not have specific radiographic or CT features. It presents with the relatively nonspecific morphologic findings of intra-alveolar transudate or exudate (alveolar filling). This material, consisting of fluid and cells, is cleared by lymphatic and venous drainage, creating a superimposed pattern of reticular and septal opacities. This “crazy paving” pattern is found in various other conditions such as:
 permeability edema / diffuse alveolar damage (DAD, ARDS; Fig. 2.37a)
 pneumonia
 alveolar proteinosis (Fig. 2.37b)
 pulmonary hemorrhage (Fig. 2.37c)
The clinical presentation (e. g., inflammatory markers, hemoptysis), course (change within hours or days), and distribution of the opacities (gravity-dependent, subpleural sparing, diffuse or patchy) are helpful in narrowing the differential diagnosis. Especially in ICU patients, it is often important to include edema in the differential diagnosis rather than interpret all pulmonary opacities as pneumonia.
Adult Respiratory Distress Syndrome
I. Noebauer Huhmann, L. Kramer, and C. Schaefer-Prokop
Definitions
Clinical parameters. Adult respiratory distress syndrome (ARDS) is a clinical diagnosis prompted by severe, acute respiratory failure in an adult patient. It is the most severe form of acute lung injury (ALI; PaO2/FIO2< 300 mmHg) and was defined at a 1994 consensus conference by the following criteria:
 hypoxia with PaO2/FIO2 < 200 mmHg, requiring mechanical ventilation
 bilateral diffuse infiltrates on the frontal chest radiograph
 pulmonary artery wedge pressure < 18 mmHg
The mortality rate of ARDS is ca. 50% and depends on the age of the patient and the severity of the condition. Despite advanced intensive care measures, it is only recently that mortality has been reduced as a result of new ventilation strategies with optimized parameters, measures such as ECMO (extracorporeal membrane oxygenation), prone positioning, and improvements in the prevention and treatment of infection.
Radiographic findings. The definition of ARDS established by the American–European Consensus Conference (AECC) takes into account clinical parameters in addition to the radiographic finding of “diffuse bilateral infiltrates.” Infiltrates are defined as ill-defined lung opacities not associated with tissue destruction or displacement, while “diffuse” means greater than 80% involvement of the radiographic lung area.
It should be emphasized, however, that the criterion of “bilateral infiltrates consistent with pulmonary edema” is not sufficient for the diagnosis of ARDS. Instead, the diagnosis of ARDS is based on a combination of clinical and radiographic findings. A lung opacity that remains stable or increases over a period of several days may be consistent with ARDS if the clinical respiratory parameters conform to the above definitions. Conversely, a diagnosis of ARDS is unlikely if the radiographic findings change within a matter of hours or there is no evidence of (increasing) consolidation.
Etiology
ARDS may have a variety of causes. A basic distinction is drawn between direct and indirect risk factors (Table 2.7). It is common for multiple risk factors to coexist in the same patient. They may immediately precede the acute respiratory failure or may antedate it by hours or days.
Pathophysiology
Pathophysiologically, ARDS represents the most severe form of permeability edema, in which diffuse alveolar damage (DAD) supervenes and dictates the further course of the syndrome.
Permeability edema alone is found only during the initial phase of ARDS. This condition is marked by damage to the capillary endothelium, allowing fluid to pass into the interstitium. The dominant and decisive mechanism, however, is diffuse damage to the alveolar epithelium. This causes flooding of the alveoli with proteinaceous fluid, leading to cell necrosis and inciting a hyperplastic inflammatory reaction of the alveolar epithelium with atelectasis and hyaline membrane formation. This process may culminate in end-stage fibrosis.
While the lung damage was once thought to be inhomogeneous, today it is believed that the entire lung is uniformly affected. Much as in a sponge, the edematous fluid increases the density and weight of the lung tissue, leading to the compression and atelectasis of dependent lung areas.
Phases of Adult Respiratory Distress Syndrome
The pathophysiology of ARDS is characterized by the following phases:
Early or exudative phase (24 hours). This phase develops within hours of the pulmonary insult and is characterized by edema of the interstitium and alveolar wall. The alveoli fill with a proteinaceous exudate containing red blood cells. This is accompanied by capillary congestion with the formation of fibrin thrombi in the capillaries, arterioles, and venules.
Intermediate phase (days 2 to 7). The alveolar edema becomes more compact and contains leukocytes and macrophages. Hyaline membranes are formed. As cellular proliferation increases, the edema is absorbed and areas of atelectasis develop.
 ARDS consists of an early or exudative phase, an intermediate phase, a late or proliferative phase, and an end stage.
 ARDS is a “clinical” diagnosis based on a combination of clinical and imaging findings.
Direct insults | Indirect insults |
|
|
 Aspiration
 Severe pneumonia
 Near drowning
 Toxic inhalation
 Lung contusion
 Sepsis
 Extrathoracic trauma
 Transfusion reaction
 Hypotension (shock)
 Burns
Burns Disseminated intravascular coagulation
 Pancreatitis, circulating toxins
 Air or fat embolism
 Clinical manifestations of ARDS may precede radiographic changes by more than 12 hours.
End stage. Patients who survive ARDS develop varying degrees of interstitial fibrosis. Only a small percentage of patients with a benign course have a good recovery with no impairment of pulmonary function.
Diagnostic Strategy
Radiography. The chest radiograph is part of the diagnostic workup and is used for follow-ups. Chest radiographs have a diagnostic accuracy of ca. 84% for detecting the presence of ARDS, but they are much less sensitive in detecting complications.
Computed tomography. CT has assumed an increasingly important role in the evaluation of ARDS patients. This is due mainly to the higher sensitivity of CT in detecting pulmonary complications such as pneumonia, abscesses, interstitial emphysema and hyperinflation, and mediastinal pathology (Table 2.8). At the same time, CT has contributed greatly to understanding the pathophysiology of ARDS and its response to mechanical ventilation. In the future, CT may play an even greater role in documenting the effects of various ventilation techniques.
Imaging
Radiography
ARDS is a clinical diagnosis. The nature, distribution, and extent of radiographic lung opacities are highly variable (Fig. 2.38a, b).
It should be noted that the clinical manifestations of ARDS may precede radiographic findings by more than 12 hours. Patients may already be markedly hypoxemic and still have a relatively normal-appearing chest film. This can be a useful differentiating feature from cardiogenic edema, in which radiographic changes tend to be synchronous with clinical manifestations.
Phases
Radiographs can demonstrate the successive phase of ARDS, although today the disease is usually modified by intensive care and rarely takes a “classic” course. The phases are described as exudative, proliferative, and fibrotic (Table 2.9).
Early or exudative phase (24 hours, stage I). The only initial finding in the chest radiograph may be elevation of the hemidiaphragm as a result of microatelectasis. Very little exudation occurs initially, and respiratory failure is due mainly to reduced compliance. These initial changes are soon followed by interstitial edema with thickening of vascular and bronchial walls and blurring of the pulmonary hila.
Intermediate phase (days 2 to 7, stage II). The early intermediate phase (days 2–4) is characterized by increased opacities spreading to all regions of the lung as the interstitial edema progresses to alveolar edema. The mediastinal shadow and diaphragm leaflets become less distinct and eventually are completely obscured (Fig. 2.38a, b). Extreme cases develop a densely opacified “white lung” with a positive air bronchogram. The patient is extremely hypoxic at this stage (Fig. 2.38c). The right ventricle and pulmonary arteries may be enlarged.
In the late intermediate phase (days 4–7) the opacities become more inhomogeneous and show a less compact distribution as focal and patchy opacities alternate with increased linear and reticular markings (Fig. 2.38d). Regional lucencies due to mechanical ventilation and foci of pneumonia produce a heterogeneous pattern.