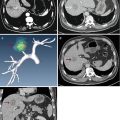
Fig. 26.1
2D CT image and the relevant 3D images. (a) The original CT image of the patient. (b) The surface rendering image of the liver (brown), the tumor (yellow), the bile ducts, the gallbladder (green), and the important pipeline structures (HA, red; HV, blue; PV, white)
26.2.3 Data Analysis of the 3D Spatial Relationships
After reconstruction of the 3D medical imaging, the interventional radiologists can now perform various operations on the 3D medical imaging, such as hiding, visualizing, moving, scaling, rotating, and measuring. Data analysis can be carried out, and the 3D spatial relationships of the tumor and surrounding vital structures can be visualized in a 3D scene of the 3D computer-assisted therapy planning system. As shown in Fig. 26.2, from the graphical user interface (GUI) of the 3D computer-assisted therapy planning system, the interventional radiologists were able to see that the volume of the tumor was 8.6 ml; the maximum diameter of the tumor was 29.5 mm; and the shortest distance from the tumor to the HA, HV, PV, and gallbladder was 20.2, 2.4, 19.4, and 2.5 mm respectively.

Fig. 26.2
From the 3D image navigation software, tumor volume, maximum diameter of the tumor, and minimum distance from the tumor to the surrounding duct system are calculated and displayed in the 3D scene
26.2.4 Volume Rendering Reconstruction
Volume rendering technique is considered as the standard method in 3D medical image processing [27]. Surface rendering techniques can reconstruct the surface contours of the anatomical structures, but the internal information about the structures is disregarded. Volume rendering techniques can provide a volumetric display by rendering the entire volume of the data. Each attenuation value is attributed to a relative shading of opacity and color. The brightness of each voxel is determined by calculating a virtual light source [28]. Because the color and opacity of each attenuation value can be modified interactively, volume rendering is particularly helpful for the visualization of complex anatomical structure such as bones, vessels, tumors, and livers [12].
Because the contour of the structure does not need to be extracted beforehand and the voxel is used as the basic modeling unit, the reconstructed 3D medical imaging of the volume rendering reconstruction can be rendered and viewed directly. Using volume rendering techniques, the anatomical structures can be shown on the screen with rich internal details. 3D medical images of the volume rendering reconstruction are all of high quality, but the quantity of an operation is too large and the volume rendering process is slow. Volume rendering imaging can offer spatial information to assist interventional radiologists to determine the entry point and direction of the MW antennas without blocking the ribs.
Using volume rendering reconstruction tools, 3D medical images from the CT data of the patient are displayed in the GUI as shown in Fig. 26.3.

Fig. 26.3
The volume rendering imaging of CT data. These 3D images have more rich internal details than the surface rendering 3D images, but their interactive performance and efficiency of the algorithm are poor
26.2.5 Combining Surface Rendering and Volume Rendering Reconstruction
According to the need of the preoperative plan, we combined surface rendering technique with volume rendering technique to reconstruct the anatomical structures for MWA. The liver, the tumor, the gallbladder, the HA, the HV, and the PV are reconstructed by surface rendering; other relevant anatomical structures of the abdomen in the CT image data are reconstructed by volume rendering.
As shown in Fig. 26.4, the tumor, the liver, the gallbladder, and the important pipeline structures (surface rendering) are displayed on the GUI, and its surrounding organs and structures (volume rendering) are displayed on the GUI simultaneously in the original place.

Fig. 26.4
Combining display of the tumor, the liver, the gallbladder, and important pipeline structures (surface rendering) and its surrounding organs and structures (volume rendering) in the original place. The combining display method provides fast interaction by surface rendering and displays the relevant organs and structures by volume rendering simultaneously
26.2.6 Virtual Reality
Virtual reality (VR) refers to a technique which uses a computer interface to simulate the 3D medical imaging of the anatomical structures, in a synthetic environment, a real or imaginary world, through the computer operator’s senses. These are most commonly visual, tactile (haptic), or auditory senses and allow for an interactive, virtual environment. VR can simulate environments and create the effect of an interactive three-dimensional world in which virtual instrumentation can be used to perform therapeutical procedures in the simulated environments (Fig. 26.5).

Fig. 26.5
The interactive graphical user interface of virtual reality environment. During the simulation puncture operation, the 3D models of the US probe, ablator antenna, and anatomical structures are showed in real time on the 3D GUI; and the corresponding CT image and the contours of the 3D models are showed in real time on the 2D GUI too
26.3 Assistant Platforms
On the basis of 3D medical imaging and a patient-oriented risk analysis by using objective parameters, a virtual preoperative planning of the operation and an ablation evaluation of the risk–benefit analysis can be helpful in improving patient selection, reducing postoperative complications, and offering a potential new basis for therapeutic strategies. Combined with the 3D visualization technology and the VR technique, an assistant platform for 3D preoperative planning and an evaluation platform for 3D preoperative planning are established.
26.3.1 Assistant Platform for 3D Preoperative Planning
For MWA therapy, planning of puncture routes, antenna number, and locations of zones and any possible monitoring points need to be laid out carefully in advance. In a published study, regular prism and regular polyhedron models for preoperative planning are created for liver tumor ablation to minimize the number of ablation spheres, optimize the overlapping mode, and determine MW antenna placement [7]. 3D preoperative planning is performed by the interventional radiologist in an interactive way, until the optimal therapy plan is achieved. The plan includes the pose of the microwave probe and the microwave working time and power [29]. The purpose of preoperative planning is to predict the time–temperature profile and tumor-free safety margins before MWA. An accurate planning can assist interventional radiologists to improve the accuracy of the therapy, lower the rate of complications, and improve long-term survival outcomes.
Many researchers [30–33] reported that preoperative planning methods based on the 3D image data were feasible for thermal ablation. Computer 3D medical imaging of thermal therapy taking into account patient-specific anatomies was developed for hyperthermia applications [26, 29, 34–36]. In our self-developed 3D computer-assisted therapy planning system, preoperative planning is performed in a VR simulation environment based on patient-specific CT data. After finishing segmentation, surface rendering reconstruction, data analysis of the 3D spatial relationships, and volume rendering reconstruction, the VR simulation environment is established.
In the GUI of computer-assisted therapy planning system, interventional radiologists can adjust (including axial, rotate, and panning adjustment) the antenna path in accordance to the need for MWA.
According to our previous study [37–39], we set the power at 50 W and described the ablation zone as ellipsoid (when the emission time is 10 min, the short ellipse diameter (S) is 3 cm, and the long ellipse diameter (L) is 3.5 cm). The volume of the ablation zone is calculated in the 3D computer-assisted therapy planning system.
The GUI of the 3D preoperative plan is displayed in real time as shown in Fig. 26.6.

Fig. 26.6
The 3D preoperative planning is achieved, and two antennas are needed to ablate the tumor completely
26.3.2 Evaluation Platform for 3D Preoperative Planning
The tumor map method by Rieder et al. [40] is selected in our system as one of our ablation evaluation tools. The tumor map is a pseudo-cylindrical mapping of the tumor surface onto a 2D image. It is used in a combined visualization of all ablation zones to allow a trustworthy therapy assessment. In the ablation evaluation platform, the safety margin of the ablation zone is 5 mm around the tumor surface, three ablation zones (see Fig. 26.7) in the spatial extent of the tumor are determined, and a light color scheme is used to emphasize the ablation state. The light color scheme is described as follows:

Fig. 26.7
The 3D tumor model and color scheme of the coagulation zones. Red, not ablated tumor tissue; yellow, tissue outside of margin; green, tissue inside of margin
I.
The ablation zone of the tumor inside of the safety margin is marked with green.
II.
The ablation zone of the tumor outside of the safety margin is marked with yellow.
III.
The zone of the tumor which could not be ablated is marked with red.
Under the assistance of the ablation evaluation platform, interventional radiologists can interact with the virtual instrumentation to evaluate and optimize the preoperative planning in a 3D VR environment.
26.3.3 The Principles for 3D Preoperative Planning
In order to validate the clinical value of the application of 3D visualization technology, relevant clinical trial studies have been performed for MWA therapy. Enrolment conditions for the patients were as follows: liver cancer patients who met the indications for MWA and patients exhibiting close relationship between the tumor and the surrounding organs on 2D CT images.
Related posts:
 Microwave Ablation Combined with Cellular Immunotherapy for Hepatocellular Carcinoma
 Microwave Ablation for Malignant Liver Tumors Adjacent to the Hepatic Hilum
 Microwave Ablation of Large (≥5.0 cm) Hepatocellular Carcinoma
 Effectiveness of Contrast-Enhanced Ultrasound in Evaluating Microwave Ablation of Renal Cell Carcinoma
 Microwave Ablation in Other Tumors (Lung, Breast, and Bone)
 Clinical Application of Three-Dimensional Visualization Techniques in Microwave Ablation for Liver Cancer
Stay updated, free articles. Join our Telegram channel

Full access? Get Clinical Tree


