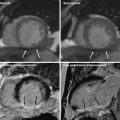
Fig. 1
Short-axis reconstruction through the left ventricle illustrating locations of ROI and corresponding LV myocardium attenutation values (in HU)
Analysis of the LV myocardium enhancement demonstrated that the lateral myocardial LV wall has a mean attenuation of 79.4 HU (42.3–162.7 HU) in the mid ventricle compared with the inferior, septal, and anterior LV wall segments at this level, which demonstrate a mean attenuation of 103.9 HU (11.4–159.6 HU). This study suggested that there is differential enhancement of the left ventricle myocardium at rest in patients with normal epicardial coronary arteries as demonstrated on 320MDCT.
Assessment of CTP using 320MDCT and vasodilator stress was performed in a cohort of patients without documented CAD (Kühl et al. 2012). This prospective study recruited healthy subjects to one of three groups, each with 14 subjects as follows: group 1a had MPI at rest using 13NH3–PET, group 1b had rest CTCA–CTP, and group 2 had rest CTCA–CTP and stress CTP using adenosine infusion at 140 mcg⋅mL−1⋅min−1. LV analysis was performed using a 16-segment AHA model (apex excluded). The myocardium was divided into three layers: the sub-endocardium, the mid-myocardium, and the sub-epicardium; the relative TPR was calculated for each segment. The results confirmed the differential segmental perfusion of the LV myocardium that had been previously demonstrated on CTP; the highest values were measured in anteroseptal segments, 1, 2, 3, 7, 8, 9, while the lowest values were observed in the lateral wall in segments, 5, 6, 11, 12, and 16. This pattern of perfusion was mirrored by 13NH3–PET. At rest, sub-endocardial perfusion was higher than for the mid-myocardium and the sub-epicardium. With vasodilator stress, there was a 21 and 23 % increase in perfusion to the mid-myocardium and the sub-epicardium, respectively, which eliminated any significant density gradient between these layers. Similarly, the overall increase in myocardial perfusion due to vasodilator stress also led to a significant reduction in segmental variation of relative perfusion values. This study demonstrated that segmental differences in LV myocardium perfusion seen with 320MDCT in healthy subjects are mirrored using 13NH3–PET imaging and that this may be a true physiological phenomenon rather than artifact. In addition, vasodilator stress significantly increases overall myocardial perfusion and decreases the segmental and transmural variation in LV perfusion.
However, motion and beam hardening artifacts can influence the relationship between the measured CT attenuation number and concentration of iodinated contrast (Mehra et al. 2011a, b). Motion artifact are minimized through the use of beta blockers during combined CTCA and CTP protocols. Beam hardening artifacts occur when there is preferential absorption of low-kV photons as the X-ray beam passes through the iodinated CM. The resulting higher energy emergent X-ray beam produces beam-hardening artifacts which simulate perfusion defects in the LV myocardium (Brooks and Di Chiro 1976; Zatz and Alvarez 1977).
The characteristics of beam hardening artifacts were evaluated in a phantom study using the 320MDCT (Kitagawa et al. 2010). An anthropomorphic LV urethane phantom was constructed with and without lesions that simulated perfusion defects that measured 50 % of the LV wall thickness in depth and 90 ° in circumference. An 18-mm syringe simulated the thoracic aorta and both were placed in an anthropomorphic chest phantom, which had water bags placed within the thoracic cavity and around the chest phantom. The phantom was scanned with a 320MDCT unit using the following imaging protocol: collimation of 320 × 0.5 mm, tube voltage of 120 kV, tube current of 500 mA, and gantry rotation time of 350 ms. Half-reconstruction 3-mm thick images orientated along the LV short axis were reconstructed using a standard body kernel, FC13, without beam hardening correction (BHC); another set of images were reconstructed using the standard body kernel, FC03, but with BHC. The LV cavity and syringe were filled with water, scanned, and then filled with iodinated CM and re-scanned. The BHC correction algorithm compared the degree of beam hardening from areas of high contrast (iodinated contrast) to those from areas of water density in order to produce a corrected image (Olson et al. 1981). The attenuation of the “normal” perfused myocardium was measured without BHC. Beam hardening was defined if the measured attenuation was less than 2 SD of this value. The algorithm was then tested in a canine model with an induced 50 % reduction in hyperaemic flow either in the LAD or left circumflex (Cx) coronary arteries. The animal was placed in a 256MDCT such that the scan range covered the entire heart. Intravenous metoprolol (5–30 mg) was given to achieve a heart rate below 100 bpm and pancuronium (0.1 mg⋅kg−1) to minimise respiratory motion artifacts. An infusion of intravenous adenosine (0.14 mg⋅kg−1⋅min−1) was given over 5 min during which time intravenous CM containing 370 mg iodine⋅mL−1 was injected at 4 cc⋅s−1 for 6 s. Image acquisition was performed using a dynamic volume CT scan mode with a detector collimation of 256 × 0.5 mm, a gantry rotation time of 500 ms, tube potential of 120 kV, tube current of 100 mA, and a scan time of 60 s. Short axis 0.5 mm images were created through the mid ventricle using a mid-diastolic phase and multi-segmented reconstruction, with and without BHC. ROIs were drawn in the LV wall and in the left and right ventricular cavities; TACs were calculated for each ROI. Upslope analysis was performed by comparing the TAC for the LV blood pool to the peak enhancement in myocardium, normalized by the peak LV blood pool enhancement. Assessment of MBF was compared with injected microspheres. The phantom data confirmed that beam hardening artifacts interfered with the demonstration of perfusion defects. However, the BHC algorithm effectively improved the demonstration of the true defects and accounted for the presence of iodinated CM in the LV cavity and descending thoracic aorta. The BHC had a variable influence on improving the upslope perfusion analysis in the canine model with an unpredictable performance in the interventricular septum. This study demonstrated that beam hardening artifact is an important confounder in CT assessment of myocardial perfusion and that it can be partially corrected in vivo using a BHC algorithm.
Intracoronary pressure-derived fractional flow reserve (FFR) is the clinical gold standard for assessing the need for revascularization of a discovered coronary artery stenosis (Pijls et al. 1996). The utility of CTP and combination CTCA/CTP with 320MDCT for evaluating patients under consideration for revascularization was compared with FFR in 42 patients who presented with chest pain and had greater than 50 % luminal stenosis on coronary angiography (Ko et al. 2012). All patients had FFR, CTA, CTP, and delayed contrast enhanced cardiac CT within 14 days of the catheter coronary angiography. Of this study cohort, 31 out of 42 (74 %) patients had perfusion abnormalities on CTP, 22 patients (52 %) had a single-vessel territory perfusion defect and 9 (21 %) had two-vessel territory perfusion defects. The majority (60 %) of perfusion defects were located in the LAD territory. All perfusion defects on CTP were reversible. FFR was performed in 68 % of all vessels and when compared with CTA, CTA had a sensitivity, specificity, PPV, and NPV of 93, 60, 68, and 90 % for significant coronary artery disease. In comparison with FFR, CTP had the following performance; sensitivity 76 %, specificity 84 %, PPV 82 %, and NPV 79 %. The combination of a stenosis ≥50 % on CTA and a perfusion defect on CTP had a sensitivity of 68 %, NPV 77 %, specificity 98 %, and PPV of 97 %. These results are illustrated in Table 1.
Table 1
Per vessel territory diagnostic accuracy of computed tomography coronary angiography, computed tomography myocardial perfusion imaging, and quantitative coronary angiography compared with fractional flow reserve (n = 86)
CTA DS ≥50% | Perfusion defect on CTP | CTA DS ≥50 % and perfusion defect on CTP | CTA DS ≥50 % or perfusion defect on CTP | QCA DS ≥50 % | QCA DS ≥70% | |
|---|---|---|---|---|---|---|
True positive (n) | 38 | 31 | 28 | 41 | 29 | 11 |
False positive (n) | 18 | 7 | 1 | 24 | 17 | 1 |
True negative (n) | 27 | 38 | 44 | 21 | 28 | 44 |
False negative (n) | 3 | 10 | 13 | 0 | 12 | 30 |
Sensitivity (%) | 93 (84–100) | 76 (62–89) | 68 (54–83) | 100 (89–00) | 71 (55–87) | 27 (12–41) |
Specificity (%) | 60 (43–77) | 84 (73–96) | 98 (93–100) | 47 (31–63) | 62 (47–78) | 98 (93–100) |
PPV (%) | 68 (53–82) | 82 (67–96) | 97 (89–100) | 63 (49–77) | 63 (46–80) | 92 (72–100) |
NPV (%) | 90 (79–100) | 79 (65–93) | 77 (64–90) | 100 (81–100) | 70 (54–86) | 59 (48–71) |
Kappa statistic | 0.52 (0.35–0.69) | 0.60 (0.43–0.77) | 0.67 (0.52–0.82) | 0.52 (0.37–0.68) | 0.33 (0.13–0.53) | 0.25 (0.10–0.40) |
Accuracy (%) | 76 | 80 | 84 | 73 | 66 | 64 |
Interestingly, the combination of stenosis greater than 50 % on CTCA and a corresponding perfusion defect on CTP had 84 % accuracy for predicting ischemia, whereas a stenosis of greater than 50 % on CTA without a perfusion defect had 100 % accuracy for excluding a significant stenosis. The combination of CTCA and CTP was superior to QCA in predicting the need for coronary revascularization. However, discordant findings remained problematic as 37 % of vessels with a normal CTP and greater than 50 % stenosis on CTCA were above the ischemic threshold on FFR, and 67 % of vessels with greater than 50 % stenosis on CTCA and a perfusion defect had normal FFR. The likely explanation for the false positive CTP results was beam hardening or motion artifacts; false negative findings were likely due to a small perfusion defect or motion artifact.
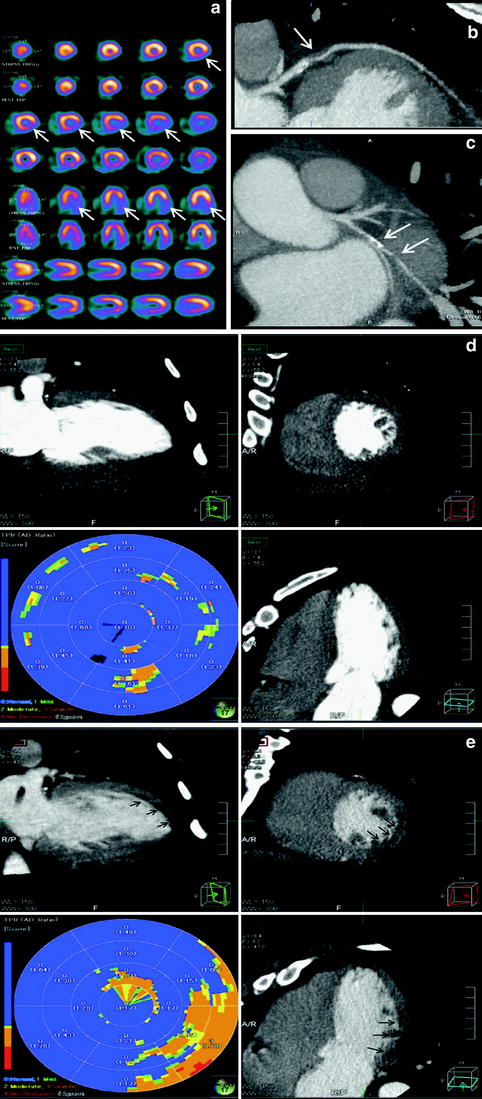
As the majority of patients referred for assessment of CAD will initially have non-invasive cardiac imaging under physiological stress, and in most cases this will be single photon emission computed tomography (SPECT MPI), there is increased interest in comparing the performance of CTCA and CTP against SPECT–MPI. A prospective study of 50 patients (36 males) with intermediate-to-high pre-test probability for CAD and a clinically indicated SPECT–MPI had a research 320MDCT scan performed within 60 days (George et al. 2012). Patients with a heart rate above 65 bpm were given oral or intravenous metoprolol. All patients were given intravenous hydration with 250–500 mL normal saline. The protocol is shown in Fig. 2.
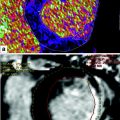
Fig. 2
Outline of a comprehensive cardiac computed tomography (CT) protocol for coronary artery calcium scoring (CACS), rest CT angiography and perfusion (CTA), stress CT perfusion (CTP), and delayed enhanced CT (DECT)
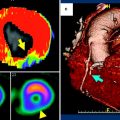
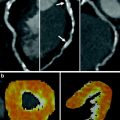
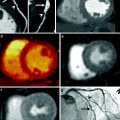
Analysis of rest and stress CTP were performed on a dedicated workstation (Myoperfusion, Toshiba Medical Systems, Otawara, Japan). 3 mm short axis images through the LV were analyzed using a 16-segment model (apex excluded) and by dividing the LV wall into the subendocardium, mid-myocardium, and subepicardium. The mean attenuation of each myocardial layer for each segment was calculated. The ratio of the subendocardial attenuation to the subepicardial attenuation for each segment was calculated to represent the transmural perfusion ratio (TPR). A ratio of less than 0.99 was recorded as abnormal. Coronary CTA analysis was performed using a 19-segment model for vessels larger than 1.5 mm in diameter; uninterpretable segments were excluded from analysis. A luminal stenosis over 50 % was taken as abnormal with a secondary analysis based on luminal stenosis greater than 70 %. 19 patients had coronary angiography. The mean Agatston score was 170 ± 281 (0–1148), CTCA demonstrated luminal stenosis greater than 50 % in 18 out of 50 (36 %) patients and greater than 70 % stenosis in 10 out of 50 (20 %) patients. CT perfusion (CTP) demonstrated perfusion abnormalities in 36 % (18 out of 50) patients and 21 % (32 out of 150) vascular territories, 75 % (24 out of 32) of which were reversible defects and 22 % (7 out of 32) were partially reversible. Figure 3 illustrates a case example of perfusion defects seen on 320MDCT.
 Time-Resolved CT Imaging of Myocardial Perfusion: Dual-Source CT
 Evaluation of the Myocardial Blood Supply: Single-Source, Single-Energy CT
 are We Interested in Viability?
 Assessment of Myocardial Viability: Quantitive Imaging
 Myocardial Perfusion Imaging: Clinical Implementation
 Evaluation of the Myocardial Blood Supply: Dual-Source Dual-Energy CT


Related posts:
Time-Resolved CT Imaging of Myocardial Perfusion: Dual-Source CT
Evaluation of the Myocardial Blood Supply: Single-Source, Single-Energy CT
are We Interested in Viability?
Assessment of Myocardial Viability: Quantitive Imaging
Myocardial Perfusion Imaging: Clinical Implementation
Evaluation of the Myocardial Blood Supply: Dual-Source Dual-Energy CT
Stay updated, free articles. Join our Telegram channel
Full access? Get Clinical Tree
