Fig. 1
Comprehensive cardiac DSCT protocol for the assessment of coronary artery disease (CAD) using a second-generation DSCT system. The protocol comprises coronary artery calcium scoring, morphological coronary CT angiography (cCTA), and functional assessment by time-resolved myocardial DSCT perfusion and delayed-enhancement imaging. If the proposed entire cardiac DSCT study is considered, including all four scans, the estimated radiation dose is approximately 18 mSv (Bastarrika et al. 2010b). A detailed description of scan parameters, medication, and contrast medium administration is shown in Table 1
The stress dynamic acquisition mode is started 3–4 min after the beginning of the infusion of intravenous adenosine (dose of 140 µg/kg/min). Myocardial perfusion CT data are acquired every other R–R′ interval at two alternating table positions in ECG-triggered mode at end systole (250 ms after the R-peak), with the table shuttling back-and-forth between the two positions during image acquisition (table acceleration: 300 mm/s2). A complete dataset of the whole cardiac volume is acquired every ~2.8 s. Given a detector width of 38 mm and a 10 % overlap between the two acquisition ranges, the anatomic coverage of this imaging technique is 73 mm. Recommended image acquisition parameters are 100 kV tube voltage and 300 mAs. The image acquisition sequence should be initiated 4 s prior to the arrival of the contrast medium bolus front as determined by the initial test bolus injection in order to ensure baseline acquisition of noncontrast images prior to the onset of first-pass perfusion. The myocardial DSCT perfusion examination requires 50 ml of contrast agent followed by 50 ml of saline, injected at 6 ml/s. The estimated radiation dose provided to patients with this dynamic stress-DSCT perfusion acquisition mode is approximately 10 mSv.
3.3 Data Reconstruction, Postprocessing, and Evaluation
To maintain CT value stability and high temporal resolution of the images, myocardial perfusion datasets are reconstructed using an approach that combines the results of two reconstructions into one final image stack. The high frequency components that predominantly contain the anatomical information (e.g. edges) are taken from a dual-source cardiac partial reconstruction providing 75-ms temporal resolution, whereas the low frequency components that predominantly contain the contrast information are taken from a 360° reconstruction providing 0.28-s temporal resolution (Bruder et al 2009).
For image analysis, myocardial perfusion datasets are reconstructed with 3 mm slice thickness every 2 mm with a medium sharpness convolution algorithm. Studies are processed using a dedicated software tool (Volume Perfusion software, syngo VA31, Siemens). Dynamic stress CT perfusion may be evaluated using qualitative, semiquantitative, or quantitative approaches. For qualitative analysis, it is recommended that dynamic stress-DSCT perfusion images are interpreted visually in conjunction with delayed-enhancement CT images. This approach may help to differentiate fixed from reversible myocardial perfusion defects (Bastarrika et al. 2010b).
For the semiquantitative perfusion analysis, dynamic stress CT perfusion image datasets need to be reformatted into 10 mm slice thickness, short-axis multiplanar reformats representative of basal, mid, and apical portions of the left ventricular myocardium so as to reproduce the 16-segment American Heart Association model (Cerqueira et al. 2002). Semiquantitative perfusion analysis is based on computing the upslope of the signal intensity over time curve from unenhanced myocardium to maximum signal intensity during the myocardial first-pass of the contrast agent, according to the “myocardial-to-left ventricular upslope index” method (Christian et al. 2004). In order to obtain the respective curves, epicardial and endocardial borders of the myocardium have to be defined with the aid of software. All perfusion parameters are usually normalized to blood pool signal intensity curves (Christian et al. 2004; Nagel et al. 2003).
For absolute myocardial perfusion quantification, a dedicated parametric deconvolution technique based on a two compartment model of intra- and extravascular space is used to fit the time-attenuation curves (Mahnken et al. 2010). In order to increase the precision of the fit, double sampling of the arterial input function (AIF) is performed. The input function is sampled in the descending aorta at every table position and combined into one AIF that possesses twice the sampling rate of the tissue time-attenuation curve (TAC). The algorithm then determines the maximum slope from the fit model curve for every voxel and calculates myocardial blood flow (MBF) according to the following relationship: MBF = Max Slope (TissueTAC)/Maximum (AIF), where the maximum slope reflects the tissue TAC and the maximum (AIF) indicates the maximum AIF value (Bamberg et al. 2010) (Fig. 2).
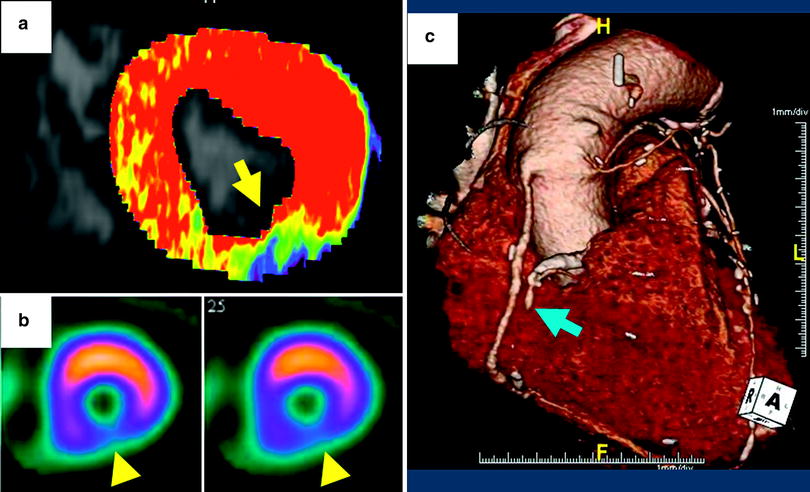
Fig. 2
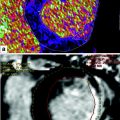
Quantitative and semiquantitative assessment of myocardial perfusion using dynamic, time-resolved DSCT perfusion imaging in a 53-year-old male with abnormal ECG. a Short-axis, color-coded perfusion maps (blood flow, BF) for quantitative assessment. The blue and green colored sections in the inferior wall reveal an area of hypoperfusion during the first-pass myocardial DSCT perfusion imaging. In contrast, the predominantly red colored wall segments represent normally perfused areas. b Semiquantitative assessment of myocardial perfusion. As shown, graphs demonstrate changes in HU values over time measured by ROI analysis in the myocardial segment of interest (each corresponding image is depicted above). The normally perfused segment (left) shows a higher maximum HU value (60 HU vs. 15 HU) and there is delayed wash-in and wash-out of contrast in the hypoperfused segment (right). c Short-axis stress perfusion SPECT imaging. The perfusion defect in the inferior wall on SPECT closely matches the CT perfusion map
4 Integrative Cardiac DSCT Protocol for the Assessment of Coronary Artery Disease
A suggested study protocol for comprehensive assessment of CAD using a second-generation DSCT system, including coronary artery calcium quantification, coronary DSCT angiography, first-pass myocardial perfusion, and delayed-enhancement imaging should be performed as follows (Table 1) (Bastarrika et al. 2010c).
Table 1
Comprehensive cardiac DSCT protocol for the assessment of coronary artery disease
Coronary Calciuma | Coronary CT angiographyb | Dynamic DSCT perfusion | Delayed enhancementc | ||
|---|---|---|---|---|---|
Current | Voltage (kVp) | 120 | 120 | 100 | 80 |
Current (mAs) | 73 | 320 | 300 | 320 | |
Modulation (R–R′ int.) | 70 % R–R′ | Max. 70 %; min. 30–90 % R–R′ | 250 ms post R | 70 % R–R′ | |
Acquisition | Collimation (mm) | 2 × 64 × 0.6 | 2 × 64 × 0.6 | 2 × 64 × 1.2 | 2 × 64 × 0.6 |
Sections | 2 × 128 × 0.6 mm | 2 × 128 × 0.6 mm | 2 × 128 × 1.2 mm | 2 × 128 × 0.6 mm | |
Rotation time (ms) | 280 | 280 | 280 | 280 | |
Reconstruction | Thickness/Incr. (mm) | 3/1.5 | 0.75/0.3 | 3/2 | 0.75/0.3 |
Algorithm | B35 | B26f (B46f if calcification or stent) | B23f | B26f | |
Medication | Adenosine | – | – | 140 µg/kg/min | – |
Test | Region of interest | – | Ascending aorta | – | – |
Test bolus (CM/S/F) | – | 15/50 ml at 6 ml/s | – | – | |
Delay | Test bolus | – | Peak time + 4 s | 4 s prior to the arrival of the CM bolus front | – |
Contrast | Concentration (mg I/ml) | – | High iodine concentration (370–400 mg I/ml) | – | |
Protocol (ml) | – | 70 ml CM + 50 ml mixture (30 % CM/70 % S) + 30 ml S at 6 ml/s | 50 ml CM + 50 ml S at 6 ml/s | – | |
4.1 Single Heart-beat, High-pitch CT Calcium Scoring
2 × 64 × 0.6 mm detector collimation (2 × 128 × 0.6 mm sections) by means of the z-flying focal spot technique, 280 ms gantry rotation time, 120 kV tube potential, and 73 mAs per rotation tube current time product.
4.2 Prospectively ECG-triggered Coronary CT Angiography
With 2 × 64 × 0.6 mm detector collimation (2 × 128 × 0.6 mm sections), 280 ms gantry rotation time, and 320 mAs per rotation tube current time product, 120 or 100 kV tube potential should be used for patients with body mass index greater than 25 kg/m2 or less than 25 kg/m2, respectively. Full radiation dose window should be set at 70 % of the R–R′ interval in patients with heart rates at or below 70 beats/min (bpm), and at 40 % of the R–R′ interval in patients with a heart rate above 70 bpm. If functional information is desired, adaptive prospective ECG-triggering may be used with the reduced dose (20 % of the nominal tube current) applied between 30 and 90 % of the R–R′ interval. Intravenous contrast is administered using a triphasic injection protocol with injection of 70 ml of pure, undiluted, high iodine concentration contrast material followed by a constant volume of 50 ml of a 70:30 % saline-to-contrast medium mixture, and finally 30 ml of pure saline, all injected at 6 ml/s. The study acquisition delay time may be estimated using the bolus tracking technique or the test bolus technique. For the latter, injection of 15 ml contrast medium at 6 ml/s, followed by 50 ml of saline is recommended. The actual delay time is calculated as the time of peak contrast medium attenuation in a region of interest in the ascending aorta plus 4 s. For coronary artery evaluation, datasets are reconstructed using 0.75 mm section thickness and 0.3 mm reconstruction increment at 40 or 70 % R–R′ depending on the heart rate (described above). An additional reconstruction during systole at 250 ms after the R-peak is recommended to plan the coverage range of the dynamic, time-resolved stress-DSCT perfusion acquisition.
4.3 Dynamic, Time-Resolved First-Pass Myocardial DSCT Perfusion
(Described Above)
4.4 Delayed-Enhancement Imaging
This last acquisition is performed 6 min after the first-pass myocardial DSCT perfusion study using a regular prospectively ECG-triggered mode with image acquisition at 70 % of the R–R′ interval, 2 × 64 × 0.6 mm detector collimation (2 × 128 × 0.6 mm sections), 280 ms gantry rotation time, 80 kV tube voltage, and 320 mAs per rotation tube current time product. Single heart-beat high-pitch DSCT acquisition may also be used for delayed-enhancement imaging in order to save radiation dose.
5 First-Pass Myocardial DSCT Perfusion Imaging: Preclinical Studies
Early studies performed to address feasibility of first-pass myocardial perfusion imaging using MDCT were performed in animal models. The major restriction of these initial studies was that they were limited by the width of the CT detector, so they could only aim at obtaining images corresponding to a specific section of the heart (George et al. 2007; Mahnken et al. 2006; Daghini et al. 2007). In the first study, evaluating the feasibility of myocardial first-pass perfusion imaging with MDCT, Mahnken et al. (Mahnken et al. 2006) included five pigs with acute myocardial infarction and compared dynamic contrast-enhanced MDCT results with the extension of the myocardial infarction after sacrifice. The authors concluded that MDCT allowed for the differentiation of infarcted myocardium (shown as hypoperfused area) and normal myocardium, and that MDCT had the potential for visual and semiquantitative assessment of first-pass myocardial perfusion (Mahnken et al. 2006). George et al. (2007) conducted another study on the ability of dynamic 64-row MDCT to provide an accurate measurement of myocardial blood flow during first-pass MDCT, using semiquantitative and quantitative analysis methods. In their study, myocardial perfusion was analyzed using a model-based deconvolution approach and two upslope methods. Results were compared with the microsphere-derived myocardial blood flow measurements. The authors concluded that measurement of myocardial blood flow provided by MDCT using upslope and model-based deconvolution methods correlated well with microsphere myocardial blood flow (George et al. 2007). Finally, in a different study, Daghini et al. (2007) assessed the ability of electron beam computed tomography and 64-row MDCT to evaluate indices of endothelial function and microvascular perfusion as determined by the myocardial microvascular permeability-surface area product and the fractional vascular volume. Obtained time-attenuation curves were analyzed using indicator-dilution and Patlak models. The authors concluded that the assessments obtained by 64-row MDCT were not reliable when using indicator-dilution analysis, likely due to the method’s sensitivity to scan duration, but the quantifications obtained using the Patlak model were feasible (Daghini et al. 2007).
With the advent of second-generation DSCT technology with higher temporal resolution, broader detectors, extended coverage, and implementation of a new scan mode that allows for dynamic scanning with a z-coverage of twice the detector width so as to include the whole heart in the acquisition, research on myocardial CT perfusion imaging has been invigorated (Haberland et al. 2010). In the first investigation of feasibility, preliminary animal experience study Mahnken et al. (2010) quantified differences in regional myocardial perfusion by assessing volumetrically myocardial blood flow, first-pass distribution volume, and intravascular blood volume in pigs with 80 % stenosis of the left anterior descending coronary artery. They observed that the amount of myocardial blood flow in the post-stenotic myocardium was significantly lower than the quantity of myocardial blood flow in the remaining normal myocardium, thus concluding that myocardial perfusion with DSCT is able to demonstrate the hemodynamic effect of high-grade coronary artery stenosis (Mahnken et al. 2010). In a more recent study, Bamberg et al. (2012) determined the accuracy of DSCT dynamic stress myocardial perfusion imaging to estimate myocardial blood flow in a porcine animal model with variable degrees of induced coronary artery stenosis in comparison with microsphere-derived myocardial blood flow. In this study, 50 and 75 % diameter luminal narrowing of the left anterior descending coronary artery were achieved after stent placement and balloon catheter inflation. Animals underwent adenosine-stress and rest myocardial DSCT perfusion with the described “shuttle mode” acquisition technique. Authors concluded that myocardial blood flow estimated by DSCT at rest and stress showed a valid difference with varying degrees of coronary stenosis. However, they noted that DSCT overestimated the amount of myocardial blood flow compared with microsphere-derived myocardial blood flow quantification (Bamberg et al. 2012).
6 First-Pass Myocardial DSCT Perfusion Imaging: Clinical Studies
In the clinical setting, the first technical note on dynamic first-pass myocardial DSCT perfusion published by Bamberg et al. (2010) detailed the principles of using model-based determination of regional myocardial blood flow by DSCT and demonstrated its in vivo applicability. After this proof of concept, the same group conducted a study in 33 patients who were suspected of having or were known to have CAD so as to determine the feasibility of dynamic, first-pass myocardial DSCT perfusion imaging to detect hemodynamically significant coronary artery stenosis (Bamberg et al. 2011b). In this study, the FFR was considered as the standard of reference. Authors observed that the diagnostic accuracy of DSCT for the detection of anatomically significant coronary artery stenosis was high, but had a low positive predictive value for the detection of hemodynamically significant stenosis. With the use of DSCT-derived myocardial blood flow quantification, almost 50 % of the coronary lesions were graded as not hemodynamically significant, a fact that significantly increased the positive predictive value of the test from 49 to 78 %. According to these authors, the presence of a coronary artery stenosis with a corresponding myocardial blood flow less than 75 ml/100 ml/min had a high risk for hemodynamic significance (Bamberg et al. 2011b).
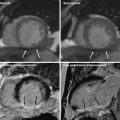
Using a similar cardiac DSCT perfusion imaging protocol, Bastarrika et al. (2010b) provided the first clinical evidence revealing that dynamic first-pass DSCT perfusion imaging under adenosine stress may enable the evaluation of qualitative and semiquantitative perfusion parameters in a comparable fashion as CMR. In this study, sensitivity, specificity, and positive and negative predictive values for detection of myocardial perfusion defects at DSCT compared with MRI were 86.1, 98.2, 93.9, and 95.7 %, respectively. Semiquantitative analysis of DSCT data showed significant differences between ischemic and nonischemic myocardium with a signal intensity upslope that was comparable to MRI-derived values. Authors found moderate correlation, however, between absolute DSCT-derived quantification of myocardial blood flow and semiquantitative DSCT measurements (Bastarrika et al. 2010b). The same group expanded their observation to 30 consecutive patients who underwent dynamic myocardial CT perfusion imaging under regadenoson stress and compared myocardial perfusion defects on DSCT with respect to CMR and SPECT, leading to similar conclusions (Weininger et al. 2011) (Fig. 3).
 Evaluation of the Myocardial Blood Supply: Single-Source, Single-Energy CT
 Assessment of the Myocardial Blood Supply: Quantitative Imaging
 are We Interested in Viability?
 Assessment of Myocardial Viability: Quantitive Imaging
 Myocardial Perfusion Imaging: Clinical Implementation
 Evaluation of the Myocardial Blood Supply: Dual-Source Dual-Energy CT


Related posts:
Evaluation of the Myocardial Blood Supply: Single-Source, Single-Energy CT
Assessment of the Myocardial Blood Supply: Quantitative Imaging
are We Interested in Viability?
Assessment of Myocardial Viability: Quantitive Imaging
Myocardial Perfusion Imaging: Clinical Implementation
Evaluation of the Myocardial Blood Supply: Dual-Source Dual-Energy CT
Stay updated, free articles. Join our Telegram channel
Full access? Get Clinical Tree
