Fig. 1
a Study protocol for a full cardiac computed tomography (CT) scan, including perfusion CT scan, is illustrated. Scan #1 is a test injection, scan #2 is an adenosine triphosphate (ATP)-stress dynamic (first-pass) perfusion CT, scan #3 is a rest (non-ATP) perfusion CT (coronary CT angiography), and scan #4 is a delayed scan. b Dynamic (first-pass) acquisition protocol for 256-slice computed tomography. Because the z-axis coverage is 8 cm, the end-systolic (ES) phase is targeted to cover whole heart in 1 rotation. For accurate quantification of myocardial blood flow (ml g−1 min−1), 1 rotation image (270 ms) is used to reduce artifacts. Scan parameters are optimized for 256-slice CT
The use of dynamic (first-pass) acquisition allows the best timing to depict ATP-induced ischemia as LDA. For the dynamic data acquisition, the use of low kilovolts and milliampere setting and iterative reconstruction are recommended to reduce radiation dose. The dynamic data acquisition allows quantification of myocardial blood flow (MBF), which is discussed later.
Perfusion CT should be done first to avoid polluting the dynamic data by the prior injection of contrast medium. Coronary CT angiography is performed later. Although the best scan timing for myocardial enhancement is about 5 s later, the acquisition for CT angiography can be used for the rest perfusion data. This method is considered not to increase the patient’s radiation dose.
Finally, as an option when the patient may have had a myocardial infarction, a delayed enhancement scan should be performed to assess myocardial damage (i.e., to assess viability).
3 Patterns (Normal, Ischemia, Infarction)
Enhancement patterns of stress/rest (or delayed scan) are illustrated in Fig. 2. The normal pattern is normal/normal (no delayed enhancement), the ischemic pattern is LDA/normal (no delayed enhancement), and the myocardial infarction pattern is LDA/LDA (delayed enhancement). In patients with myocardial infarction history, myocardial thinning is often seen, demonstrating scar formation.
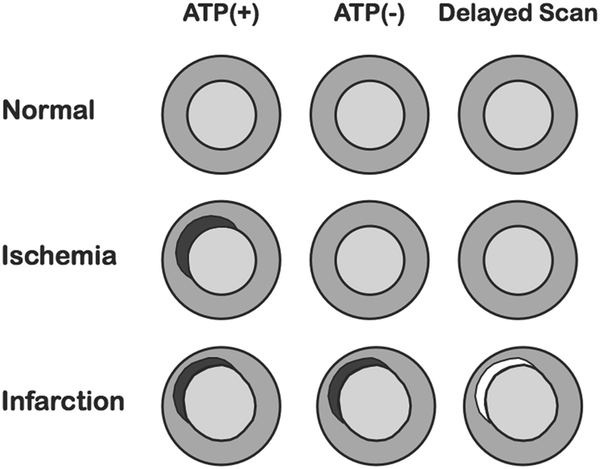
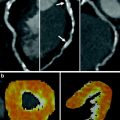
Fig. 2
Enhancement patterns of stress/rest and delayed scans are illustrated. In patients with ischemia, the low-density arc is seen only on adenosine triphosphate (ATP)-stress. In patients with myocardial infarction, the low-density arc is seen on both the ATP-stress and the rest scan, and the high-density arc is seen on the delayed scan
Angina pectoris in a patient with triple-vessel disease before and after coronary artery bypass grafting (CABG) is shown in Fig. 3. In this case, ATP-induced ischemia is seen as subendocardial LDA in the septum, the inferior wall, and in the lateral wall before CABG. CABG was performed in which the left internal mammary artery was used to bypass the proximal left anterior descending artery, a saphenous vein graft was placed in the left circumflex artery, and no grafting was done to the right coronary artery. Ischemia (LDA on ATP-stress) in the septum and lateral wall was diminished following CABG, but ischemia remained in the untreated inferior wall. The ischemia can be seen clearly with high spatial resolution.
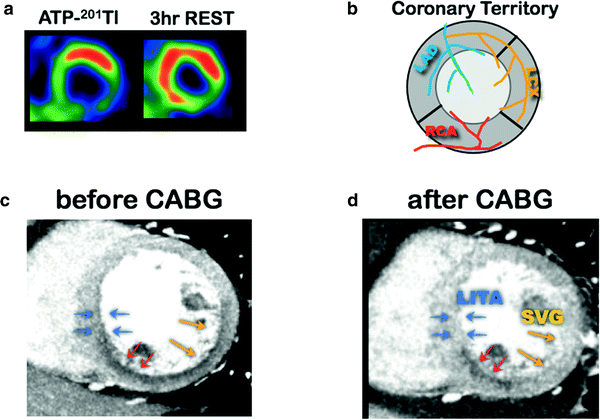
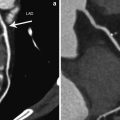
Fig. 3
A case of angina pectoris with triple-vessel disease before and after coronary artery bypass grafting (CABG). This patient had 50 % stenosis in the left main trunk (LMT), 90 % stenosis in the right coronary artery (RCA), and 90 % stenosis in the left circumflex (LCX) artery. Adenosine triphosphate (ATP)-induced ischemia is seen as a subendocardial low-density area (LDA) in the septum, the inferior wall, and the lateral wall before CABG. After CABG, in which the left internal mammary artery (LITA) was used to bypass the left anterior descending (LAD) artery, a saphenous vein graft (SVG) was placed to the LCX, and no grafting was done to the RCA, ischemia (LDA on ATP-stress) in the septum and lateral wall diminished, whereas ischemia remained in the untreated RCA territory
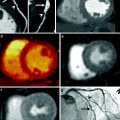
A patient with old myocardial infarction is shown in Fig. 4. In this case, subendocardial to transmural LDA is seen on both ATP-stress and rest scans with delayed enhancement. Myocardial wall thinning is also seen in the old myocardial infarction.
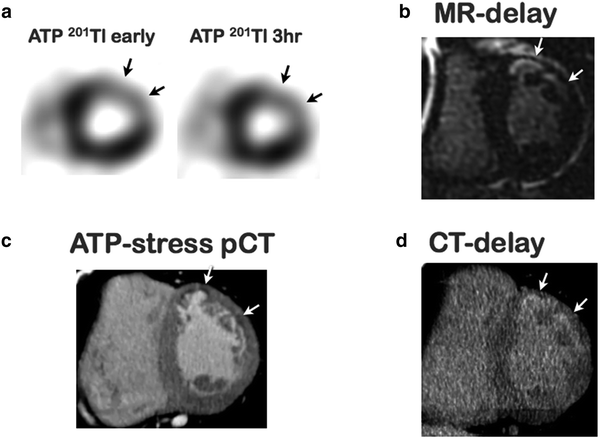
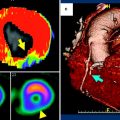
Fig. 4
A patient with old myocardial infarction. Comparable adenosine triphosphate (ATP)-stress/3 h rest 201Tl scan shows fixed defect (fixed severe hypoperfusion) in the anterolateral wall (a). Magnetic resonance (MR)-delayed enhancement is seen in the infarction (b). In the ATP-stress dynamic computed tomography (CT), perfusion defect is seen in same anterolateral wall (c) and the old myocardial enhancement is seen in the delayed scan (d)
4 Dynamic (First-Pass) Data Acquisition
Dynamic data acquisition during injection of the contrast medium enables visualization of the myocardial perfusion as an increase of density (Hounsfield units), although this requires an increase in radiation dose. Myocardial infarction is depicted as subendocardial or transmural low-density arc. Ischemic lesions can be depicted as low-density arcs on ATP-stress or adenosine stress acquisition. The advantage of dynamic acquisition over one-point acquisition is that it increases the detectability of a LDA, which appears only for a short period. Motion artifacts are distinguished from true findings by observing the cine (paging) of the dynamic images. Moreover, dynamic acquisition provides a time-density curve of myocardium and the aorta or left ventricle, enabling quantification of MBF.
5 Quantification of MBF
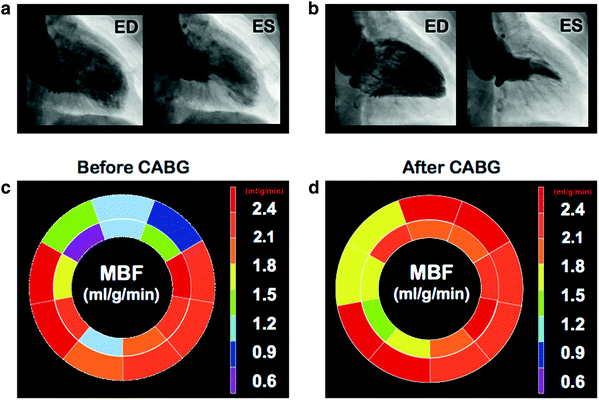
Absolute MBF (ml g −1min−1) has been quantified by 15O–H2O or 13N–NH3 dynamic (first-pass) positron emission tomography (PET) (Iida et al. 2000; Herzog et al. 2009). If similar dynamic data are obtained with CT, then MBF can be generated (Kido et al. 2008; Bamberg et al. 2011). Assessing MBF before and after CABG allows better evaluation of the outcome of CABG (Shikata et al. 2010). Figure 5 demonstrates a patient with angina pectoris with chronic total obstruction of the left anterior ascending artery with collaterals. In this case, in addition to the improvement of MBF reserve on ATP-stress scan, the motion of the anterior wall improved from akinesis to normokinesis. In most cases, after successful CABG surgery, an increase of MBF was observed on the ATP-stress scan (Fig. 6). There several methods to generate MBF from the dynamic data (Patlak et al. 1985; Lee et al. 2009; Slomka et al. 2012; Pack et al. 2008).
 Time-Resolved CT Imaging of Myocardial Perfusion: Dual-Source CT
 Evaluation of the Myocardial Blood Supply: Single-Source, Single-Energy CT
 CT Angiography: State of the Art
 are We Interested in Viability?
 Myocardial Perfusion Imaging: Clinical Implementation
 Evaluation of the Myocardial Blood Supply: Dual-Source Dual-Energy CT


Related posts:
Time-Resolved CT Imaging of Myocardial Perfusion: Dual-Source CT
Evaluation of the Myocardial Blood Supply: Single-Source, Single-Energy CT
CT Angiography: State of the Art
are We Interested in Viability?
Myocardial Perfusion Imaging: Clinical Implementation
Evaluation of the Myocardial Blood Supply: Dual-Source Dual-Energy CT
Stay updated, free articles. Join our Telegram channel
Full access? Get Clinical Tree
