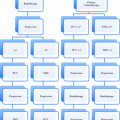
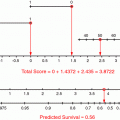
Fig. 1
An example of a clinical algorithm decision tool. Reprinted from Kanes et al. (2012), with permission from Elsevier
It is essential to understand the distinction between prognostic and predictive factors before one begins a discussion of the benefits and pitfalls of decisions tools. The distinction between these two terms is challenging for some individuals and can be misused (Italiano 2011). A prognostic factor is a “clinical or biologic characteristic that is objectively measurable and that provides information on the likely outcome of the cancer disease in an untreated individual” (Italiano 2011). In oncology prognostic factors such a tumor stage are used to identify patients at highest risk of relapse. Prognostic factors are used to determine the appropriate course of management.
In contrast, a predictive factor is a “clinical or biologic characteristic that provides information on the likely benefit from treatment (either in terms of tumor shrinkage or survival)” (Italiano 2011). In oncology predictive factors are used to identify sub-populations of patients who may benefit from a particular treatment such as hormone receptor status (ER/PR) in the use of adjuvant hormone therapy for breast cancer patients (Bast et al. 2001). In cardiology, hypertension and older age are predictive factors for stroke risk in patients with atrial fibrillation. A combination of predictive factors may be combined in a tool to determine the needs for anticoagulation therapy (Skanes et al. 2012).
Predictive and prognostic factors play a role in many diseases. For instance, there are established and validated decision support tools in management of atrial fibrillation. Mr. Smith is a 57 year-old man with newly diagnosed atrial fibrillation. Using a decision support model, CHADS2 index (Gage et al. 2001), his risks of stroke can be assessed relative to known prognostic and predictive factors including congestive heart failure, hypertension, age >75, diabetes mellitus and prior stroke or transient ischemic attack (Gage et al. 2001). This score is used to guide clinician decision making around the need for a type of oral anticoagulants (Gage et al. 2004). See Fig. 1.
1 Decision Tools to Predict Survival
Survival is often the most important clinical endpoint for any disease. Disease, by its nature, limits health and longevity, and interventions designed to combat the disease should create a measurable improvement in survival. As such, survival is the gold standard endpoint for Phase III clinical trials.
Survival is measured from the ‘start’ of a disease until the time the subject expires. As the actual starting time of a disease is often unknown, the usual practice is to measure survival from either the time of diagnosis or the time of definitive intervention. If diagnosis date is used, the issue of lead time bias may be encountered when diagnostic tests shift the time point when disease is detected thereby ‘extending’ survival when in fact, only the duration of detectable disease increases, not the duration of survival at the same point in the disease process (Rothman 2002). This can lead to errors in the application of predictive tools, as described below.
As it is not usually possible or desired to wait until all patients have reached the end of their life before assessing the result of a treatment, a running estimate of survival for a group is necessary. Outcomes estimates for patient groups are often created using the Kaplan–Meier survival estimate (Kaplan and Meier 1958). This statistical approach tracks patients from the time of diagnosis or treatment until death, but for patients who remain alive, their survival information is incorporated in a ‘censored’ fashion. This allows groups of patients with surviving members to contribute to estimates of survival. More advanced methods to estimate survival include competing risk models, which attempt to account for other non-disease related events, in predicting survival or other endpoints. This is similar to a disease-specific-survival approach and helps interpret the effects of a treatment on a disease when other disease processes may influence survival. In a sufficiently large random sample, these non-treatment related factors are thought to be balanced in each arm of the study, but in smaller studies, non-treatment related factors may be distributed unevenly and may bias the results. These methods allow this issue to be addressed statistically.
It is critical to note that survival estimates are just that, estimates for a population group, and applying these estimates to individual patients has uncertainties. With sufficient power, factors that contribute to survival may allow more careful estimation of patient survival, but never an exact prediction. This distinction is of critical importance in any decision support tool, as the purported goal of such a tool is to provide predictive capacity to previously opaque outcomes. The relative uncertainties and assumptions in a model of survival are required elements of any discussion that uses information from a decision support tool.
Mr. Smith’s stroke risk above was calculated to be approximately 4 %, but if only 5 patients in the whole study were included in his sub-group, there may be a very wide confidence interval on that estimate which could put the risk as low as 1 % or as high as 9 %. This range of uncertainty is almost as large as the difference between a low-risk group and a high risk group, but only applies to Mr. Smith’s subgroup because of the relative rarity of those factors in combination.
2 Predicting Toxicity
Toxicity prediction is more complicated than survival, largely due to the inherent challenges of defining exactly what constitutes a toxicity. Most large clinical trials employ the Common Toxicity Criteria espoused by the NCI, but this system tends to lump multiple symptoms into larger classifications (Trotti et al. 2003). Predictions of toxicity are enhanced by use of specific symptoms as the endpoint (Heemsbergen et al. 2006). Beyond that, the toxicities associated with treatment can change over time or as treatments themselves change (Yom et al. 2007). As such, any decision support tool that evaluates toxicity must define carefully the toxicity endpoint, the treatment details, and outcomes. Furthermore, the potential for toxicity must be weighed against the natural history of the disease being treated and expected outcomes from that disease (in cancer, often death).
In our atrial fibrillation example, the main toxicity of antithrombotic management is that of unanticipated hemorrhagic events, which can be fatal. Hemorrhagic risks increase with the severity of anticoagulation (aspirin (ASA) vs. ASA+clopidogrel vs. low dose dabigatran vs. high dose dabigatran, rivaroxaban, or warfarin. The HAS-BLED score (Pisters et al. 2010) uses factors of hypertension, abnormal liver or renal function, history of stroke/bleeding, labile INR, age >65, excess alcohol, or concomitant use of bleed promoting drugs. A HAS-BLED score allows clinicians to estimate risks of bleeding from 1 % (score 0–1) to 12.5 % (score 5) and has been validated in a hospitalized elderly population. Patients at high risk of bleeding events on this scale warrant increased monitoring. The risks of non-treatment (i.e.: stroke with significant associated deficits) remain greater than the risk of toxicity (i.e.: bleeding, with less deficits than stroke) but each individual case requires a decision which balances both risks.
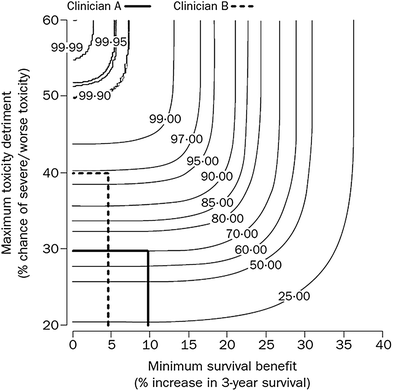
Toxicity prediction is also complicated by the duration of toxicity (Trotti et al. 2007). Long term low level toxicity may be less tolerable than short duration high toxicity that resolves. Toxicity metrics that attempt to integrate the effects on lifetime symptom burden will become more relevant as longer term toxicity information becomes available. Estimates of ‘uncomplicated control’ where a patient has the ideal outcome of cure and survival without toxicity may become the ideal endpoint for future decision support tools. Combinations of toxicity and survival including ‘complicated control’, ‘complicated failure’, and ‘uncomplicated failure’ will become more common in decision support tools as these predictions are included. A risk: benefit contour is one possible mechanism to assist in decision making between toxicity and control (Shakespeare et al. 2001) (see Fig. 2).

