Fig. 1
TOF-SIMS ion images of a complete sagittal rat brain section (22.4 × 22.4 mm2). (a–c) TOF-SIMS ion images in the positive ion mode. (a) m/z 184.1 (phosphocholine head group); (b) m/z 385.4 ([cholesterol-H]+); (c) m/z 796.8 ([PE 40:4 + H]+, [PE38:1 + Na]+, or [PC34:2 + K]+). (d–g) TOF-SIMS ion images in negative ion mode. (d) m/z 283.2 (fatty acid carboxylate [C18:0 − H]−); (e) m/z 429.3 ([vitamin E–H]−); (f) m/z 888.9 ([ST d18:1/24:1 − H]−); (g) three-color overlay between TOF-SIMS ion images C16:0 carboxylate ion (red), vitamin E (green), and [ST d18:1/18:0 − H]− (blue). For all TOF-SIMS images: primary ion Bi3 2+, 50 keV, 3.4 × 10⁸ ions/cm2, area 22.4 × 22.4 mm2, 256 × 256 pixels, pixel size 87.5 × 87.5 μm2. The amplitude of the color scale corresponds to the maximum number of counts, mc, and could be read as [0, mc]. tc is the total number of counts recorded for the specified m/z (it is the sum of counts in all the pixels). (h) An optical ion image of the sagittal rat brain section. Adapted with permission from ref. [12]
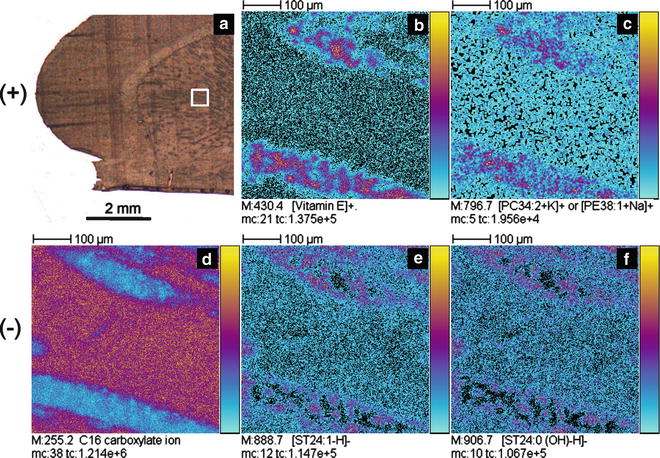
Fig. 2
 MALDI Mass Spectrometry Imaging of Lipids and Primary Metabolites on Rat Brain Sections
Imaging of Plant Materials Using Indirect Desorption Electrospray Ionization Mass Spectrometry
MALDI Mass Spectrometry Imaging of Lipids and Primary Metabolites on Rat Brain Sections
Imaging of Plant Materials Using Indirect Desorption Electrospray Ionization Mass Spectrometry
 Laser Ablation Sample Transfer for Mass Spectrometry Imaging
 Nanostructure Imaging Mass Spectrometry: The Role of Fluorocarbons in Metabolite Analysis and Yoctomole Level Sensitivity
 DESI Imaging of Small Molecules in Biological Tissues
 Nanoparticle-Assisted Laser Desorption/Ionization for Metabolite Imaging


TOF-SIMS ion images of a zoom-in sagittal rat brain section (500 × 500 μm2). (a) An optical picture of the sagittal rat brain section. Ion images were recorded in the square delimited in white. (b, c) TOF-SIMS ion images in the positive ion mode. (b) m/z 430.4 ([vitamin E]+). (c) m/z 796.7 ([PE 40:4 + H]+, [PE38:1 + Na]+, or [PC34:2 + K]+). (d–f) TOF-SIMS ion images in the negative ion mode. (d) m/z 255.2 (C16:0 carboxylate ion). (e) m/z 888.7 ([ST d18:1/24:1-H]−). (f) m/z 906.7 ([ST d18:1/24:0-OH-H]−). Primary ion Bi3 2+, 50 keV, 2.5 × 10¹¹ ions/cm2, area 500 × 500 μm2, 256 × 256 pixels, pixel size 2 × 2 μm2. The amplitude of the color scale corresponds to the maximum number of counts, mc, and could be read as [0, mc]. tc is the total number of counts recorded for the specified m/z (it is the sum of counts in all the pixels). Adapted with permission from ref. [12]
Related posts:
MALDI Mass Spectrometry Imaging of Lipids and Primary Metabolites on Rat Brain Sections
Imaging of Plant Materials Using Indirect Desorption Electrospray Ionization Mass Spectrometry
Laser Ablation Sample Transfer for Mass Spectrometry Imaging
Nanostructure Imaging Mass Spectrometry: The Role of Fluorocarbons in Metabolite Analysis and Yoctomole Level Sensitivity
DESI Imaging of Small Molecules in Biological Tissues
Nanoparticle-Assisted Laser Desorption/Ionization for Metabolite Imaging
Stay updated, free articles. Join our Telegram channel
Full access? Get Clinical Tree
