, Joon Woo Lee1 and Eugene Lee2
(1)
Department of Radiology, Seoul National University College of Medicine, Seoul National University Bundang Hospital, Seongnam, South Korea
(2)
Department of Radiology, Seoul National University Bundang Hospital, Seongnam, South Korea
4.1.1 Hemangioma
4.1.2 Metastasis
4.1.3 Multiple Myeloma
4.2.1 Schwannoma
4.2.2 Neurofibroma
4.3.1 Schwannoma
4.3.2 Meningioma
4.3.3 Myxopapillary Ependymoma
4.4.1 Ependymoma
4.4.2 Astrocytoma
4.4.3 Hemangioblastoma
4.5.1 Lymphoma
4.5.2 Leukemia
4.5.3 Hemangioma
4.6.1 Sacrococcygeal Teratoma
4.6.3 Ewing’s Sarcoma
4.1 Intraosseous Tumors
4.1.1 Hemangioma
- 1.
Epidemiology
Peak incidence: 30–50 years old, tendency to increase in size with age
Asymptomatic: M = F
Symptomatic: M < F
- 2.
Location
Thoracic spine (60%) > lumbar spine (29%) > cervical spine (6%) > sacrum (5%)
Vertebral body >> posterior elements
- 3.
Characteristic imaging findings
Well-defined round or lobular intraosseous masses
Thickened trabeculation on X-ray, CT, MR
High signal on T1-weighted and T2-weighted images
Avid enhancement
- 4.
Spectrum of imaging findings
Low signal on T1-weighted images in vascular (aggressive, symptomatic) hemangioma
Poor enhancement in sclerosing hemangioma
Both epidural and vertebral body involvement
- 5.
Differential diagnosis
Benign notochordal cell tumor
Sclerosis on CT
Low signal on T1-weighted images
No enhancement
Metastasis
Cortical destruction
Low signal on T1-weighted images
Focal fat
Irregular shape
No enhancement
4.1.1.1 Illustrations: Hemangioma
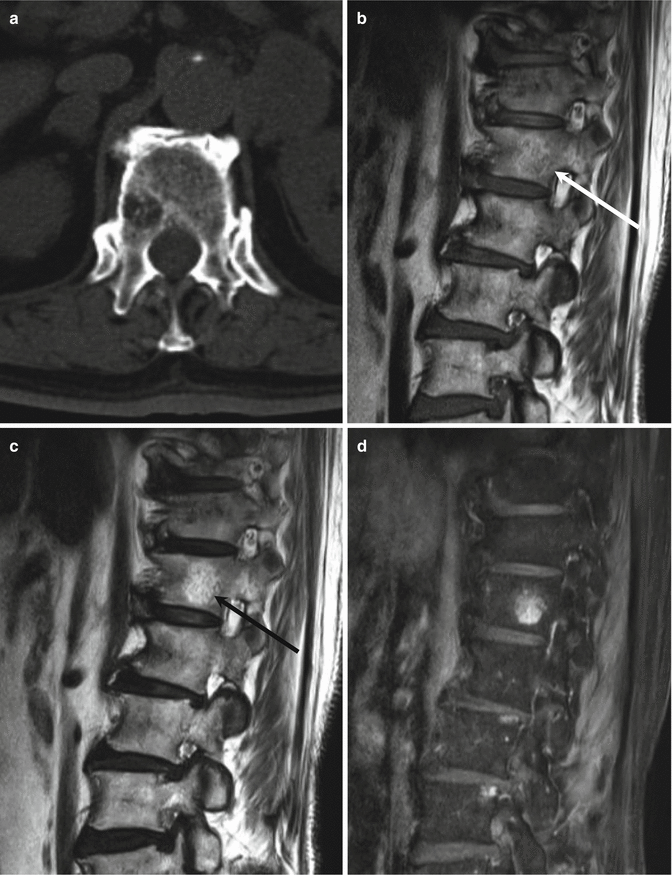
Fig. 4.1
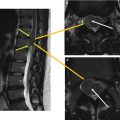
Hemangioma of the T12 vertebra in a 76-year-old woman. Axial CT scan of the lumbar spine (a) shows small osteolytic lesion in the right posterior corner of the vertebral body. T1-weighted sagittal MR image (b) shows subtle low signal intensity with a hyperintense rim (white arrow). T2-weighted sagittal MR image (c) shows high signal intensity with preserved internal trabeculation (black arrow). Contrast-enhanced T1-weighted sagittal MR image (d) shows enhancement

Fig. 4.2
Hemangioma of the L1 vertebra in a 78-year-old woman. Axial CT scan of the lumbar spine (a) shows an osteolytic lesion involving the entire vertebral body with internal dot-like trabeculation. T1-weighted sagittal (b) and T2-weighted sagittal (c) MR images show a heterogeneous low signal intensity lesion with preserved coarse trabeculations (white arrows). Contrast-enhanced T1-weighted sagittal MR image (d) shows avid enhancement
4.1.2 Metastasis
- 1.
Epidemiology
Middle age and elderly (can be seen in all ages)
Men: from prostate cancer, lung cancer
Women: from breast cancer, lung cancer
- 2.
Location
Thoracic spine (70%), lumbar spine (20%), cervical spine (10%)
Common in vertebral body
- 3.
Characteristic imaging findings
Osteolytic (70%), osteoblastic (9%), mixed (21%) pattern
Osteolytic masses
With cortical destruction and paravertebral extension
Malignant compression fracture: complete replacement of the bone marrow
Different signal characteristics and aggressiveness depending on primary tumors
Osteoblastic mass with peripheral enhancement
Common in breast cancer and prostate cancer
Irregular sclerotic mass on X-ray and CT with endplate depression
Hypointense signal on T1-weighted and T2-weighted MR images
Peripheral enhancement
Mixed pattern
Osteolytic and osteoblastic masses in the spine
- 4.
Spectrum of imaging findings
Malignant compression fracture.
Complete replacement of the bone marrow signal in the vertebral body
Convex posterior margin of vertebral body
Hypointense signal on T1-weighted images
Strong enhancement or internal irregular non-enhancing areas
Epidural mass with biconcavity due to midline septum
Single lesion can be possible.
Sclerotic rim around the tumors can be seen.
Slow-growing metastases in thyroid cancer.
Direct invasion from retroperitoneal or mediastinal metastasis.
- 5.
Differential diagnosis
Aggressive hemangioma
Thickened trabeculation
Red marrow hyperplasia/red marrow reconversion
Isointense or hyperintense signal than intervertebral disc on T1-weighted images
Patchy enhancement
Schmorl’s node (intravertebral disc herniation)
Cortical depression on T1-weighted image or CT
Same signal as intervertebral disc
Multiple myeloma
Diffuse or variegated involvement
Benign osteoporotic pattern of compression fracture
Lymphoma
Multi-compartment without definable cortical breakage
Homogeneous signal character
Younger age
Tuberculosis
Subligamentous extension
Intraosseous rim-like enhancement
Polyostotic fibrous dysplasia
Ground glass opacity
Bony overgrowth or remodeling
Lymphangiomatosis
Cystic nature
No interval change
4.1.2.1 Illustrations: Metastasis


Fig. 4.3
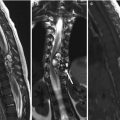
Metastasis of C7 in a 76-year-old woman with underlying pancreatic adenocarcinoma. Sagittal CT scan of cervical spine (a) shows an ill-defined osteolytic lesion involving the entire vertebral body. T2-weighted sagittal (b) and axial (c) MR images show a heterogeneous high signal intensity lesion with paravertebral and epidural extension (black arrows). T1-weighted sagittal MR image (d) shows low signal intensity involving the whole vertebral body, of relatively lower signal intensity than that of the intervertebral disc. Contrast-enhanced T1-weighted sagittal MR image (e) shows faint enhancement with avid paravertebral and epidural soft tissue enhancement

Fig. 4.4
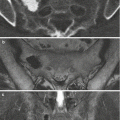
Metastases of the L2, L3, and L4 vertebrae in a 35-year-old woman with breast cancer. Coronal CT scan of the lumbar spine (a) shows an osteoblastic L2 vertebral body lesion. T1-weighted sagittal MR image (b) shows heterogeneous low signal intensity foci involving the L2, L3, and L4 vertebral bodies (white arrows). T2-weighted sagittal MR image (c) shows heterogeneous low signal intensity areas. Contrast-enhanced T1-weighted sagittal MR image (d) shows heterogeneous enhancement

Fig. 4.5
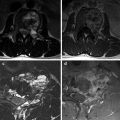
Metastasis of the T8 vertebra in a 48-year-old woman with renal cell carcinoma. Coronal CT scan of the thoracic spine (a) shows an osteolytic lesion in the left side of the T8 vertebral body with decreased vertebral height (white arrows). T1-weighted sagittal MR image (b) shows diffuse low signal intensity involving the entire T8 vertebral body in keeping with a pathologic compression fracture, of relatively lower signal intensity than the intervertebral disc. Contrast-enhanced T1-weighted sagittal (c) and axial (d) MR images show diffuse homogeneous enhancement with paravertebral and epidural extension
4.1.3 Multiple Myeloma
- 1.
Epidemiology
50–60 years old
M > F
- 2.
Location
Diffuse involvement
Compression fracture: 87% in T6 ~ L4
- 3.
Characteristic imaging findings
Variegated pattern
Salt-and-pepper appearance
Tiny, innumerous T1-hypointense nodules in the whole spine: strong enhancement even within tiny nodules
Diffuse pattern
Diffuse T1-hypointensity of the bone marrow involving the whole spine
Lower signal than intervertebral disc on T1-weighted image
Multinodular pattern
Similar character as multiple metastases
Benign osteoporotic pattern of compression fractures
- 4.
Spectrum of imaging findings
Sclerotic mass in the vertebral body.
One of the features in POEMS syndrome (M-spike = multiple myeloma).
Normal bone marrow pattern is possible.
Single lesion: plasmacytoma.
- 5.
Differential diagnosis
Red marrow hyperplasia/red marrow reconversion
Isointense or hyperintense signal to intervertebral disc on T1-weighted images
Patchy enhancement
Lymphoma
Multi-compartment: bone, epidural, leptomeningeal
Homogeneous signal
Stronger enhancement
Metastases
Multiple nodular masses
Heterogeneous enhancement
Cortical destruction
Osteoporosis in elderly
Patchy areas of marrow inhomogeneity due to fatty deposition and red marrow hyperplasia
Low signal area of bone marrow
Irregular shape
Same or higher signal than intervertebral disc
4.1.3.1 Illustrations: Multiple Myeloma

Fig. 4.6
Spine involvement from multiple myeloma in a 43-year-old man. T1-weighted sagittal MR image (a) of the thoracic spine shows multiple small low signal intensity nodules. T2-weighted sagittal MR image (b) shows high signal intensity foci. Contrast-enhanced T1-weighted sagittal MR image (c) shows strong enhancement of these nodules

Fig. 4.7
Spine involvement from multiple myeloma in a 47-year-old man. T1-weighted sagittal (a) and T2-weighted (b) MR images of the lumbar spine show tiny, innumerous hypointense nodules throughout the whole spine. Contrast-enhanced T1-weighted sagittal MR image (c) shows strong enhancement of these tiny nodules
4.2 Extradural Non-osseous Tumors or Tumorlike Lesions
4.2.1 Schwannoma
- 1.
Epidemiology
30–60 years old
M = F
- 2.
Location
Thoracic > lumbar, cervical
- 3.
Characteristic imaging findings
Well-defined, lobular contoured, extradural mass
Foraminal widening, bony scalloping
High signal on T2-weighted image, homogeneous or peripheral irregular enhancement
- 4.
Spectrum of imaging findings
Intradural extension (dumbbell shape)
Cystic degeneration: peripheral irregular enhancement, central bright T2-hyperintensity
- 5.
Differential diagnosis
Neurofibroma
Fusiform shape
Target sign: peripheral high signal + central low signal on T2-weighted images
Herniated disc (sequestration)
Low signal on T2-weighted images
No enhancement/peripheral enhancement with central T2-hypointensity
Protrusion at the base of the adjacent intervertebral disc
Abscess
Thin peripheral enhancement
Bone marrow edema of the adjacent vertebral body
Angiolipoma
T1-hyperintensity
Epidural hemangioma
Cystic or solid mass with homogeneous enhancement
Lobular shape
Epidural hematoma
No enhancement, foci of T1-hyperintensity or T2-hypointensity
4.2.1.1 Illustrations: Schwannoma

Fig. 4.8
Extradural schwannoma in a 50-year-old man. T2-weighted axial MR image (a) shows a heterogeneous signal intensity extradural soft tissue mass involving the right T8/T9 neural foramen. Marked compression and left-sided deviation of the spinal cord is noted. Contrast-enhanced T1-weighted axial MR image (b) shows homogeneous enhancement

Fig. 4.9
Extradural schwannoma in a 53-year-old woman. T2-weighted axial MR image (a) shows a high signal intensity left anterolateral extradural mass extending through the C1/C2 left neural foramen. Compression and right-sided deviation of the spinal cord is noted. Contrast-enhanced T1-weighted axial MR image (b) shows heterogeneous enhancement

Fig. 4.10
Extradural schwannoma in a 65-year-old man. T2-weighted axial MR image (a) shows a high signal intensity right-sided extradural mass at L4/L5 level. Contrast-enhanced T1-weighted axial MR image (b) shows peripheral enhancement (white arrows)
4.2.2 Neurofibroma
- 1.
Epidemiology
30–60 years old
M = F
- 2.
Location
Thoracic > lumbar, cervical
- 3.
Characteristic imaging findings
Peripheral high signal (myxoid material) + central low signal (nerve tissue) on T2-weighted images
Fusiform shape in the neural foramen, swollen nerve rootlike shape
- 4.
Spectrum of imaging findings
Plexiform neurofibromas
Multiple neurofibromas in the brachial or lumbar plexus
Neurofibromatosis type I
Diffuse neurofibroma
Ill-defined diffuse infiltration in the muscle and subcutaneous fat layer
Neurofibromatosis type 1
- 5.
Differential diagnosis
Schwannoma
Similar imaging findings
Rare target sign
Malignant peripheral nerve sheath tumors (MPNST)
Large mass, more than 5 cm
4.2.2.1 Illustrations: Neurofibroma

Fig. 4.11
Extradural neurofibroma in a 33-year-old man. T2-weighted axial MR image (a) shows a dumbbell-shaped heterogeneous high signal intensity extradural mass extending through the left L1/L2 neural foramen. Contrast-enhanced T1-weighted axial MR image (b) shows peripheral enhancement

Fig. 4.12
Neurofibroma in a 35-year-old woman. T2-weighted coronal MR image (a) shows a high signal intensity lobulated paravertebral mass. Contrast-enhanced T1-weighted coronal (b) and axial (c) MR images show a peripheral enhancing mass extending through the right C6/C7 neural foramen (white arrow)

Fig. 4.13
Extradural neurofibroma in a 25-year-old woman. T2-weighted axial (a) and sagittal (b) MR images show a high signal intensity lobulated extradural mass extending through the enlarged right T4/T5 neural foramen. Spinal cord compression and left-sided deviation is noted. Contrast-enhanced T1-weighted axial MR image (c) shows a peripheral enhancing mass
4.2.3 Herniated Intervertebral Disc (HIVD) (Sequestration)
- 1.
Epidemiology
All age
M = F
- 2.
Location
Lumbar
- 3.
Characteristic imaging findings
Low signal on T2-weighted images
No enhancement/peripheral enhancement with central T2-hypointensity
Protrusion at the base of the adjacent intervertebral disc
- 4.
Spectrum of imaging findings
Rare intradural disc herniation
Thick peripheral enhancement
- 5.
Differential diagnosis
Schwannomas
Neurofibromas
Abscess
Hematoma
4.2.3.1 Illustrations: HIVD (Sequestration)

Fig. 4.14
Disc sequestration at T12/L1 level in a 65-year-old woman. T2-weighted axial MR image (a) shows a right epidural lesion with peripheral high signal intensity and inner low signal intensity area (white arrow). The lesion causes cord compression and displacement to the left side. Contrast-enhanced T1-weighted axial MR image (b) shows peripheral enhancement

Fig. 4.15
Disc sequestration at L2/L3 level in a 57-year-old woman. T2-weighted axial MR image (a) shows a high signal intensity lesion extending from the ventral and left lateral epidural space into the left neural foramen (white arrows). Contrast-enhanced T1-weighted axial MR image (b) shows peripheral enhancement

Fig. 4.16
Disc sequestration at L3/L4 level in a 61-year-old man. T2-weighted axial MR image (a) shows a high signal intensity lobulated left lateral and posterior epidural lesion (white arrows). The lesion causes left L4 nerve root compression and central canal compromise. Contrast-enhanced T1-weighted axial MR image (b) shows peripheral enhancement
4.3 Intradural Extramedullary (IDEM) Tumors
4.3.1 Schwannoma
- 1.
Epidemiology
30–60 years old
M = F
- 2.
Location
Thoracic = lumbar > cervical
Eccentric
- 3.
Characteristic imaging findings
Well-defined intradural lobular, round, or ovoid mass
Stay updated, free articles. Join our Telegram channel

Full access? Get Clinical Tree


