Fig. 8.1
Schema of resting-state networks. (a) medial visual-related network, (b) lateral visual-related network, (c) auditory-related network, (d) sensorimotor network, (e) default mode network, (f) executive control network, (g, h) left and right dorsal attention network
8.3.3 Measurement of rs-fMRI/rsfcMRI
The advantages of rs-fMRI/rsfcMRI include user friendliness and ease of implementation. Experimenters do not have to design complex tasks or to set up a stimulus presentation and response recording systems. Participants do not have to exhaust themselves by working on difficult or nonsensical (at least to them) tasks. It is relatively easy to add rs-fMRI/rsfcMRI to clinical routines of MRI examination as long as echo planar imaging (EPI) is available on the scanner.
To acquire EPIs for rs-fMRI/rsfcMRI, time to repetition (TR) is often set to about 2–3 s to cover the whole brain (Table 8.1). This temporal resolution is satisfactory for rs-fMRI/rsfcMRI because the chronological change of RSN BOLD signals primarily exists in a low-frequency domain ranging from ~0.08 to 0.1 Hz. To date, most rs-fMRI/rsfcMRI studies use a total acquisition time ranging from 5 to 10 min, corresponding to 150–300 EPI volumes. This is consistent with a previous report suggesting that the RSN can be reliably detected with assessment for several minutes [26]. In a large-scale cohort project on Alzheimer’s disease (AD) in the USA, the Alzheimer’s Disease Neuroimaging Initiative 2 (ADNI2), the rs-fMRI/rsfcMRI protocol uses a TR of 3 s, and a total acquisition time of 7 min (140 EPI volumes). For total acquisition time, however, Birn et al. [27] recently examined the test–retest reliability and similarity of RSNs across sessions. This study has shown that the reliability and similarity of functional connectivity can be improved by increasing the scan lengths from 5 min up to 13 min. However, this finding might have resulted from both increases in scanning time and in the number of volumes. To test this, they assessed the effects of the total number of volumes by comparing results from two data sets with the same total scanning time but with a different number of EPI volumes. In practice, they excluded half the time points by sampling every second image from the first data set and created the half-volume second data set. The results showed that the benefit of increased reliability was found for the increase in the number of volumes as well as the increase in the length of time [27]. According to this result, it seems better to acquire as large a number of volumes as possible with a shortened TR. Currently, our group uses a 10-min scanning protocol with a TR of 2.5 s.
Table 8.1
Summary of the acquisition parameters in previous rsfcMRI studies
Author | Year | Subject | Static magnetic field (T) | Acquired volumes | TR (ms) | TE (ms) | Resolution (mm) |
|---|---|---|---|---|---|---|---|
Jafri [7] | 2008 | Schizophrenia | 3.0 | 168 | 1860 | 27 | 3.75 × 3.75 × 4 |
Vincent(Data1) [8] | 2008 | Healthy | 3.0 | 110 | 3013 | 25 | 4 × 4 × 4 |
Vincent(Data2) [8] | 2008 | Healthy | 3.0 | 66 | 5000 | 30 | 2 × 2 × 2 |
Vincent(Data3) [8] | 2008 | Healthy | 3.0 | 76 | 5000 | 30 | 2 × 2 × 2 |
Uddin [9] | 2009 | Healthy | 3.0 | 197 | 2000 | 25 | 3 × 3 × 3 |
Grigg [10] | 2010 | Healthy | 3.0 | 170 | 2000 | 30 | 3.125 × 3.125 × 5 |
Sakoglu [11] | 2010 | Schizophrenia | 3.0 | 249 | 1500 | 27 | 3.75 × 3.75 × 4 |
Allen [12] | 2011 | Healthy | 3.0 | 152 | 2000 | 29 | 3.75 × 3.75 × 4.55 |
Arbabshirani [13] | 2012 | Healthy | 3.0 | 200 | 1500 | 27 | 3.75 × 3.75 × 4 |
Bastin [14] | 2012 | Healthy | 3.0 | 250 | 2130 | 40 | 3.4 × 3.4 × 4 |
Koch [15] | 2012 | MCI | 3.0 | 120 | 3000 | 30 | 3 × 3 × 4 |
Li [16] | 2013 | AD | 3.0 | 250 | 2000 | 30 | 4 × 4 × 6 |
Segall [17] | 2012 | Healthy | 3.0 | 152 | 2000 | 29 | 3.75 × 3.75 × 4.55 |
Wang [18] | 2012 | Healthy | 3.0 | 240 | 2000 | 31 | 3.125 × 3.125 × 3.2 |
Zuo [19] | 2012 | healthy | 3.0 | 240 | 2000 | 27 | 3.44 × 3.44 × 4 |
Damoiseux [20] | 2006 | Healthy | 1.5 | 200 | 2850 | 60 | 3.3 × 3.3 × 3.3 |
Wang [21] | 2006 | AD | 1.5 | 170 | 2000 | 60 | 3.75 × 3.75 × 7 |
Sorg [22] | 2007 | MCI, AD | 1.5 | 80 | 3000 | 50 | 3.125 × 3.125 × 4.4 |
Kelly [23] | 2010 | Healthy | 1.5 | 180 | 2000 | 35 | 3.5 × 3.5 × 5 |
Adriaanse [24] | 2012 | AD | 1.5 | 200 | 2850 | 60 | 3.3 × 3.3 × 3.3 |
Zarei [25] | 2012 | AD | 1.5 | 200 | 2850 | 60 | 3 × 3 × 3 |
It is important to note that there are many possible states of “resting.” In rs-fMRI/rsfcMRI studies, a participant is usually instructed to stay relaxed in a comfortable position within a scanner, and not to think about anything particular or to imagine specific figures or scenes. However, a substantial variability exists across studies as to whether a participant is asked to close their eyes, open their eyes, or fixate on a visual target. However, there is a problem: the functional connectivity pattern may differ between the eyes-open condition and the eyes-closed condition [28]. To date, there is no rule of thumb to judge which condition is ideal for a particular rs-fMRI/rsfcMRI study. Yet one thing is certain: a single condition with either the eyes closed or the eyes open (with or without a fixation target) should be used consistently throughout a single study. In addition, some studies have suggested that RSNs, especially the visual network, may show variation related to the stage of sleep [29]. Currently, our group uses a visual fixation condition with the eyes open to prevent them from falling asleep completely and also to reduce head movement during scanning. This is because we believe that these factors should be controlled as much as possible to reduce possible confounding factors between individuals.
Moreover, a newly developed multimodal imaging technique has been applied for the simultaneous measurement of rs-fMRI/rsfcMRI with near-infrared spectroscopy or with the electroencephalogram [30].
8.3.4 Analysis of rs-fMRI/rsfcMRI
Many analytic methods have been proposed for rs-fMRI/rsfcMRI as they showcase the recent development of neuroimaging. rs-fMRI/rsfcMRI can be analyzed with software packages that have been used for the analysis of task-related fMRI such as statistical parametric mapping (http://www.fil.ion.ucl.ac.uk/spm/doc/), FSL (http://fsl.fmrib.ox.ac.uk/fsl/fslwiki/), and AFNI (http://afni.nimh.nih.gov/afni/), especially with implementation of extension programs such as the Data Processing Assistant for Resting-State fMRI (DPARSF; http://rfmri.org/DPARSF), the conn toolbox (http://web.mit.edu/swg/software.htm [31]), and the Group ICA of fMRI Toolbox (GIFT; http://mialab.mrn.org/software/).
An analysis method focusing on resting-state fluctuations of regional activity is called amplitude of low-frequency fluctuations (ALFF) or fractional ALFF (fALFF). ALFF is defined as the total power within the frequency range between 0.01 and 0.1 Hz in a given voxel; thus, ALFF retrieves local information about the amplitude of low-frequency fluctuations [32]. However, these low-frequency components often contain physiological noise resulting from respiration and pulsation. To overcome this limitation, Zuo and colleagues have proposed fALFF, which is calculated as the power of fluctuations within the low-frequency range (0.01–0.1 Hz) divided by the total power of fluctuations in the entire frequency range. Similar to ALFF, fALFF can index spontaneous brain activity within regions [33, 34]. For example, ALFF and fALFF can test whether two groups may differ in resting-state low-frequency fluctuations in each voxel or region of interest (ROI).
A majority of rs-fMRI/rsfcMRI studies deal with functional connectivity. RsfcMRI analyses explore the correlation of a low-frequency fluctuation of BOLD signals between regions. One of the simplest approaches is to test the correlation of low-frequency fluctuations of BOLD signals between a pair of ROIs. Another typical approach is a seed-to-voxel functional connectivity analysis, or seed-to-voxel analysis for short, adopted by Biswal and colleagues in their original paper [3]. By definition, a seed-to-voxel analysis uses an a priori ROI as the seed region and then tests the correlation of low-frequency fluctuations between the seed region and all other voxels in the brain. Seed-to-voxel analysis can explore all the voxels in the whole brain that have a significant correlational relationship with the seed region, yielding a functional connectivity map (Fig. 8.2). Because seed-to-voxel analysis is statistically straightforward and provides comprehensible results, it has become a popular technique. Despite the possibility of clear-cut results being provided, the technique has the major drawback of requiring a priori selection of a seed region. In other words, among the major techniques available for rs-fMRI/rsfcMRI analysis, seed-based analysis is the most explicitly model-based or hypothesis-driven approach derived from traditional fMRI analysis. At the other extreme, independent component analysis (ICA) is a method for multivariate “exploratory” search in which a set of regions or networks having coherent BOLD signal fluctuations can be detected without an a priori model. ICA is a typical model-free analysis in contrast to the model-based functional connectivity analysis requiring an a priori ROI. ICA is originally a method developed for the estimation of a signal source or blind source separation; it is used to decompose an observed signal into a set of independent signal components, by hypothesizing that the observed signal is a linear sum of distinct components from different sources. In ICA of fMRI data, observed, spatially distributed time series BOLD signals are hypothesized as a linear mixture of spatially independent maps, each of which has certain temporal dynamics (signal time course). Thus, ICA of rsfcMRI data identifies RSNs as spatially independent components and creates maps of RSNs accompanied with information about the temporal signal variations of each RSN (Fig. 8.3). An advantage of ICA is that it does not require a priori assumptions about the seed regions or functional connectivity networks. Further, ICA can separate signals that do not reflect neural activity: various types of noise resulting from body movement and physiological noise from respiration and pulsation typically seen in the white matter and cerebrospinal fluid space. Thus, ICA can be used as a filter to remove these noise components. Despite these merits, a substantial challenge in ICA analysis resides in how to interpret the decomposed ICA components, because ICA-derived spatial maps do not have inherent physiological meanings. Traditionally, the interpretation rested completely upon researchers’ eyes classifying the components into valuable and garbage. In this regard, frequency power analysis of the time course of ICA components often helps, because physiologically meaningful RSNs should have a frequency component between 0.08 and 0.1 Hz. For example, the component including most of the frequency-spectrum power above 0.1 Hz shows a “spotty” noise pattern with small clusters of voxels diffusely spread over the brain or ventricle [23]. Also, head motion-related ICA maps typically show a spike-like rapid change of time course. Therefore, motion-related ICA components are predominantly in a high-frequency range of the spectrum. More recently, a template matching method has been employed to match an ICA component from individuals to a single set of component maps representing typical RSNs [35].
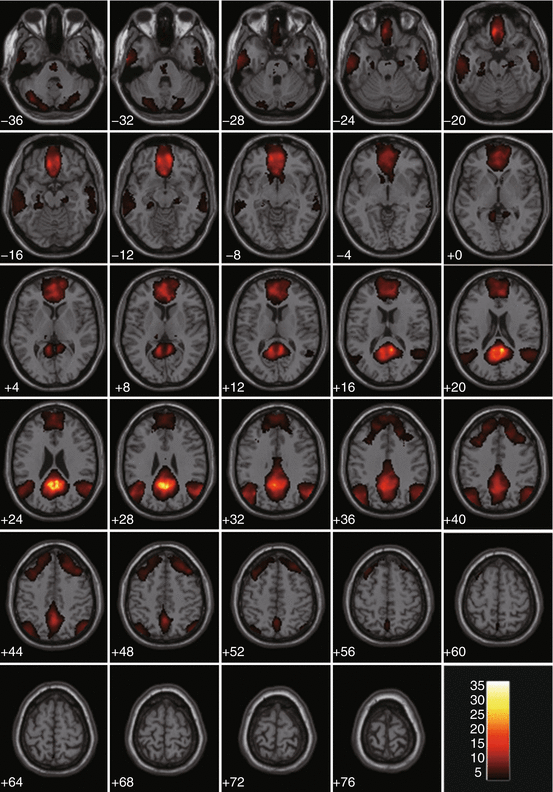

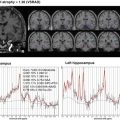
Fig. 8.2
Example of a seed-based analysis with seed ROI at the posterior cingulate cortex/precuneus in the healthy participants group. A significant correlation is observed in the medial part of the frontal lobe, lateral parietal lobe and the lateral inferior temporal gyrus as the default-mode network. The color bar indicates the correlation coefficient
Fig. 8.3
Example of a default mode network identified by an independent component analysis. Because the peak of the power spectrum is observed from 0.02 to 0.03 Hz, we can interpret that this BOLD signal time course has low-frequency oscillation
Multivariate pattern analysis (MVPA) has significantly progressed the analysis of neuroimaging data in various ways. MVPA first selects a set of brain activity from multiple voxels or a correlation matrix derived from multiple pairs of ROIs, assuming that the selected multivariate data set (“a feature”) best characterizes a class or a label of interest. In the case of rsfcMRI, a feature from each individual is typically a correlation matrix derived from several ROIs or from an extensive ROI set covering the entire brain (e.g., automated anatomical labeling); a class may be defined at a level of stimulus (e.g., an orientation of a line), task condition (e.g., movement A or B), or population (diseased or healthy). A pattern discriminant algorithm is then applied to the correlation matrices to find a hyperplane or criteria that can best discriminate categories within the class. A discriminant algorithm, or a classifier, is often implemented by a form of supervised machine learning such as a support vector machine. After the classifier learns the criteria that best separates a multivariate pattern according to the input data, the capabilities of the classifier might be tested by applying it to a new functional connectivity data set. MVPA is expected to contribute to assisting in clinical diagnosis, provided that it can obtain high classification accuracy. Currently, rsfcMRI-based MVPA classification typically achieves accuracy of about 60–80% (50% chance level) [7, 36, 37]; further improvement would be required for really helpful clinical utility.
Related posts:
 Diagnostic Criteria for Alzheimer’s Disease
 Handling of MRI Data in a Multicenter Study
 Standardization and Quality Control of Brain PET Data in a Multicenter Study
 Neuroimaging Study of Alzheimer’s Disease in Volunteer-Based Cohort
 Proton Magnetic Resonance Spectroscopy for Dementia
 Brain Perfusion SPECT in Alzheimer’s Disease
Stay updated, free articles. Join our Telegram channel

Full access? Get Clinical Tree


