, Foster D. Lasley2, Indra J. Das2, Marc S. Mendonca2 and Joseph R. Dynlacht2
(1)
Department of Radiation Oncology, CHRISTUS St. Patrick Regional Cancer Center, Lake Charles, LA, USA
(2)
Department of Radiation Oncology, Indiana University School of Medicine, Indianapolis, IN, USA
Tumor Vasculature
One of the most important limiting factors in a tumor’s growth is its blood supply.
Many tumors grow in cords surrounded by normal stroma. This allows them to take advantage of normal blood vessels.
Many tumors secrete growth factors that promote the in-growth of new blood vessels.
This process is known as angiogenesis.
VEGF is the most famous angiogenic growth factor and is the target of bevacizumab (Avastin).
Tumor vasculature is “leaky”, poorly organized and less effective than normal blood vessels.
The normalization hypothesis states that anti-angiogenic therapy can actually improve tumor perfusion by removing abnormal, leaky vessels.
Therefore anti-angiogenic therapy may actually increase oxygenation and drug delivery to tumors.
Many tumors have necrotic regions where oxygen pressures are so low that tumor cells die of anoxia.
Hypoxia greatly decreases the efficacy of low-LET radiation, as discussed in Chapt. 22.
The Thomlinson-Gray Hypothesis
In 1955, Thomlinson and Gray found that human lung cancers grew in tumor cords surrounded by vascularized normal stroma.
All tumors larger than ~200 μm had a necrotic core.
Only the outermost 100 μm of any cord contained viable cells, the inner portion was necrotic (Fig. 23.1).
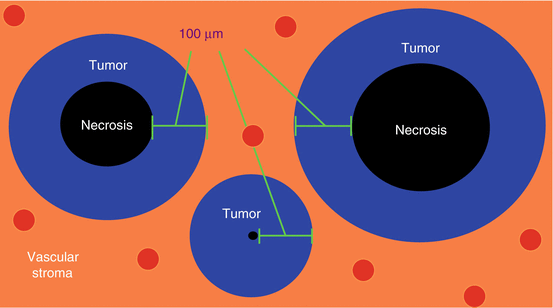
Fig. 23.1
The Thomlinson-Gray hypothesis. Tumors grow in cords surrounded by normal stroma. Regardless of the size of the cord, only the outermost ~100 μm contain viable cells. This is due to the diffusion distance of oxygen.
The Thomlinson-Gray hypothesis states that the thickness of viable tumor is limited by the diffusion of oxygen.
The diffusion distance of oxygen is ~70 μm, after which oxygen tension drops off dramatically.
Between 70 and 100 μm, cells are chronically hypoxic.
After 100 μm cells begin to die from anoxia. This causes a necrotic core.
Between the 1950s and now, various oxygen-measuring experiments have confirmed the Thomlinson-Gray hypothesis.
Mixed Normoxic/Hypoxic Survival Curves
Like a human tumor, a tumor in an experimental animal will contain both normoxic and hypoxic tumor cells.
Irradiating the animal tumor and then plating out cells to measure survival will result in a curve that looks like this (Fig. 23.2).
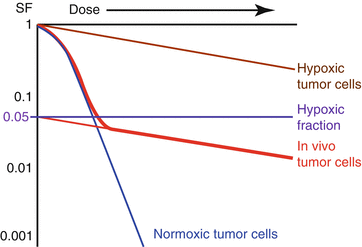
Fig. 23.2
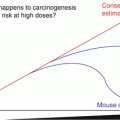
In vivo survival curve: Tumors in an experimental animal were irradiated and then plated out to count cell survival (red). The resulting survival curve can be thought of as the sum of two curves, one for normoxic tumor cells (blue) and one for hypoxic tumor cells (brown).
This “two phase” survival curve can be broken down into two different curves:
In the low dose region, normoxic cells outnumber hypoxic cells and so it looks like a normoxic survival curve.
In the high dose region, normoxic cells are all killed so it looks like a hypoxic survival curve.
The hypoxic fraction can be estimated by extrapolating the hypoxic portion of the curve back to zero dose.
If the curve crosses the Y-axis at SF = 0.05, then approximately 5 % of the tumor cells are hypoxic.

Stay updated, free articles. Join our Telegram channel

Full access? Get Clinical Tree


