5 Tumors of the Spine and Spinal Canal
Contents
Metastases to the Vertebrae and the Epidural Space
Epidural, Non-metastatic Space-Occupying Lesions
Intradural Extramedullary Tumors
Extradural, Intradural, Extramedullary, and Intramedullary Tumor manifestations
Primary Malignant Lymphoma, Secondary Lymphomatous Manifestation, Leukemic Infiltrate
Bone Tumors
A large number of histologically different, benign and malignant bone tumors are found in the skeletal system. These tumors differ in their radiological appearance as well as in age and site of predilection. Patients usually present with only unspecific symptoms, which are often misinterpreted as “rheumatic” or “degenerative.” There are only a few exceptions to this rule, such as cases of osteoid osteoma with its typical nocturnal pain, which responds well to acetylsalicylic acid.
Compared with other sites, the spine and sacrum are only rarely affected by primary bone tumors. Thus, only a total of 7 % of benign and 15 % of malignant bone tumors are found at these locations.
Bone Tumors with Preferential Location in the Spine
Benign tumors:
 osteoblastoma,
 hemangioma,
 aneurysmal bone cyst.
Malignant tumors:
 solitary plasmacytoma,
 chordoma.
Other tumor entities are also observed in the spine, but these have a predominantly extra-axial location (Resnick et al., 1988).
Generally speaking, bone tumors also display changes in signal intensity on MRI similar to those of other lesions, e.g. inflammatory reactions. They therefore usually exhibit low signal intensity on T1-weighted images, while T2-weighted images will show marked signal enhancement. Due to the normally high proportion of fatty marrow in the spine, T1-weighted sequences, T2-weighted fat sat sequences or T2-weighted GRE sequences, for example, should be selected for intra-osseous delineation. T2-weighted sequences or contrast-enhanced T1-weighted sequences, on the other hand, exhibit a high extraosseous contrast (Aisen et al., 1986; Bohndorf et al., 1986; Weigert et al., 1987; Hesnick and Niwayama, 1988).
Inflammatory changes also display a similar signal pattern at MRI. In contrast to these, however, bone tumors are usually confined to a single vertebral body. The intervertebral disks are normally not involved unless there is extensive destruction of the vertebral body. In the presence of inflammation, on the other hand, more often than not an involvement of two adjacent vertebrae is usually seen, together with their common intervertebral disk (Dihlmann, 1987; Reiser et al., 1990).
 Osteoblastoma
Incidence
The age of predilection for benign osteoblastomas is the second or third decade of life during which period about 70 % of all cases occur. Males are more often affected than females by a ratio of 2:1.
Clinical Presentation
Pain is a typical symptom associated with osteoblastomas, although it is generally only of a mild degree. Afflictions of the spine can be associated with scoliosis, muscular tension and neurological manifestations, including paresthesias and weakness.
Location
The thoracic and lumbar segments are the areas of the spine primarily affected, although involvement of the vertebral body itself is less typical. Pedicle and lamina are often involved and the spinous and transverse processes slightly less often. Intracortical osteoblastomas are surrounded by a marked sclerotic zone, not unlike osteoid osteomas but with the nidus of osteoblastomas being larger. Intratrabecular osteoblastomas show no surrounding zone of osteosclerosis because the periosteum does not become stimulated to produce a local sclerotic reaction. Unlike osteoblastomas of the long tubular bones, vertebral osteoblastomas have a tendency for epidural expansion and invasion of paravertebral tissue with infiltration of the adjacent vertebral bodies.
Histology
The nidus of the osteoblastoma contains a well-vascularized fibrous stroma that produces osteoid and primitive bone. Histologically there is no clear distinction from an osteoid osteoma, but the osteoblastoma is defined as such once the nidus has reached a certain size. Complete surgical removal of the tumor generally results in healing.
Diagnostics
Conventional Radiograph
On conventional radiographs osteoblastomas appear as sharply circumscribed, expansive, osteolytic lesions with partial or extensive calcification or ossification, occurring, in particular, in the posterior bony elements of the thoracic or lumbar spine. Sometimes a nidus similar to an osteoid osteoma is recognizable; sometimes it appears as a large osteolysis similar to an aneurysmal bone cyst. Scoliosis is often found, although less frequently than with osteoid osteomas (Aisen et al., 1986; Resnick et al., 1988; Krahe et al., 1989).
MRI (Fig. 5.1)
The T1-weighted MR image shows a hypointense or isointense lesion relative to muscle. Depending on the degree of bony sclerosis or calcification, there is a signal-free, or almost signal-free, marginal zone around the central tumor. After contrast application, a marked increase in signal intensity of the central tumor component is seen. Whereas good delineation from bone marrow, though poor differentiation in the presence of paravertebral expansion, can be obtained on the plain T1-weighted image, the application of contrast will allow a useful separation from the surrounding soft tissue while the contrast decreases relative to bone marrow. The tumor displays high signal intensity on the T2-weighted image and on T2-weighted fat sat (fat saturated) sequences. Considerable variations may be encountered, however, depending on the degree of sclerosis of the lesion.
 Hemangioma
Incidence and Location
It may be assumed that after appropriate histopathological processing about 10 % of all spines will reveal hemangiomas. They are located mainly in the region of the thoracic spine where they are to be found in the vertebral bodies. They are less frequently encountered extending into, or primarily located in, the posterior bony elements of the vertebrae.
Clinical Presentation
Hemangiomas are often discovered as incidental findings during examinations performed for other reasons. Only rarely do they elicit clinical symptoms, such as soft-tissue swelling or pain, which are then sometimes secondary to pathological fractures. In rare cases symptoms arise as a result of compression of the myelon due to expansion into the epidural space, as a result of epidural hemorrhage or compression fractures.
Histology
Hemangiomas of the spine usually reach a maximum of about 1 cm in diameter. Cavernous and capillary hemangiomas are the most frequently found.
Cavernous hemangiomas have large, thin-walled vessels, which are delimited by narrow rows of endothelial cells and filled with blood. Capillary hemangiomas are characterized by similar, but smaller, vessels and narrower lumina. Whereas cavernous hemangiomas are predominantly situated in the skull and the rest of the skeletal system, capillary hemangiomas are found preferentially in the spine. The bony trabeculae in the vicinity of the lesion become absorbed while the remainder thicken in compensation. Reactive bony regenerations are also observed. Apart from the blood-filled vessels, histology reveals fatty components within the tumor.
Diagnostics
Conventional Radiograph
Hemangiomas of the spine demonstrate a characteristic pathognomonic appearance on conventional radiographs. A vertical trabecular striation of the vertebral bodies is found, together with a marked reduction in density between the individual trabeculae (Resnick et al., 1988; Krahe et al., 1989).
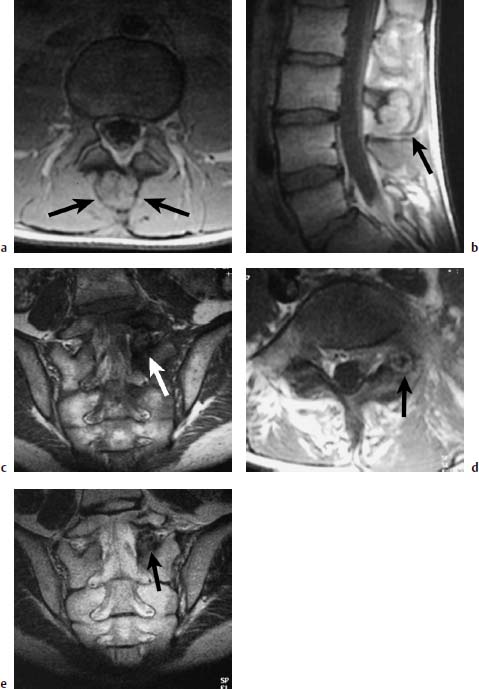
Fig. 5.1 a—e Osteoblastoma and osteoid osteoma (Images courtesy of Dr. Dörfler, University Clinic, Münster, Germany):
a T1-weighted transverse image with depiction of a bullous widening of the spinous process (arrows).
b T1-weighted sagittal section after contrast application: No appreciable enhancement of the tumor detectable (arrow).
c T1-weighted coronal section with depiction on the left of an osteoid osteoma of the articular process. The nidus displays intermediate signal intensity; the marginal sclerosis appears dark (arrow).
d T1-weighted transverse section: The nidus reveals a delicate bright margin (arrow).
e T2-weighted coronal section. No signal enhancement of the nidus. The marginal sclerosis also remains dark (arrow).
MRI
The lesion also has a characteristic appearance on MRI. Markedly high signal intensity is already observed on the plain T1-weighted image so that the lesion clearly “lights up” within the surrounding hemopoetic bone marrow. The high signal intensity of hemangiomas can be explained by the relatively high proportion of fat present in these lesions (Fig. 5.2).
Hemangiomas can exhibit a signal intensity that is exactly equal to that of bone marrow on fat saturated sequences (Fig. 5.3).
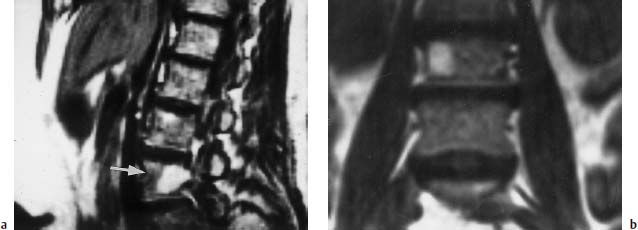
Fig. 5.2a, b Hemangioma of the L3 vertebral body:
a T1-weighted sagittal image (SE; TR = 600 ms, TE = 20 ms): Evidence of a hyperintense lesion in the L3 vertebral body (arrow) with extension into the right pedicle.
b T1-weighted coronal image (SE; TR = 550 ms, TE = 20 ms): Evidence also of the hyperintense, rightsided hemangioma.
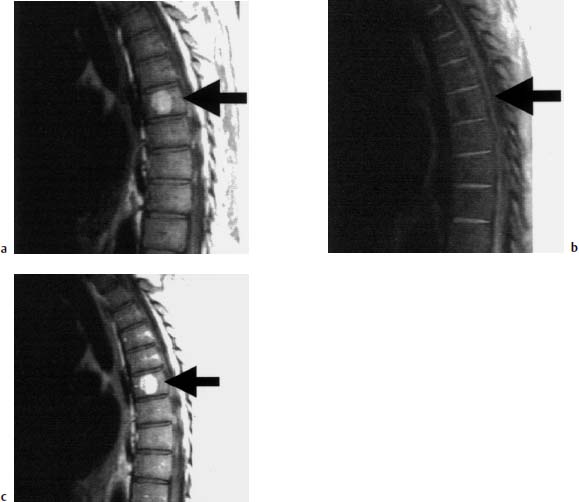
Fig. 5.3a—c Hemangioma of the T7 vertebral body:
a T1-weighted sagittal image: Hyperintense lesion in the T7 vertebral body (arrow), characteristic of a hemangioma.
b T1-weighted image with frequency-selective fat suppression: The hemangioma in the T7 vertebral body is no longer depicted due to suppression of the fat signal (arrow).
c T1-weighted image after contrast application: Slight contrast enhancement of the hemangioma (arrow).
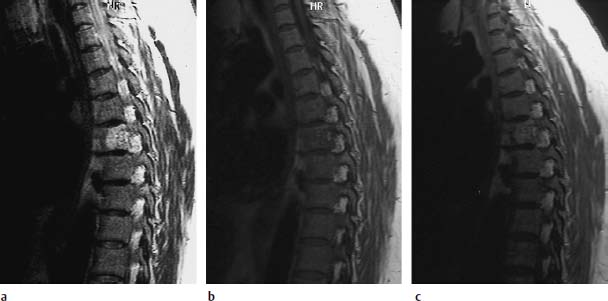
Fig. 5.4a—c Hemangioma of the T5 vertebral body:
a T2-weighted sagittal image (TSE; TR = 5300 ms, TE = 120 ms): High, slightly inhomogeneous, signal intensity of the vertebral body hemangioma.
b T1-weighted sagittal image (SE; TR = 800 ms, TE = 12 ms): Only slight signal intensity, therefore poor delineation against the other structures of the vertebral body. At most, individual small punctate signal enhancements are recognizable.
c T1-weighted image after contrast application: Slight signal enhancement in the region of the hemangioma.
Rare cases will demonstrate extension into the paraspinal tissue. The lesion also displays high signal intensity on T2-weighted sequences (Fig. 5.4).
Hemorrhages, e.g. into the epidural space, appear with varying degrees of signal intensity, depending on their age. The administration of contrast is not necessary with this form of tumor entity. The appearance of focal fatty deposits in the bone marrow is the most important differential-diagnostic criterion on MRI (Ross et al., 1987; Wiegert et al., 1987; Fruehwald et al., 1988).
 Aneurysmal Bone Cyst
Incidence
The aneurysmal bone cyst is primarily found during the first to third decades of life. About 80 % of aneurysmal bone cysts affect patients under 20 years of age.
Clinical Presentation
Various symptoms are presented, depending on location. Apart from local tenderness and swelling, involvement of the spine is associated with neurological deficits. Pathological fractures can cause severe acute pain.
Pathogenesis
Pathogenetically, trauma appears to play an important role in the development of some aneurysmal bone cysts. Local alterations of hemodynamics secondary to venous occlusions or arteriovenous fistulae are held responsible for the development of aneurysmal bone cysts. In addition, they are often found in association with other benign or malignant bone tumors. A large number of aneurysmal bone cysts, however, are considered to be idiopathic. Up to 30 % of cases occur in the spine (Kransdorf, 1995). Here, the aneurysmal bone cyst is primarily located in the posterior bony elements such as the vertebral arches, the transverse and spinous processes, less often in the vertebral bodies. The aneurysmal bone cyst is observed in decreasing order in the thoracic, lumbar, cervical spine and the sacrum.
Histology
The aneurysmal bone cyst is an expansive lesion with thin-walled, blood-filled cystic cavities. Histopathological processing of the material reveals either a large solitary cystic cavity or, more commonly, multiple cysts of sizes ranging between a few millimeters and a few centimeters. The cysts are separated from each other by thin fibrous septations. The cavernous blood-filled cysts do not comprise real vascular cavities, but are bordered by fibroblasts and multinuclear osteoclast-like giant cells. Typical components of vessel walls are not encountered in aneurysmal bone cysts. The fibrous septations can also contain osteoid and lamellar bone, multinuclear giant cells, histiocytes and hemosiderin deposits. The cysts themselves may be filled with fresh blood, while fibrinous clots are less commonly found. Even though the aneurysmal bone cyst is primarily a benign lesion with no tendency to metastasize, local expansive growth with penetration into the soft tissues is possible so that the aim of surgery must be complete removal to prevent recurrence.
Diagnostics
Conventional Radiograph
The aneurysmal bone cyst of the spine appears on conventional radiographs as an osteolytic and expansive lesion involving either the posterior elements of the bony spine or both the posterior elements and the vertebral body itself. A major finding will reveal involvement of adjacent vertebrae, expansion into the spinal canal, the ribs, or the paraspinal soft tissue.
CT
In some cases CT demonstrates a fluid-fluid level within the lesion, especially if the patient has remained motionless in the exposure position for more than 10 minutes (Resnick et al., 1988; Krahe et al., 1989).
MRI
Aneurysmal bone cysts have a characteristic appearance on MRI (Figs. 5.5 and 5.6).
An intralesional structure is found within the cyst that is not usually identified in bone lesions of other origins, such as osteolytic metastases. The lesion itself is characterized by an inhomogeneous signal intensity surrounded by a low-signal rim.
In some cases a fluid-fluid level is identifiable within the cyst that is also detectable on CT. Fluid-fluid levels within a lesion, however, are not proof of an aneurysmal bone cyst. They are also observed in solitary bone cysts, bone metastases, osteosarcomas, fibrosarcomas and cavernous hemangiomas. In these cases, the fluid-fluid levels represent blood in the cysts, hemorrhage in the tumor, or telangiectatic components of an osteosarcoma (Sone, 1992). The lesion will demonstrate varying degrees of signal intensity, depending on the age of the hemorrhage within the cyst. Relatively low signal intensity is therefore observed on T1-weighted images in cases of fresh hemorrhage. After only a few days this signal intensity changes to higher signal intensities on the T1-weighted image due to erythrocyte and hemoglobin degradation. Acute hemorrhages are displayed with relatively low signal intensity on T2-weighted images. Hemorrhages of various ages can appear within the individual cystic spaces so that inhomogeneous signal intensity is sometimes observed. After intravenous application of Gd-DTPA, marginal enhancement of signal intensity is revealed, while the central components demonstrate no signal increase at all (Beltran et al., 1986; Bohndorf et al., 1986; Weigert et al., 1987; Resnick and Niwayama, 1988).
Because aneurysmal bone cysts occur relatively frequently secondary to other primary bone tumors, an underlying primary disease should also be considered despite this typical form of appearance. Precursor lesions are found in about one-third of cases:
• common:
– giant cell tumor (most common),
– osteoblastoma,
– angioma,
• less common:
– fibrous dysplasia,
– non-ossifying fibroma,
– chondromyxoid fibroma,
– solitary bone cyst,
– fibrous histiocytoma,
– eosinophilic granuloma,
– osteosarcoma (Kransdorf, 1995).
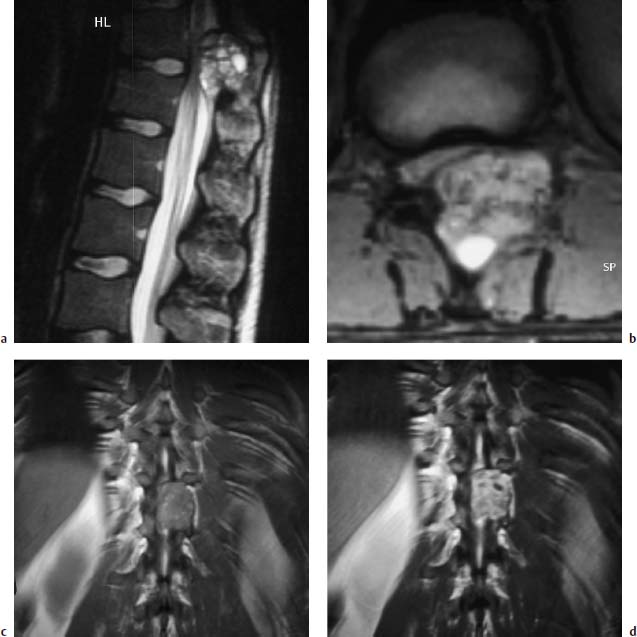
Fig. 5.5a—d Aneurysmal bone cyst in the region of the vertebral arch of T11 with high-grade stenosis of the spinal canal and the left neuroforamen:
a T2-weighted sagittal section (TSE; TR = 5000 ms, TE = 112 ms): Evidence of a bone tumor originating from the vertebral arch of T11 displaying marked septation. The fluid within the cyst exhibits high signal intensity.
b T2-weighted GRE sequence (TR = 282 ms, TE = 8 ms, flip angle α = 20°): Somewhat mottled inhomogeneous signal intensity of the bone tumor. Predominantly homogeneous signal. The destruction of the vertebral arch on the left side with involvement of the vertebral joint and the spinous process is clearly seen.
c T1-weighted plain coronal section (TSE; TR = 644 ms, TE = 12 ms): Somewhat mottled inhomogeneous signal intensity, in part with punctate signal enhancements.
d Identical section after contrast application: Relatively clear contrast enhancement of the bone cyst. A homogeneous signal pattern remains.
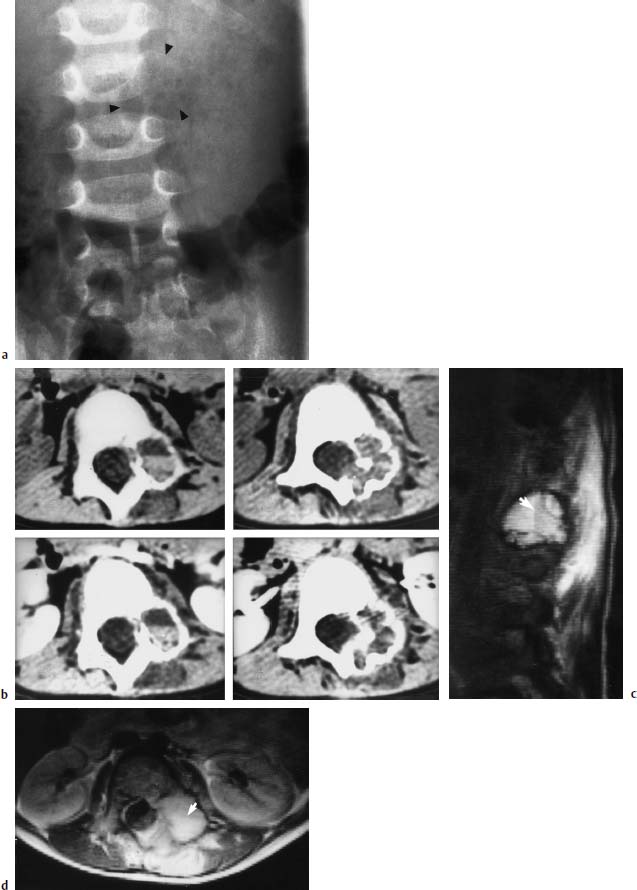
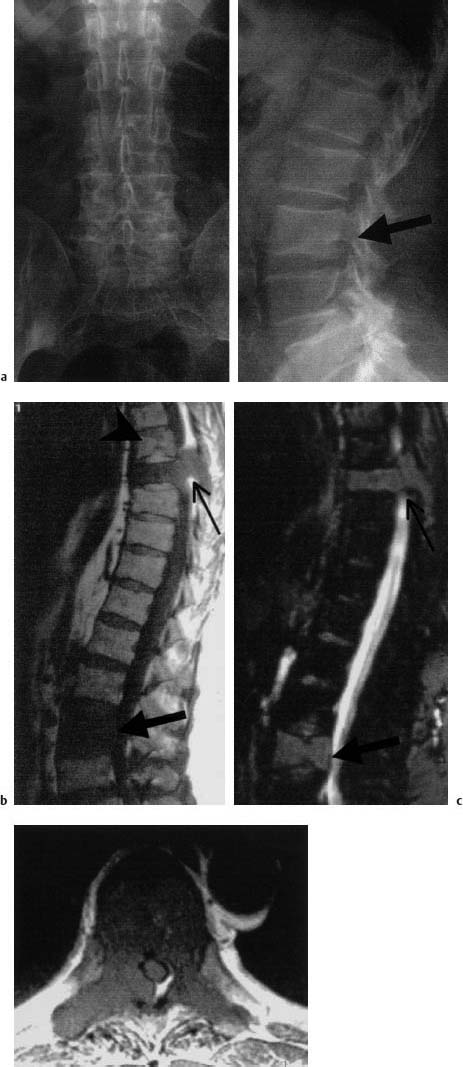
Fig. 5.6a—d Aneurysmal bone cyst on the left side at L2/L3:
a Radiograph of the lumbar spine: Depiction of an osteolytic enlargement of the transverse process of L2, a left-sided loss of contour of the L2 vertebral body and destruction of the pedicle. Arrows indicate the full extent of the cyst.
b CT of the bone cyst: The plain (upper) and contrast-enhanced (lower) images show the enlargement and destruction of the bone. There is also a fluid level as an indication of hemorrhage (left, upper and lower).
c T1-weighted sagittal image (SE; TR = 1600 ms, TE = 120 ms): Reduction in signal of the cellular blood components (arrow) relative to the remaining cystic fluid (from Jansen, J., B. Terwey, B. Rama, E. Markakis: MRI diagnosis of aneurysmal bone cyst. Neurosurg. Rev. 1990; 13(2): 161–6)
d Transverse MRI slice (SE; TR = 1600 ms, TE = 30 ms): Signal intense tumor with expansion far into the muscles of the back. The fluid level here (arrow) is also appreciable.
 Chordoma
Incidence
Chordomas are found in all age groups but with a predilection for older ages from about 50 years onwards. Men are more often affected than women by a ratio of 2:1.
Clinical Presentation
Initially only few and unspecific symptoms are usually presented. With increasing expansion of the tumor and depending on its location, however, various signs and symptoms are observed, including:
• gastrointestinal symptoms where there is involvement of the rectum,
• urological symptoms in cases of bladder involvement,
• neurological symptoms where the nerve roots or the myelon are affected.
Rectal palpation can identify sacral chordomas as fixed presacral space-occupying lesions.
Location
Chordomas are tumors arising from remnants of the embryonic notochord. These remnants can be found in the bones of the skull. In accordance with the tissue of origin, there is a particular predominance of chordomas in the cranial parts of the spine (approximately 30 %), at the clivus and at the occipitocervical junction. More than 50 % of chordomas are located in the caudal parts of the axial skeleton (sacrum, coccyx). Tumors of cranial origin predominate in the younger age groups. Spinal chordomas are usually located in the vertebral bodies, although a multifocal involvement is uncommon. Extraosseous involvement or the involvement of extra-axial bones is very rare. Chordomas relatively often exhibit a large extraosseous extension. The chordoma is the commonest aggressive retrorectal tumor.
Histology
The macroscopic appearance of chordomas is that of a lobular pattern of growth. The actual appearance depends on the degree of chondroid and mucinous material. Hemorrhage and cystic formations can also be present. The extraosseous component is usually contained within a pseudocapsule. Intracellular and extracellular mucin predominates histologically in chordomas. The solid tumor components consist mainly of cells of an epithelioid character, reminiscent of adenocarcinomas.
Growth
Chordomas can reach enormous sizes. Chordomas with a size of over 30 cm are sometimes found in the sacrococcygeal region. The typical size in this region reaches between 5 and 20 cm. Chordomas of other locations are somewhat smaller.
By the time the diagnosis is established, the chordoma has usually already undergone considerable expansion and is infiltrating the surrounding structures due to its aggressive form of growth. If complete resection of these tumors is not achieved then local recurrence is a regular feature. In about 30 % of cases hematogenous metastases are found (lung, liver, skeleton, soft tissue and other parenchymatous organs), especially with chordomas of the spine, less often with those of the skull.
Diagnostics
Conventional Radiograph
Chordomas manifest themselves radiologically as osteolysis with and without calcifications and cortical erosions. An irregular destruction of the bone is found in the sacrum, along with presacral fibrous elements. Loss of vertebral height is seen in the spine. Sometimes infiltration of the adjacent vertebral bodies by continuous growth is also found, accompanied by infiltration of the intervertebral space (Resnick et al., 1988; Krahe et al., 1989).
MRI
Like most other bone tumors, chordomas also appear on MRI as a hypointense formation on T1-weighted images. Calcifications, which occur in the paraosseous elements in up to 30 % of cases, cannot usually be directly depicted on MRI and are much more clearly seen on CT. Intravertebral expansion is clearly seen on T1-weighted sequences and even on fat-suppressed T2-weighted images. Exclusion or proof of infiltration of the rectum is also possible with T1-weighted images. The detection of a continuous layer of fat separating the rectum from the presacral space-occupying lesion militates in favor of infiltration of the rectum (Fig. 5.7).
The paraosseous component can otherwise be displayed with more contrast on T2-weighted images. The tumor clearly enhances relative to the surrounding soft tissue. After injection of contrast, chordomas also demonstrate a marked increase in signal intensity, although sometimes this may be only slight, (Fig. 5.8) (Sarrazin, 1996).
Intraspinal expansion of the chordoma is particularly well displayed on contrast-enhanced T1-weighted images because in this case the hyperintense tumor contrasts with the hypointense CSF (Rosenthal et al., 1985; Sze et al., 1988).
MRI is indicated for preoperative planning for surgery of chordomas. Sagittal or coronal sections allow an overview of the intraosseous expansion. MRI is also outstandingly suited for assessing soft-tissue infiltrations. It is not always possible, however, to decide whether organ infiltration is actually present with tumors that have already reached the bowels.
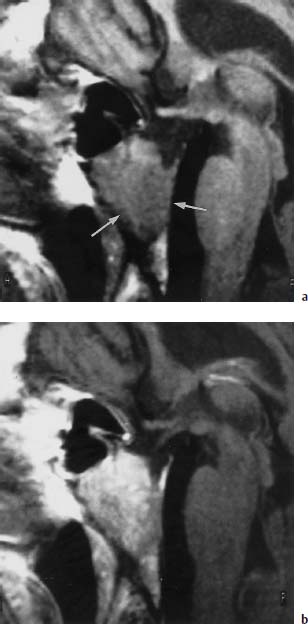
Fig.5.7a, b Chordoma
a T1-weighted sagittal image (SE; TR = 550 ms, TE = 15 ms): Hypointense space-occupying lesion of the clivus, which has almost completely replaced the normal bone marrow (arrows).
b T1-weighted sagittal image (SE; TR = 550 ms, TE = 15 ms) after intravenous administration of 0.1 mmol/kg body weight Gd-DTPA: Clear increase in signal intensity in comparison with the plain scan. Decreased contrast relative to fatty marrow, yet better delineation against CSF. The signal pattern does not allow a differential diagnosis to be made.
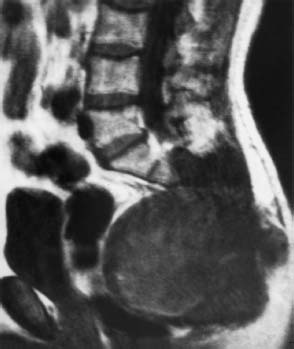
Fig. 5.8 Chordoma of the sacrococcygeal region. The large tumor has resulted in extensive destruction of the bone and has grown far forward into the presacral region. The rectum is displaced anteriorly by the tumor. A dividing layer of fat is still detectable (SE; TR = 500 ms, TE = 20 ms).
 Plasmacytoma
Incidence
According to the 1972 WHO classification of bone tumors, plasmacytomas rank among the primary bone tumors. If plasmacytomas are regarded as primary malignant bone tumors, then, with an incidence of about 50 %, they are by far the most common malignoma. Middle-aged and older patients, between 45 and 65 years, are usually affected. There is a slight sex predisposition in favor of males by a ratio of 3:2. Individual bones can be affected, although involvement of larger skeletal elements is more frequently encountered.
Clinical Presentation
The following clinical complaints are foremost in the presence of a plasmacytoma:
• exhaustion,
• weight loss,
• recurrent infections.
Laboratory examinations reveal:
• greatly elevated blood sedimentation rate (BSR),
• anemia,
• alterations in serum proteins.
The production of monoclonal immunoglobulins is found in the majority of cases. The occurrence of bone pain can be regarded as a clinical indication of bone involvement. Proliferations of plasma cells with a plasma fraction of over 10 % and various degrees of differentiation are found in the bone marrow. Osteolytic bone destruction and spontaneous fractures can also be the first sign of the disease.
Therapy
Treatment for plasmacytoma is oriented on laboratory and radiological findings. The Salmon and Durie staging system has established itself as one of the most popular classification schemes (Table 5.1).
This classic staging system does not take MRI findings into account, but confines itself more to staging on the basis of conventional survey radiographs. Asymptomatic patients in stage I do not usually require treatment.
It has emerged in some more recent studies that positive MRI findings, i.e. evidence of bone marrow infiltration, have a positive prognostic reliability in patients with stage I as regards the possibility of proceeding to more aggressive stages (Vande Berg, 1997; Weber, 1997). The monoclonal gammopathies should also be regarded in this light. These do not as yet represent a disease requiring treatment, but they do have the tendency in about 19 % of patients of developing into a hematological neoplastic disease within 10 years. Laboratory findings are remarkable with these gammopathies, although there are no clinical or radiological alterations. However, MRI does also reveal bone marrow changes in some of these patients, usually in the form of a focal or variegated pattern of involvement. If bone marrow infiltration is diagnosed on MRI in these patients, then the probability of a disease that requires treatment being present is significantly higher in comparison with a population with gammopathies yet without MRI findings. According to various studies, all patients requiring therapy had demonstrated MRI alterations one to several years beforehand (Vande Berg, 1997).
| Stage I | all of the following criteria fulfilled: |
| • Hb > 100g/l | |
| • serum calcium value normal | |
| • IgG value < 5g/dl | |
| • IgA value < 3g/dl | |
| • Bence-Jones proteinuria < 4g/24h | |
| • a maximum of one solitary skeletal osteolysis | |
| Stage II | one of the following criteria fulfilled: |
| • Hb < 85g/l | |
| • calcium > 12mg/dl | |
| • IgG value > 7g/dl | |
| • IgA value > 5g/dl | |
| • Bence-Jones proteinuria > 12g/24h | |
| • extensive lytic bone lesions | |
| A | normal renal function |
| B | disturbed renal function |
Skeletal Scintigraphy
Skeletal scintigraphy has a significantly low sensitivity for detecting plasmacytoma. This must be due to the fact that the prevalent feature of plasmacytoma is osteoclast activity with resorption of adjacent bone trabeculae. The radiograph of the spine correspondingly reveals coarse-meshed osteoporosis with and without circumscribed osteolysis. The osteolyses usually display clear margins. Despite MRI evidence of focal involvement of the vertebral bodies, less than one half of cases demonstrate a correlative finding on the survey radiograph (Baur, 1996).
These skeletal changes principally involve the vertebral bodies and, only later on in the course of the disease, the posterior vertebral elements, reflecting the general tendency for plasmacytomas to involve mainly those parts of the skeleton containing red bone marrow. In addition mottled, moth-eaten, destructive bone patterns are also observed. Multiple compressed vertebrae secondary to pathological fractures are not infrequently seen. A typical sight is the collapsed vertebra associated with a fish vertebra deformity, similar to that found in osteoporosis. Large paravertebral soft-tissue tumors are also no rarity (Freyschmidt, 1980; Resnick and Niwayama, 1988; Resnick et al., 1988).
MRI
MRI is the method best suited for detecting bone marrow infiltration. A differentiation is made between various forms of involvement:
Focal marrow involvement. Here, tumor nodules consisting entirely of myeloma cells are found in the bone marrow. On MRI they appear as focal, signal-reduced lesions with a signal intensity lower than, or similar to, that of muscle. An increase in homogeneous signal intensity is observed after contrast application. Individual cases have been reported of primary hyperintense lesions on T1-weighted images. This has been explained by the possible presence of hemorrhage (Moulopoulos, 1992). Both T1- and T2-weighted image sequences are required to display tumor involvement in its entirety because focal lesions are sometimes detectable only on T1- or T2-weighted sequences (Figs. 5.9 and 5.10) (Libshitz, 1992).
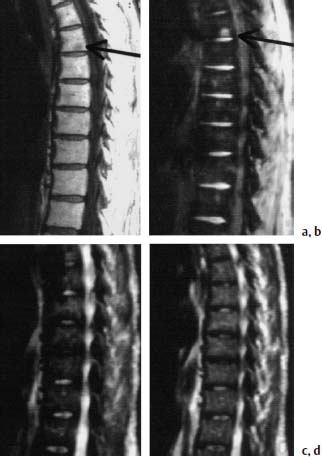
Fig. 5.9a—d Focal involvement of T6 by plasmacytoma:
a T1-weighted image: A circumscribed hypointense lesion that is highly suspect of a focal involvement by plasmacytoma (arrow) is displayed near the inferior end plate of T6.
b Opposed-phase image: The lesion, which was depicted hypointense on the T1-weighted image, now appears hyperintense (arrow). No evidence of any further lesions.
c,d STIR and T2-weighted images: The lesion demonstrated in a and b is no longer apparent.
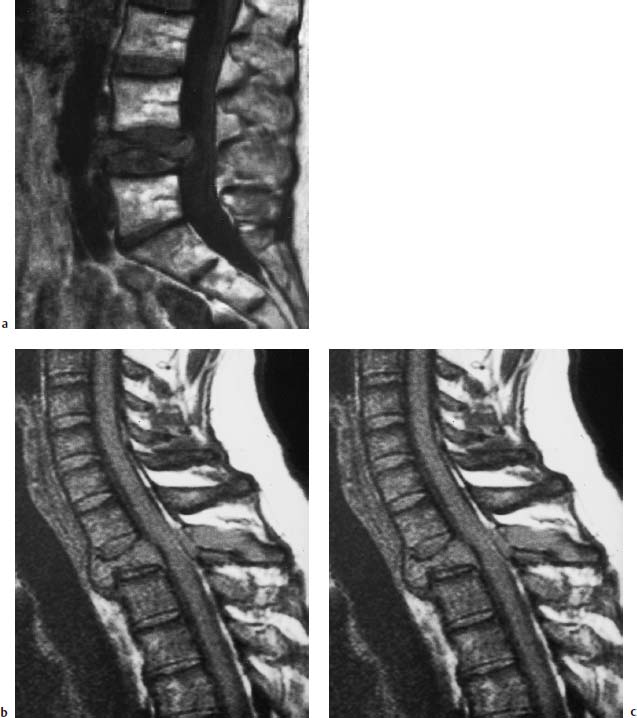
Fig. 5.10a—c Localized involvement of the spine by plasmacytoma:
a T1-weighted image (SE; TR = 550 ms, TE = 20 ms): Involvement of L4, which is clearly reduced in height. The tumor does not exceed the bony contours on this image.
b, c T1- and T2-weighted images of a plasmacytoma: Isointense signal of the tumor on the T1-weighted image (SE; TR = 650 ms, TE = 25 ms), clear signal enhancement on the T2-weighted image (FFE; TR = 600 ms, TE = 20 ms, flip angle α = 10°), and collapse of the vertebral body.
The most sensitive sequences are
• T1-weighting: SE, opposed-phase GRE,
• T2-weighting: STIR.
Variegated (salt and pepper) pattern of marrow involvement. The smallest of innumerable hypointense lesions are found dispersed in the normal marrow on T1-weighted images, displaying an increase in signal intensity after contrast application (Fig. 5.11).
Diffuse pattern of marrow involvement. The diffuse pattern of involvement is the complete replacement of normal bone marrow throughout the entire spine with an increase in signal intensity after contrast application (Moulopoulos, 1994). Unlike the focal pattern of involvement, this form of infiltration correlates highly significantly with the results of iliac crest biopsy (Fig. 5.12) (Baur,1996).
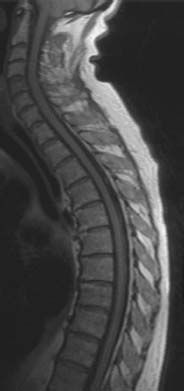
Fig. 5.11 Variegated form of infiltration by plasmacytoma. T1-weighted sagittal image (SE; TR = 800 ms, TE = 12 ms): The images display focal variegated reductions of signal in the bone marrow.
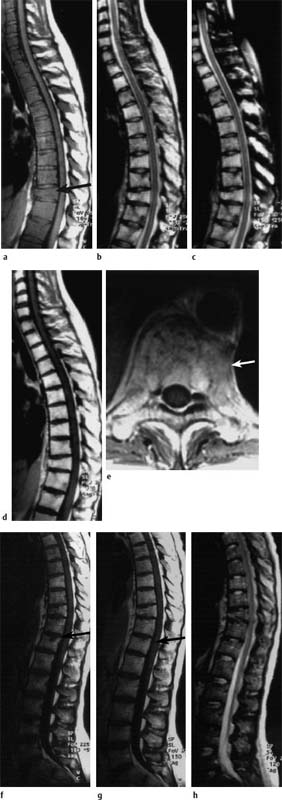
Fig.5.12a—h Diffuse involvement by plasmacytoma before (a—e) and after (f—h) therapy:
a T1-weighted image: Homogeneous signal reduction in all vertebrae. The intervertebral disks and the adjacent muscles display the same, or lower, signal intensity relative to the bone marrow of the vertebral bodies. Compression fracture of T10 (arrow).
b, c TSE T2-weighted image without (b) and with (c) frequency-selected fat suppression: The bone marrow of the vertebral bodies appears hyperintense due to homogeneous involvement by the plasmacytoma.
d, e T1-weighted image after intravenous application of contrast medium: Massive contrast uptake in all (affected) vertebral bodies. The vertebral bodies now appear clearly brighter than the intervertebral disks. In the transverse image through T10 a paravertebral soft-tissue component is displayed (arrow). Penetration into the spinal canal is not evident.
f, g T1-weighted images before (f) and after (g) intravenous application of contrast medium: Signal intensities have returned to normal with the exception of a small focal lesion with contrast enhancement near the superior end plate of T12 (arrow). The bone marrow appears slightly inhomogeneous.
h T2-weighted image: There is merely the slightest hint of the focal lesion in T12. Otherwise the signal intensities have returned to normal.
Mixed (focal and diffuse) pattern of marrow involvement. The mixed pattern of involvement comprises (Figs. 5.13 and 5.14) (Baur, 1996):
• diffuse infiltrations,
• focal involvement.
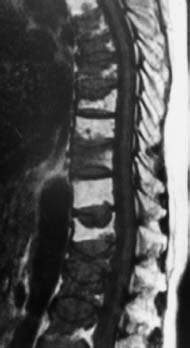
Fig. 5.13 Mixed pattern of involvement by plasmacytoma. On the T1-weighted image (SE; TR = 650 ms, TE = 25 ms) the non-involved vertebral bodies are depicted bright (fatty marrow), the involved vertebral bodies dark. The vertebral bodies with infiltration of the marrow in part display marked collapse. The plain radiograph was unable to distinguish between osteoporosis and plasmacytoma.

Fig. 5.14a—c Mixed pattern of involvement by plasmacytoma. 60-year-old female patient:
a T1-weighted image (SE; TR = 800 ms, TE = 12 ms): Very extensive involvement of the spine with partly diffuse, partly mottled, reduction in signal.
b T2-weighted image (TSE; TR = 4000 ms, TE = 120 ms): Slightly mottled signal intensity in the vertebral bodies, in part somewhat signal enhanced. On the whole, assessment of bone involvement is markedly poorer.
c Finding after therapy (TSE; TR = 800 ms, TE = 12 ms): Marked signal enhancement of the entire bone marrow as an indication of tumor regression. There is a corresponding increased amount of fatty marrow. The vertebral bodies now display a hyperintense signal relative to the disks. Numerous indentations of the vertebrae, primarily involving L1, L3 and L4.
Diffuse bone marrow infiltration, in which tumor cells and normal hematopoietic cells lie close together, is particularly difficult to diagnose using conventional radiography because only a depletion of bone calcium is seen, possibly combined with wispy trabecular thinning. These cases may also be difficult to diagnose on MRI because vertebrae with normal signal intensity may be not be available for comparison. Assessment of the signal intensity of the bone marrow should be made by comparison with that of surrounding structures, especially the intervertebral disk or muscle. In older patients the signal intensity of the bone marrow on T1-weighted images is slightly higher than that of the disk. If this difference is not present, then diffuse involvement of the bone marrow must be taken into consideration. In the case of diffuse bone marrow infiltration, a marked increase in signal intensity by over 40 % will be found after contrast application. In healthy individuals this contrast enhancement is age-related. With increasing age (plasmacytoma is a disease of older age), a significant decrease in contrast enhancement is found. A diffuse reduction in signal intensity is also observed, however, in benign stimulation of bone-marrow cells, e.g. by inflammation or anemia (Bauer, 1996, 1997). These criteria are equally valid for cases of diffuse metastatic invasion of the bone marrow (Dooms et al., 1985; Porter et al., 1986; Kaplan et al., 1987; McKinstry et al., 1987; Uhlenbrock et al., 1988; Josten et al., 1991).
Differential Diagnosis
An established radiological or MRI method for distinguishing an osteoporotic collapse fracture from a fracture secondary to plasmacytoma or other such tumor is not as yet available (Fig. 5.15). At the moment, diffusion-weighted images, which have permitted a good differentiation in initial studies, are under discussion. Further results remain to be seen (Baur 1998).
Purely morphological points of reference for benign and malignant fractures are listed in Table 5.2.
According to these criteria the majority of compression fractures appear as benign fractures, even in plasmacytoma patients, yet these patients will still demonstrate plasmacytoma cells in their vertebral bodies. A plasmacytoma, therefore, cannot be ruled out even in fractures that appear benign on MRI. The more pronounced the bone marrow infiltration detected on MRI (diffuse involvement or a large number of foci), the sooner should the occurrence of compression fractures be anticipated (Lecouvet, 1997).
| Benign: |
| • normal signal intensity on all sequences (chronic fracture) |
| • band of low signal intensity adjacent to the inferior or superior end plate (acute fracture) |
| • normal bone marrow signal intensity in the other vertebral bodies |
| • homogeneous signal intensity after contrast application |
| • bulging protrusion dorsally |
| Malignant: |
| • diffuse signal reduction on T1-weighted images (Fig. 5.15) |
| • high or inhomogeneous signal intensity on T2-weighted images |
| • round or irregular focal lesions of the bone marrow |
| • involvement of pedicles |
| • epidural soft-tissue mass (Fig. 5.16) |
| • high or inhomogeneous contrast enhancement |
| • convex posterior margin |
Therapy Monitoring
The monitoring of therapy has become an important indication for MRI. Histologically, edematous hypocellular tissue is found immediately after radio- and chemotherapy. The deposition of structural fat starts during the second week as a prerequisite for bone marrow regeneration. The replacement of red marrow commences in the periphery of the vertebral bodies. From 3–15weeks after therapy, increased amounts of fat are found in the bone marrow as compared with a healthy reference population. At this point the differential diagnosis between regenerating bone marrow and residual malignant cells is difficult on T1-weighted images.
On T2-weighted images residual foci of malignant cells appear hyperintense, although necroses and inflammatory changes also demonstrate a similar signal pattern so that here too an unequivocal classification of the lesion is still not possible. However, after contrast application far more than 50 % of the changes still recognizable in patients with a complete response to therapy display neither increased signal intensity nor a marginal enhancement. If a marginal enhancement is seen, then it is explained as representing peripheral processes of repair. A lack of, or only marginal, contrast enhancement is an MRI indicator for a treated inactive tumor. However, persistent homogeneous contrast enhancement is also found in fresh compression fractures or after radiotherapy. In individual cases enhancement is still observed even years later. These enhancements therefore pose a difficult differential-diagnostic problem because they do not necessarily indicate the presence of residual tumor (Moulopoulos, 1994).
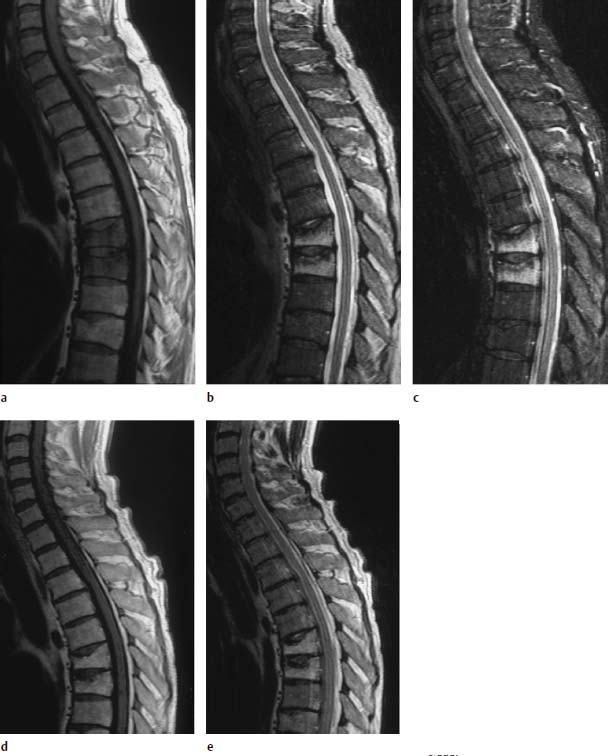
Fig.5.15a—e Compression fractures at T6 and T7. There was no known tumor involvement in this patient:
a T1-weighted sequence (SE; TR = 800 ms, TE = 12 ms): Complete reduction in signal of the two thoracic vertebrae is seen.
b T2-weighted SE sequence (SE; TR = 5310 ms, TE = 112 ms): On the whole, complete signal enhancement of the vertebral bodies T6 and T7 with end plate disruption.
c STIR sequence: Here too, there is clear homogeneous signal enhancement of the thoracic vertebrae 6 and 7.
d Follow-up image 5 months later. T1-weighted image (SE; TR = 800 ms, TE = 12 ms): Normalization of the bone-marrow signal.
e TSE (TR = 3635 ms, TE = 120 ms): Using T2 weighting, a mild signal enhancement of the thoracic vertebrae is still recognizable. This shows that the diffuse signal reduction on the T1-weighted image is not always the decisive factor in differentiating between a malignant and benign fracture. Further criteria must be taken into account for this differential diagnosis; in some cases only the clinical course will allow a final decision.
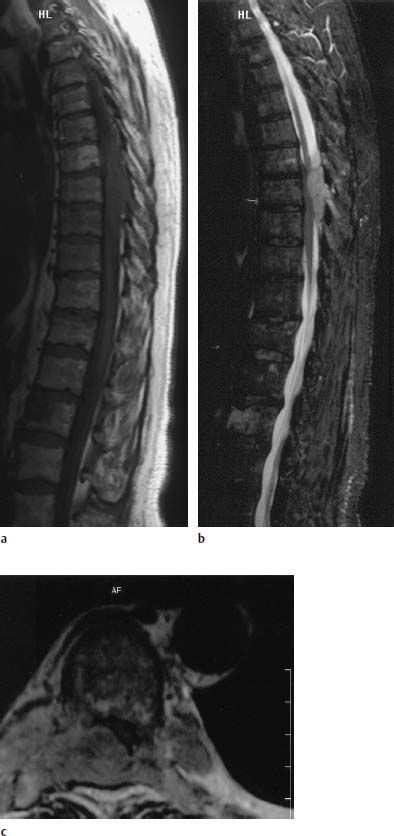
Fig. 5.16a—c Plasmacytoma with extensive epidural soft-tissue component:
a T1-weighted image (SE; TR = 800 ms, TE = 12 ms): Mottled inhomogeneous reduction in signal in the vertebral bodies with evidence of an epidural space-occupying lesion in the region of T7–T9.
b The images obtained with T2 weighting (STIR) show the epidural tumor component with a clearly better delineation against the spinal cord and CSF in comparison with the T1-weighted images.
c T2-weighted image (TSE; TR = 3995 ms, TE = 120 ms): The tumor arises from the appendant structures of the vertebrae and encroaches far into the spinal canal.
In the case of a diffuse or variegated pattern of involvement, the bone marrow of responders usually reverts back to a normal appearance on MRI. With the focal pattern, however, residual abnormalities remain, possibly due also to local destruction of bone and the resulting fibrotic changes (Fig. 5.12).
 Eosinophilic Granuloma
Incidence and Clinical Presentation
Eosinophilic granuloma is a common tumor of childhood, which involves the spine. Pain, local swelling, as well as fever and leukocytosis are typical observations. Eosinophilia is an occasional finding.
Histology
Histologically, eosinophilic granuloma is included among the diseases of Langerhans’ cell histiocytosis (previously known as histiocytosis X), together with Hand-Schüller-Christian syndrome and Letterer-Siwe disease. These three entities are characterized by:
• histiocytes,
• eosinophilic granulocytes,
• other inflammatory cells.
Pigment, hemosiderin and fat are formed in the cells by phagocytosis.
Occurrence
The majority of cases present with a solitary lesion, multiple involvement is less common. The appearance of eosinophilic granulomas varies, depending on location. Whereas a sharply demarcated osteolysis is observed in long tubular bones, destruction of the vertebra can ultimately result in almost complete collapse (vertebra plana). In less marked cases, formation of a bullous lytic lesion of the vertebral body and the posterior bony elements is seen. Involvement of adjacent vertebrae is also possible; the disk interspace, however, maintains its normal height. The thoracic and upper lumbar spine are most commonly involved (Resnick et al., 1988).
Diagnostics
MRI
The picture found on MRI is uncharacteristic and shows a hypointense formation on the T1-weighted image with a marked increase in signal intensity after intravenous contrast application. Eosinophilic granulomas show on the T2-weighted image with increased signal intensity, as do the majority of the other tumors. Paraspinal hemorrhages are recognizable by their characteristic signal intensity, which is related to the age of the hemorrhage. T1-weighted sagittal images are particularly suited for detecting involvement of adjacent vertebrae. A reduction in the height of the vertebral body is also well recognizable (Fig. 5.17). Transverse images are well suited for displaying paraspinal involvement of the soft tissues (Bohndorf et al., 1986).
 Other Bone Tumors
Apart from the bone tumors hitherto mentioned, which have a predilection for the spine, the majority of the remaining benign and malignant bone tumors can also present with vertebral manifestations, albeit less commonly. Usually these tumors also display low signal intensity on T1-weighted images and high signal intensity on T2-weighted images. Differential diagnostic information cannot be deduced from MRI, with just a few exceptions. Thus, some tumors or tumor-like lesions such as giant-cell tumors, telangiectatic osteosarcomas and hemophilic pseudotumors, as well as aneurysmal bone cysts can exhibit characteristic signal intensities due to acute or subacute hemorrhages or chronic hemosiderin deposits. In these cases high signal intensities can be found on the T1-weighted image and decreased signal intensities on the T2-weighted image and above all on T2-weighted GRE sequences (Davis, 1992; Aoki, 1996).
High signal intensity on the T1-weighted image with little reduction on the T2-weighted image can be observed with lipomas and liposarcomas. Intraosseous lipomas are an uncommon finding, however, despite the high content of fat in bone marrow. Cystic tumors with high protein content can also demonstrate high signal intensity on T1-weighted images. Low signal intensity, both on the T1-weighted and also on the T2-weighted image, is demonstrated by tumors with a high proportion of collagenous fibrous tissue or with widespread ossifications or calcifications. These include, for example, fibrous dysplasia and fibroblastic osteosarcoma (Fig. 5.18).
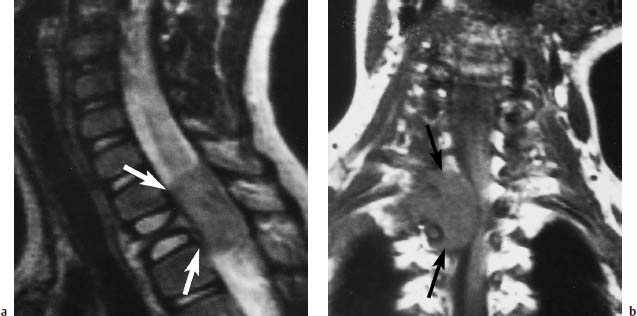
Fig. 5.17 a, b Eosinophilic granuloma of T3:
a T2-weighted image (SE; TR = 2100 ms, TE = 80 ms): Typical finding of a vertebra plana with an intraspinal tumor extension (arrows).
b Coronal section (SE; TR = 500 ms, TE = 120 ms): Better assessment of the compression of the myelon by the intraspinal tumor component (arrow).
A similar pattern is recognizable in the sclerotic zone of osteoid osteomas, with both the nidus and the surrounding edema appearing hyperintense. The MRI presentation of the osteoid osteoma, however, is not always typical (Fig. 5.1). It is possible, therefore, that in some cases, instead of the nidus, only an ill-defined increase in signal intensity on the T2-weighted image is all that is demonstrated (Hachem, 1997). A variation is also seen in chondroid tumors, which display intermediate signal intensity on the T1-weighted image and a greatly increased signal intensity on the T2-weighted image (Fig. 5.19).
The differentiation between malignant and benign tumors is only possible to a certain degree with the aid of MRI. There are some indications, however, which are strongly suggestive of benign or malignant tumors.
Benign tumors usually have a homogeneous appearance with:
• displacement of the surrounding structures,
• only slight perifocal edema,
• formation of a pseudocapsule,
• sharp demarcation,
• a slight or delayed increase in signal intensity after intravenous application of Gd-DTPA.
A perifocal zone of edema (reactive zone) is strongly suggestive of a malignant tumor. An intravenous bolus injection of Gd-DTPA using a dynamic scanning technique will produce a rapid and marked increase in signal strength. For this purpose, rapid (GRE) sequences are acquired at short intervals before and during Gd-DTPA administration, without pausing between images. The signal intensity time course of important structures can be assessed by performing region of interest (ROI) analysis. This technique can also be employed for monitoring therapy (Freyschmidt, 1980; Ramsey and Zacharias, 1985; Aisen et al., 1986; Bohndorf et al., 1986; Reiser et al., 1987; Weigert et al., 1987; Resnick et al., 1988; Sze et al., 1988c; Krahe et al., 1989).
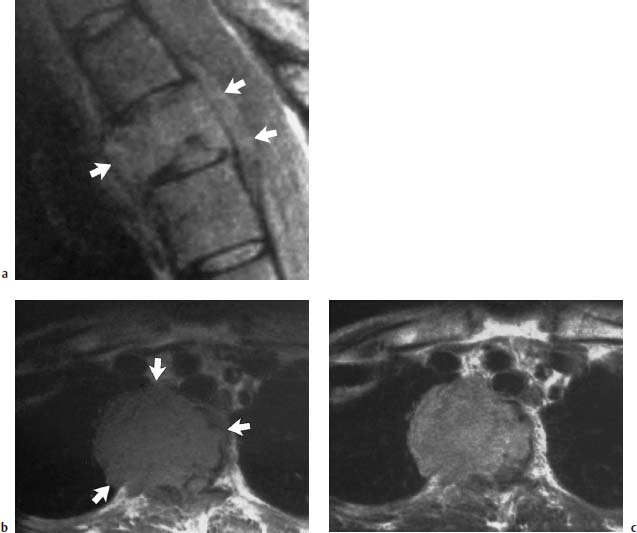
Fig. 5.18a—c Fibroblastic osteosarcoma of T4:
a T2-weighted sagittal section (SE; TR = 1600 ms, TE = 60 ms): The tumor extends beyond the vertebral contours and displays a signal intensity isointense with the other vertebral bodies (arrows).
b T1-weighted transverse section: Extensive mediastinal and right thoracic space-occupying tumor is evident (arrows).
c Only slight enhancement is identifiable after contrast application.
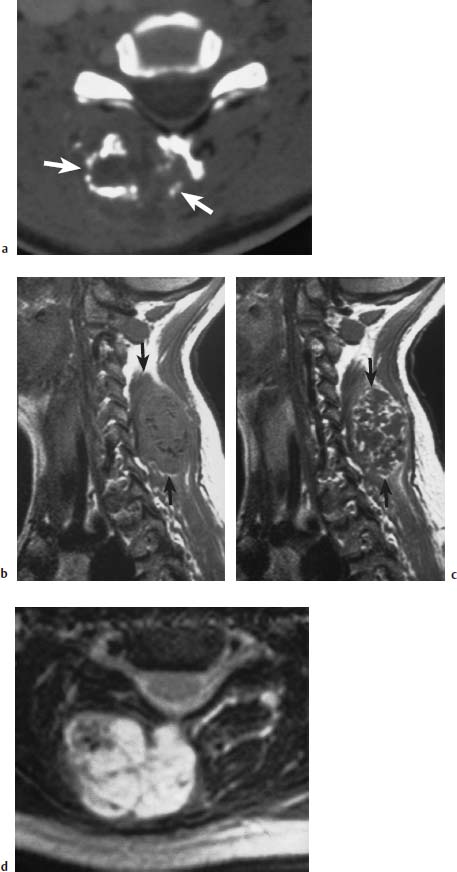
Fig.5.19a—d Ecchondroma developing from the spinous process of C6:
a CT of the tumor region with mottled, flaky tumor calcifications and large dorsal space-occupying lesion (arrows).
b MRI sagittal section (SE; TR = 650 ms, TE = 25 ms): The calcifications are recognizable as a discrete reduction in signal. The extent of the tumor is more readily assessable (arrows).
c Mottled enhancement after contrast application (arrows).
d T2-weighted image: Marked signal enhancement with mottled signal voids.
Metastases to the Vertebrae and the Epidural Space
The most common malignant changes of bone are caused by metastases, with about one-quarter of all malignant tumors showing evidence of skeletal metastases at autopsy. There is a predilection for metastases to involve those parts of the apparatus of locomotion and support that have a higher proportion of red bone marrow. The vast majority of skeletal metastases (about two-thirds) are found in the spine and sacrum. Hematogenous metastatic spread is the commonest form, while lymphogenous spread or tumor invasion by continuous spread is by far less common.
Incidence
Not all tumors metastasize equally often to the skeletal system. In decreasing order of frequency, skeletal metastases are found in the following disorders:
• mammary carcinoma,
• prostatic carcinoma,
• bronchial carcinoma,
• renal carcinoma,
• carcinoma of the uterus,
• thyroid carcinoma,
• gastric carcinoma,
• colonic carcinoma, among others.
Clinical Presentation
The clinical appearance of spinal metastases is nonuniform. In some cases no clinical symptoms are presented despite considerable tumor expansion, while in other cases fractures, vertebral collapse and epidural expansion of tumor components result in compression of the myelon. The presenting clinical symptoms in these cases include:
• pain,
• muscular weakness,
• disturbances of sensation,
• bowel and bladder dysfunction.
Diagnostics
Conventional Radiograph
Metastases are only recognizable on conventional images when more than 40 % of the cancellous bone of the vertebral body involved has been destroyed by metastasis (Fig. 5.20).
a Conventional radiograph in two planes: Disruption of the inferior end plate of L3 (arrow) without there being any indication of osteolysis or osteoblastic metastasis. The fracture was classified as old.
b, c T1-weighted (b) and T2-weighted (c) fat sat sequence: Complete metastatic infiltration of L3. Posterior cortex is convex toward the spinal canal (large arrow). Besides that, metastatic involvement of T8 with reduction in height and involvement of the pedicles and spinous process. The sagittal images already give the impression of penetration into the spinal canal (small arrow). Schmorl’s node in T7 as a secondary finding (arrowhead)
d T1-weighted transverse section after intravenous contrast application: Penetration into the spinal canal on the right with displacement of the dural
Depending on whether an osteoblastic or osteolytic type of metastatic disease is present, osteolysis of the vertebral bodies, in particular, or homogeneous or inhomogeneous sclerosis is observed on conventional radiographs. Myelography will clearly demonstrate epidural spread, including craniocaudal expansion. In most cases, the height of the intervertebral disk remains unaffected, even when two adjacent vertebral bodies demonstrate metastatic involvement. This finding is an important differential-diagnostic criterion over inflammatory changes (Resnick and Niwayama, 1988). Disk involvement, however, has also been reported in individual cases in the presence of metastatic disease (Gupta, 1996).
MRI
MRI allows very sensitive and specific portrayal of metastases of the vertebral bodies. The first exploratory examination sequence is the T1-weighted sagittal image (Fig. 5.21).
In older age, when the majority of metastases are found, the hematopoietic marrow of the spine is largely replaced by fatty marrow, so that at this age normal bone marrow appears hyperintense on T1-weighted sequences. This imaging technique displays the metastases as hypointense circumscribed circular lesions or as hypointense formations involving the entire, or almost the entire, vertebral body (Fig. 5.22).
It is also usually possible to distinguish metastases from degenerative changes of the spine, which are seen in particular in the marginal areas (lateral, anterior or posterior) of the vertebral bodies as hypointense zones. It is more difficult to recognize diffuse bone-marrow carcinosis because an almost homogeneous reduction in signal intensity of the bone marrow is seen which then appears more hypointense than the disk tissue (Figs. 5.23 and 5.24).
A very high percentage of these metastases appear as hyperintense lesions on T2*-weighted GRE sequences, whereas a much smaller percentage display an increase in signal intensity on T2-weighted SE sequences (Sardanelli, 1997). The use of T2-weighted fat-saturated sequences, however, clearly increases the detection rate for these lesions, even though fat-saturated sequences are associated with a deterioration of the signal-to-noise ratio (Mehta, 1995; Pozzi-Mucelli, 1997). According to Layer et al. (1988), opposed-phased GRE studies are even higher in contrast than SE and GRE sequences when assessing vertebral metastases.
The application of contrast material results in a lower detection rate for metastases on SE sequences because the signal is brought into line with that of vertebral fat. There is, however, a useful indication for the application of contrast material in the assessment of intraspinal tumor masses and for a more precise classification of the lesions, especially in pretreated patients (Table 5.3).
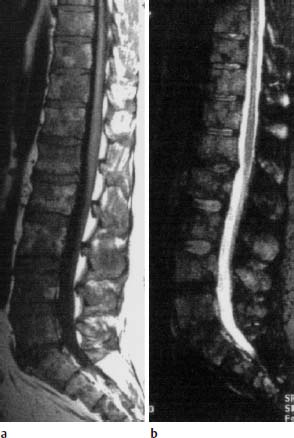
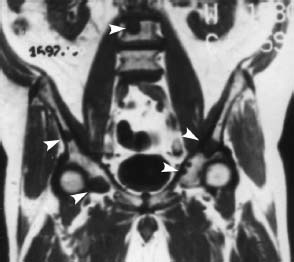
Fig. 5.22 Metastasis of a bronchial carcinoma. T1-weighted coronal image (SE; TR = 600 ms, TE = 15 ms): The metastases in the spine and pelvis are delineated from the hyperintense bone marrow as circumscribed hypointense circular lesions (arrow heads).
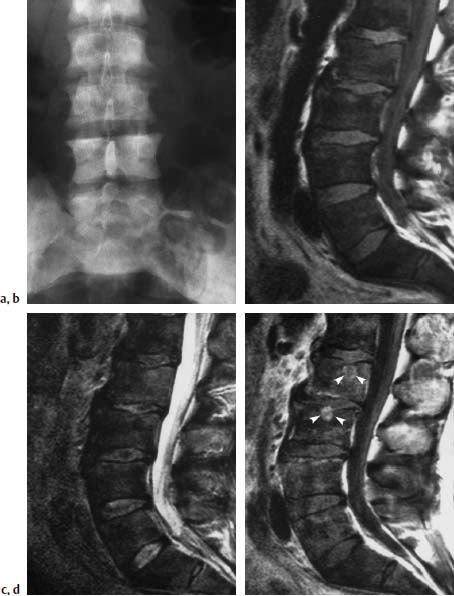
Fig. 5.23a—d Diffuse bony metastases secondary to prostatic cancer.
a Survey radiograph of the lumbar spine: Diffuse sclerosis of all imaged vertebrae due to osteoblastic metastases.
b T1-weighted sagittal image (SE; TR = 650 ms, TE = 25 ms): The bone-marrow signal of all imaged vertebrae is decreased. The intervertebral disks are displayed with higher signal intensity than the bone marrow.
c 2-weighted sagittal image (SE; TR = 2100 ms, TE = 80 ms): Here there is no circumscribed increase in signal intensity. The bone marrow is diffusely hypointense in all the vertebral bodies.
d 1-weighted image (SE; TR = 650 ms, TE = 25 ms) after intravenous application of 0.1 mmol/kg body weight Gd-DTPA: In comparison with the image without contrast, there is a partly circumscribed increase in signal intensity in the vertebral bodies. The difference of signal intensity between bone marrow and disks is smaller. There is an additional circumscribed focal contrast enhancement of L2 and L3 (arrow heads).
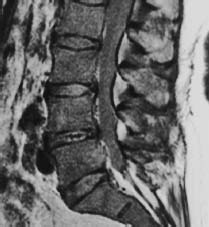
Fig. 5.24 use bony metastases secondary to mammary carcinoma (SE; TR = 600 ms, TE = 15 ms). The posterior vertebral margin of L5 is destroyed. There is a homogeneous reduction in signal intensity of all vertebral bodies, making the disks appear hyperintense to the spine.
In comparison with the detection of vertebral metastases, MRI is less sensitive in detecting involvement of the pedicles, transverse and spinous processes (Fig. 5.25) (Kosuda, 1996).
The majority of metastases are found in the thoracic and lumbar spine, while the cervical spine is less commonly affected. Because the dens can also display an inhomogeneous signal intensity, even in normal patients, differential-diagnostic problems may possibly arise in equivocal cases of minor involvement of the dens; they are, however, only seen in rare cases. During staging, coronal images through the pelvis and the proximal femur should be obtained, in addition to images of the spine.
Related posts:
Stay updated, free articles. Join our Telegram channel

Full access? Get Clinical Tree


