Fig. 1.
Basic principle of STED microscopy. STED microscopy is based on fluorescence quenching by stimulated emission. (a) Jablonski diagram of the molecular events during fluorescence. Absorption of a blue photon excites the molecule from the ground state (S0) to the first excited singlet state (S1). Normally, the excited molecule returns back to the ground state by spontaneously emitting a photon after an average period defined by the fluorescence lifetime (τ) of the fluorophore. In STED microscopy this process is actively prevented by returning the excited molecule back to the ground state via stimulated emission using a red-shifted laser (the STED laser). (b) An excitation laser pulse (blue line) causes fluorescence (in green) that decays over a period defined by the lifetime (τ) of the fluorophore, typically a few nanoseconds. For the STED laser to efficiently intercept this process, the depletion pulses (orange) must temporally coincide with the excitation pulses. (c) Schematic of the STED doughnut effect on the size of the focal spot (PSF), and hence spatial resolution of the microscope. By increasing the STED laser power and depleting the excited state on a doughnut-shaped ring around the excitation spot, the area that is allowed to give off photons by spontaneous emission, i.e., fluorescence, can be made arbitrarily small. Therefore, the STED principle overcomes the diffraction barrier in a fundamental way. (d) Line profiles of the excitation and STED laser intensities and of the resultant size of the fluorescence spot.
The resolution of the STED microscope is expressed as  , with NA denoting the numerical aperture of the lens, λ the excitation beam wavelength and I the intensity of the STED beam. I s is the STED beam intensity required to reduce the fluorescence by a factor of 1/e (13). Thus, there is in theory no longer a hard limit on spatial resolution, because Δr approaches zero when I is increased to infinity.
, with NA denoting the numerical aperture of the lens, λ the excitation beam wavelength and I the intensity of the STED beam. I s is the STED beam intensity required to reduce the fluorescence by a factor of 1/e (13). Thus, there is in theory no longer a hard limit on spatial resolution, because Δr approaches zero when I is increased to infinity.2 Materials
A schematic of a STED microscope including the most important components is shown in Fig. 2a and a photo of a functional STED microscope in Fig. 2b. The homebuilt setup is designed around a standard confocal microscope base and uses pulsed single-photon excitation at λ = 485 nm and pulsed depletion around λ = 595 nm for addressing green and yellow fluorophores.
Fig. 2.
Design of a homebuilt STED microscope (a) Schematic of a STED microscope setup used for imaging green fluorophores in living brain slices. The 595 nm STED beam is derived from a OPO, which is pumped by a Ti:sapphire laser Fig. 2. (continued) emitting at 795 nm. A phase mask introduces the intensity-zero in the center of the STED beam, and a λ/4-plate is used to optimize the doughnut-shaped intensity distribution of the STED laser in the focus. The STED beam is then aligned in space with the 485 nm excitation beam. The two pulsed lasers are synchronized and overlaid in time using a pulse delay. Using a fast nano-positioner for scanning along the z-axis, a beam scanner for x,y scanning and an inverted microscope objective configuration, there is easy experimental access to the slice from above, e.g., for electrophysiological patch-clamp recordings or dye loading. Optionally, other beams can be brought into the system, exemplified by an infrared wavelength range laser for two-photon uncaging and imaging. The fluorescence emission signal is descanned and routed into two photo-detectors separated by a 514 nm long-pass dichroic mirror, for two-color imaging. (b) Photo of a STED setup resembling the above scheme. The main components are: MaiTai Ti:sapphire lasers for STED and two-photon uncaging/imaging (1), OPO pumped by one of the MaiTai lasers (2), 485 nm excitation pulsed diode laser (3), beam scanner (4), microscope stage with electrophysiology gear (5), two APD detectors enclosed in a box (6), PMT detector (7). A flip-mounted pellicle mirror is used to send the light either to the APDs or to the PMT. (c) Close-up photo of the optical components required for merging and separating the beam paths. The edge of the microscope is visible on the right side. The linearly polarized STED beam (orange) is shaped by the vortex phase-plate (1), and aligned onto the excitation beam (blue) using a piezo-motorized mirror mount (2) by reflecting the STED beam on a 590 nm short-pass dichroic mirror that the excitation beam passes (3). The STED beam profile is optimized using a λ/2-plate (4) addressing the λ/4-plate (5) in front of the beam scanner (6). The fluorescence signal from the sample (green) is descanned through the same beam path and ultimately isolated using a 499 nm long-pass filter (7). Before the emission signal reaches the APD detectors it is cleaned by a 525 ± 50 nm band-pass filter (not in photo). A 680 nm short pass dichroic mirror is used to bring in a higher wavelength beam (red) for two-photon experiments (8).
2.1 Optical Components for Beam Steering
A broad selection of high-quality optical components must be available for routing and shaping the excitation and STED laser beams. The list includes mirrors and adjustable mirror mounts, lens telescopes for expanding, decreasing and collimating laser beams, λ/2 and λ/4 plates for controlling the polarization of the STED beam, polarizing beam splitters for selecting a given polarization, and pinholes for beam alignment. Various optical diagnostic instruments (such as a beam profiler, powermeter, shear-plate, spectrometer, auto-correlator) are also essential for building a STED system.
2.2 Microscope Base and Objective
A proven choice for building an inverted STED microscope for live-cell imaging is the base of the DMI 6000 CS Trino microscope (Leica, Mannheim, Germany) equipped with a high-numerical-aperture objective lens, e.g., PL APO, 100×, oil, NA 1.4 (9) or PL APO, 63×, glycerine w/correction ring (14) (both from Leica) (see Note 1). For building an upright system, the BX61 base from Olympus can be used. It is recommended that the scan and tube lenses, objective and microscope are all from the same manufacturer, to ensure that aberrations in the optics are properly corrected.
2.3 Excitation Laser Source
For excitation of green and yellow fluorophores a pulsed-laser diode (LDH-D-C-485; Picoquant, Berlin, Germany) delivering excitation pulses of 485 nm wavelength and of 90 ps duration, can be used (15). Laser pulsing can be externally triggered via the driver electronics and thus be synchronized with the STED laser.
2.4 STED Laser and Optical Parametric Oscillator
Although continuous wave (cw) lasers can be used instead of pulsed lasers, they need to be run at much higher average power than pulsed lasers to achieve a comparable gain in spatial resolution (16), which may pose problems for live-cell applications.
The λ = 595 nm STED beam for quenching yellow and green fluorescence can be derived from a Ti:sapphire pulsed laser (repetition rate ∼80 MHz, pulse duration: 200 fs, wavelength λ = 795 nm; MaiTai HP, Spectra-Physics, Darmstadt, Germany) and converted to the desired wavelength by an optical parametric oscillator (OPO BASIC Ring fs RTP, APE, Berlin, Germany) (see Note 2) (9). In addition, a band-pass filter (e.g., 596 ± 22 nm) should be used to clean up the STED beam. For experiments in brain slices the power of the STED laser is typically between 5 and 20 mW at the back aperture of the objective. The intensity of the STED beam can be rapidly and continuously changed using a Pockels cell (Conoptics, Danbury, CT), whereas a mechanical shutter is used to turn the beam off.
2.5 STED Pulse Dispersion in Glass Rod and Polarization-Preserving Fiber
The 200 fs STED pulses coming from the OPO must be stretched in time to overlap with the 90 ps excitation pulses (Fig. 1b). Stretching is done by sending the beam through a polarization-preserving fiber of 100 m length (Schäfter & Kirchhoff, Hamburg, Germany), after which the pulses are around 300 ps long (9). To protect the fiber from the high peak powers inherent in fs pulses, the beam is first sent through a 25 cm glass rod (SF6), which broadens the pulses to around 2 ps (10). More than 50% transmission through the fiber can be readily achieved with standard coupling optics.
2.6 Pulse Delay Generator
For synchronizing the STED and excitation pulses and optimally coinciding them in time, the excitation laser is driven as a slave of the Ti:sapphire laser via an electronic pulse synchronizer with adjustable delay, for which custom-built or commercial solutions exist.
2.7 Helical Vortex Phase Mask
To produce the doughnut intensity distribution, the STED beam is expanded to around 10 mm diameter, collimated, linearly polarized and passed through a polymeric phase mask (RPC Photonics, Rochester, NY), imprinting a helical-phase delay of exp (iϕ), with 0 < ϕ < 2π onto the wave front (Fig. 3a). The phase mask produces a destructive interference pattern, such that the light intensity is zero all along the central axis of the beam (17). In addition to x–y, the spatial resolution can also be improved by the STED principle along the z axis by using another phase mask that imprints a π delay. Both patterns can be imposed on a single beam by splitting it in two and passing each branch through the respective phase mask (18). Before entering the objective, the STED beam passes through a λ/4-plate, which circularly polarizes the light and improves the shape of the doughnut (19) (Fig. 3d).
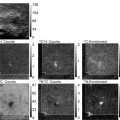
Fig. 3.
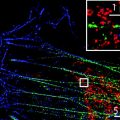
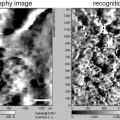
Evaluating the performance of a STED microscope. The figure represents the work flow for evaluating the STED microscope performance. (a–g) Screen-shots from experiments performed using the acquisition software ImSpector. (a, b) The STED beam doughnut profile is evaluated by reflecting the PSF on gold beads. (b, c) For effective depletion a symmetric doughnut with a good central null is crucial. (c) shows the line profile of the line through the doughnut in (b); the zero is around 5% of the max intensity. By scanning a single bead and switching between the excitation and the STED laser the two beams are brought into coincidence. (d) and (e) show z-profiles of the effective PSF of the excitation (d) and STED (e) beam. When the beams are brought into coincidence spatially the fluorescence quenching is measured by z-scans in a sea of fluorescence. (f) Excitation observed from scanning the excitation beam in the sea of fluorescence. (g) Repeating the scan with the STED beam superimposed on the excitation beam, fluorescence is efficiently reduced, here by around 75%. The sea of fluorescence is also used to determine the optimal delay of the STED pulses relative to the excitation pulses. When effective quenching is obtained in the sea of fluorescence, resolution is assessed by scanning fluorescent beads. (h) Fluorescent beads (diameter 40 nm) scanned in confocal mode. The frame is 3.5 μm wide. (i) The same frame imaged in STED mode with a clear resolution enhancement. (j) The line profiles of the (dotted) lines through two beads in the lower left of the frame reveal a resolution in STED mode of around 50 nm. Note that the FWHM values are calculated based on Gaussian fits through the line profiles, and the line profiles are based on 4-pixel wide lines.
2.8 Dichroic Filters for Merging the Two Beams and Filtering Out the Emission Signal
The STED beam can be superimposed on the excitation beam by using a suitable short-pass filter (in our case with a cut-off wavelength of 590 nm), which passes the excitation light and reflects the STED beam (Fig. 3c). Immediately before the merge, the STED beam is reflected onto a piezo-controlled mirror, which is used for fine alignment of the STED and excitation beams (see Note 3) (Fig. 3b).
Using de-scanned, epi-fluorescence detection, the fluorescence signal follows the optical path in reverse direction of the STED and excitation beams back through the scanner. The emission signal can be isolated by another dichroic filter, e.g., a 499 nm long-pass in the case of GFP (Fig. 3g), and cleaned up with a band-pass filter in the range 525 ± 60 nm before reaching the detector(s) (10) (Fig. 3a).
2.9 Beam Scanner and Fast Nano-Positioner of Microscope Objective
Whereas stage scanning is easier to implement, beam scanning can be much faster and is more compatible with electrophysiological recordings, as the sample and the stage do not move during scanning (20). The telecentric Yanus IV scanner (TILL Photonics, Gräfelfing, Germany) has proven useful for STED imaging (21) (Fig. 3f), in combination with standard data acquisition boards from National Instruments and the scanning software ImSpector (22). Rapid scanning in the z-axis can be done using a piezo-focuser (e.g., P-725, Physik Instrumente, Germany).
2.10 Photodetectors
Photomultiplier tubes (PMTs) or avalanche photodiodes (APDs, e.g., SPCM-AQR-13; PerkinElmer, Fremont, CA) can be used for STED imaging, the latter having a much higher quantum efficiency (50–60% at λ = 535 nm), but considerably smaller dynamic range. In addition, hybrid detectors combining properties of PMTs and APDs may prove useful for STED imaging (23). A separate PMT can be used for aligning the optical system and optimizing the doughnut, by looking at the back reflection of gold beads (Fig. 3a). For two-channel spectral detection, a suitable dichroic mirror and a second APD are required (15) (Fig. 1a). The fluorescence signal is focused into a multimode optical fiber coupled to the APD. If the fiber has a diameter corresponding to the size of an Airy disk it serves as confocal pinhole.
2.11 Perfusion Recording Chamber
The brain slice is placed into an imaging/electrophysiological recording chamber equipped with temperature control and a perfusion system. A transparent chamber bottom is used for imaging on an inverted microscope (see Note 4). The glass bottom should be clean and without scratches, and the thickness should match the specifications for the given objective.
Related posts:
 Introduction: Nanoimaging Techniques in Biology
 Secondary Ion Mass Spectrometry Imaging of Biological Membranes at High Spatial Resolution
 Photoswitchable Fluorophores for Single-Molecule Localization Microscopy
 Functional AFM Imaging of Cellular Membranes Using Functionalized Tips
 Correlative Optical and Scanning Probe Microscopies for Mapping Interactions at Membranes
 Nanoimaging Cells Using Soft X-Ray Tomography
Stay updated, free articles. Join our Telegram channel

Full access? Get Clinical Tree


