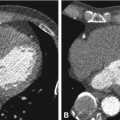
Fig. 24.1
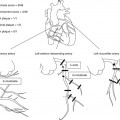
Normal coronary arteries in a 56-year-old female patient presenting with nonanginal chest pain (see Chap. 6 for a description of angina types) and 0.2 mV (2 mm) ST segment depression in II, III, and aVF during stress testing (bicycle). Panels a–C show the curved multiplanar reformations along the left anterior descending (LAD), left circumflex (LCX), and right coronary (RCA) artery, respectively. Three-dimensional reconstructions of the left (Panel D) and right (Panel E) coronary artery are also unremarkable and demonstrate a codominant coronary distribution in this patient, which is found in 7–20% of all individuals. This distribution type is also seen on the corresponding conventional coronary angiograms of the left (Panel F) and right coronary artery (Panel G). Ruling out coronary artery disease in patients with low-to-intermediate pretest likelihood is the main application of coronary CT angiography. Ao aorta
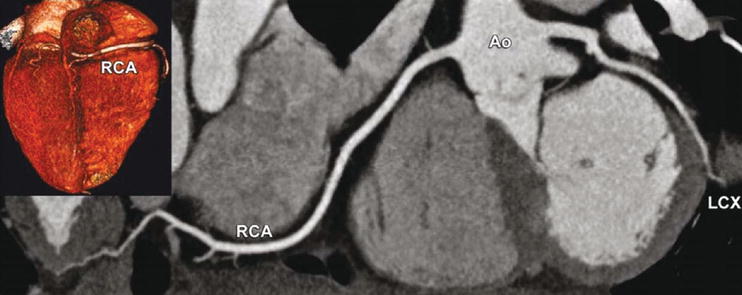
Fig. 24.2
Right coronary artery dominance, which is found in 60–85% of all individuals, as seen with CT using a curved multiplanar reformation along the right coronary (RCA) and left circumflex (LCX) coronary artery (inset shows the base of the heart with RCA dominance). Ao aorta
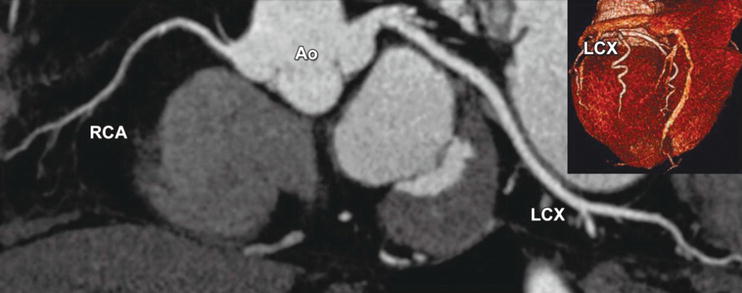
Fig. 24.3
Left coronary artery dominance, which is found in 7–20% of all individuals, as seen with CT using a curved multiplanar reformation along the right coronary (RCA) and left circumflex (LCX) coronary artery (inset shows the base of the heart with dominance of the LCX). Ao aorta
24.2 Coronary Artery Plaques
Coronary artery plaques of potentially different clinical importance are shown in Figs. 24.4–24.7.
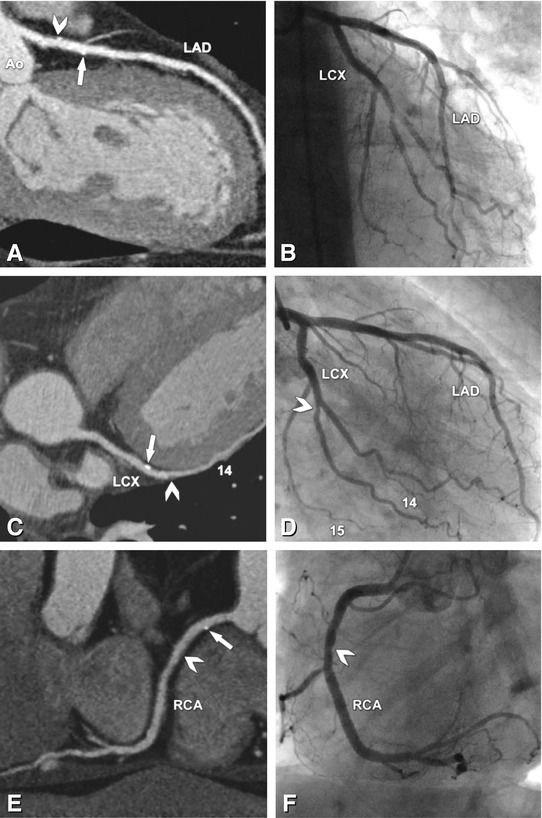
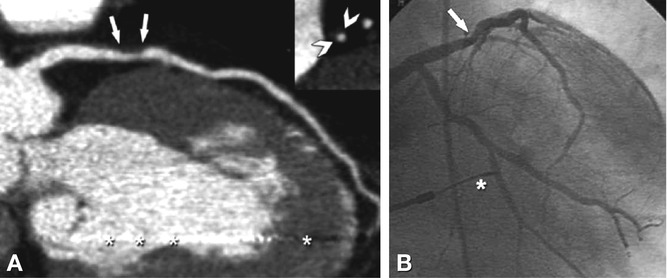
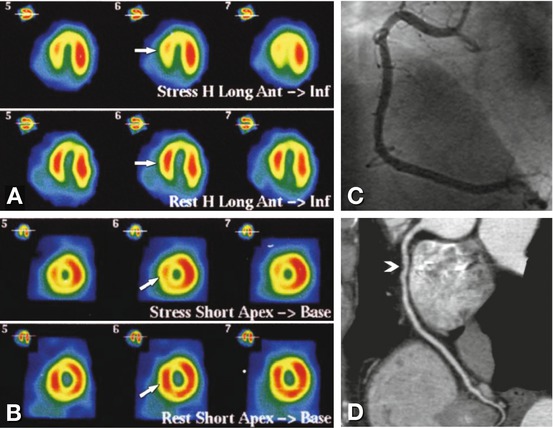
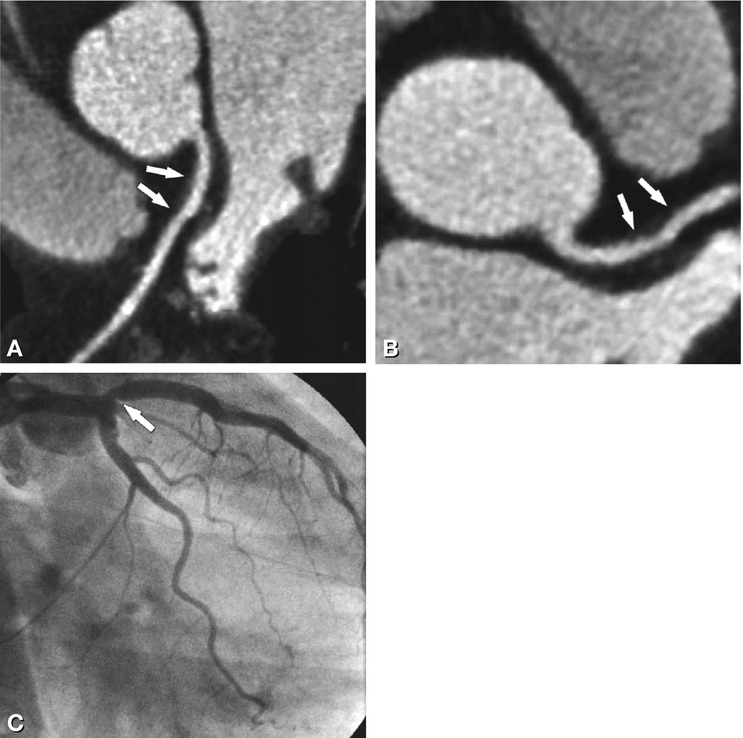

Fig. 24.4
No significant coronary artery stenoses, but small calcified plaques (“calcium spots”) and noncalcified plaques in all coronaries in a 65-year-old male patient. The curved multiplanar reformation along the left anterior descending (LAD) coronary artery (Panel A) shows a calcium spot (arrow) and a mixed plaque (consisting of calcified and noncalcified components, arrowhead), which do not cause any indentation of the coronary lumen, as demonstrated by conventional coronary angiography (Panel B). There is another calcium spot (arrow) in the middle segment of the left circumflex coronary artery (LCX, Panel C) that does not cause any visible luminal narrowing on conventional angiography (Panel D), whereas a purely noncalcified plaque in the second obtuse marginal branch (arrowhead, segment 14) causes slight indentation of the coronary lumen (arrowhead in Panel D). The curved multiplanar reformation along the right coronary artery (RCA) shows the same findings (Panel E) with a calcium spot (arrow) not causing luminal narrowing, whereas the more distal noncalcified plaque in segment 2 (arrowhead in Panel E) is the cause of slight indentation (arrowhead in Panel F). Ao aorta, 15 segment 15 (distal LCX)

Fig. 24.5
Large noncalcified plaque in the proximal left anterior descending coronary artery (arrows in Panel A) of a 72-year-old male patient with typical angina pectoris (see Chap. 6 for a description of angina types). The plaque causes positive remodeling of the outer vessel wall (see inset in Panel A; arrowheads demarcate the boundaries of this plaque). The so-called remodeling index is defined as the ratio of the vessel area at the plaque site (including plaque and lumen area) to the mean of the vessel area at the reference site proximal and distal to the plaque. Positive remodeling, as in this case, is present if the index is >1.05 and indicates an increased risk for unstable presentation of patients. However, the value of potential clinical consequences (e.g., initiation or increase in statin therapy) in patients with noncalcified plaques without significant luminal narrowing but positive remodeling has not been established. This plaque (arrow) caused a 35% diameter stenosis, as measured with quantitative analysis of coronary angiography (Panel B). Note the artifacts in CT (asterisks in Panel A) arising from the cardiac pacemaker lead (asterisk in Panel B)

Fig. 24.6
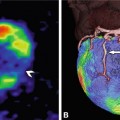
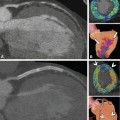
Example of a false-positive single-photon emission computed tomography (SPECT) examination with 99mTc in a 68-year-old male patient with reduced septal and inferior stress perfusion (arrows in Panels A and B). These findings were suggestive of a significant stenosis in the right coronary artery. The right coronary artery, however, was normal and without signs of significant stenosis on conventional coronary angiography (Panel C) or coronary CT angiography (curved multiplanar reformation, Panel D). However, there was a noncalcified coronary plaque in the midsegment of the right coronary artery on CT (arrowhead in Panel D) that was not visible on conventional angiography and might have been responsible for the SPECT findings

Fig. 24.7
Large noncalcified plaque (arrows in Panels A and B) in the proximal left anterior descending coronary artery in a 58-year-old female patient with typical angina pectoris. The CT results are illustrated using a curved multiplanar reformation (Panel A) and maximum-intensity projection (Panel B). This plaque also results in positive remodeling (remodeling index of >1.05), but the indentation of the coronary artery lumen (from below, arrow in Panel C) is not significant (30% diameter stenosis on quantitative analysis)
24.3 Coronary Artery Stenoses
Significant coronary artery stenoses and occlusions and their variable appearance on cardiac CT, when compared with conventional coronary angiography, are shown in Figs. 24.8–24.17. See Chap. 20 for a summary of the diagnostic performance of coronary CT angiography in this application.
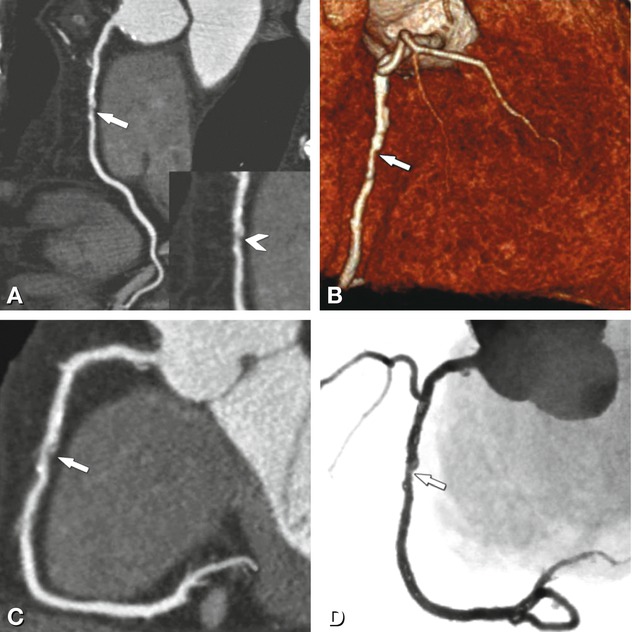
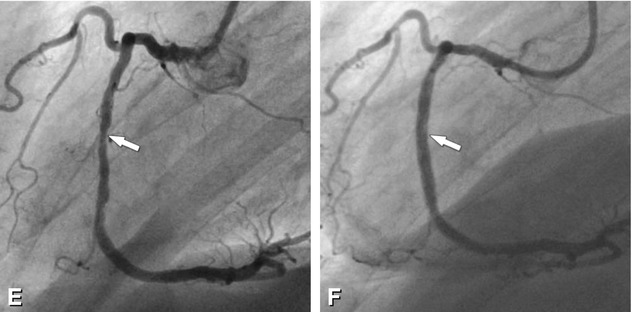
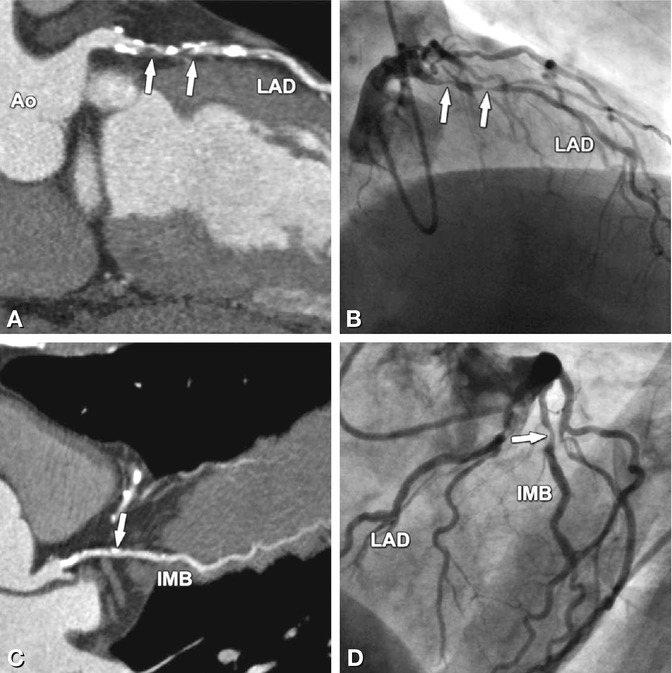
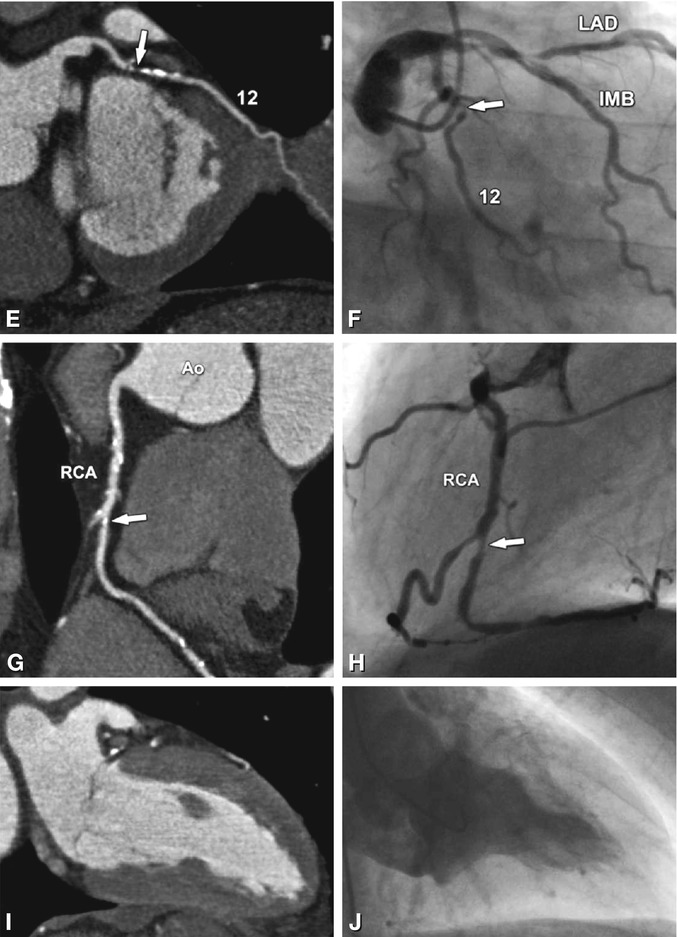
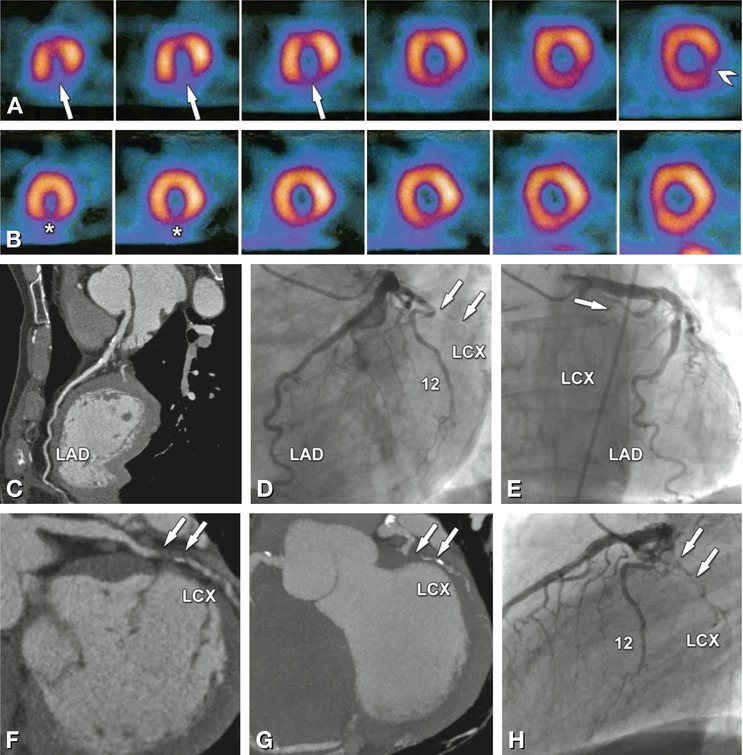
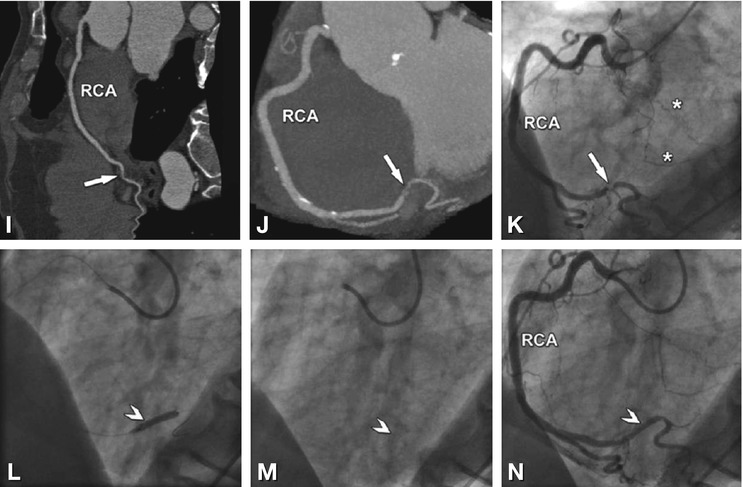
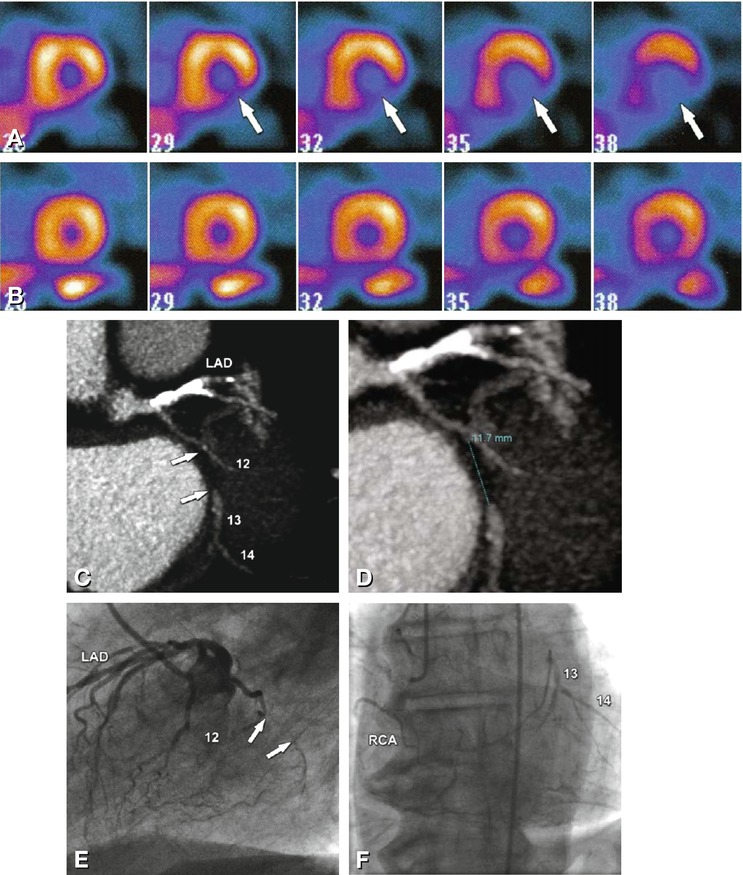
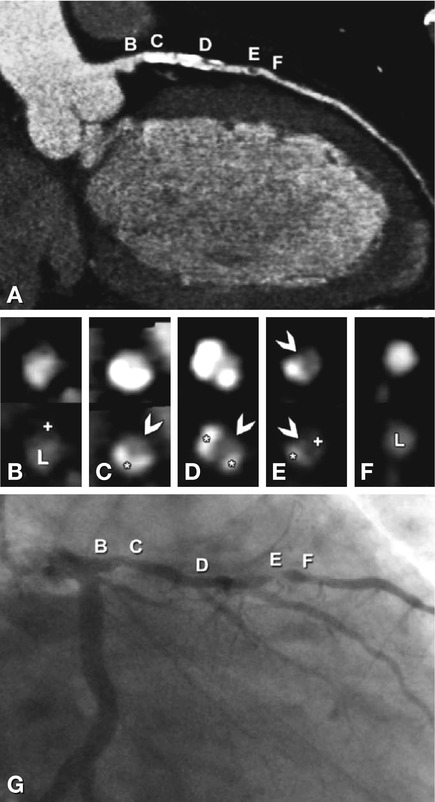
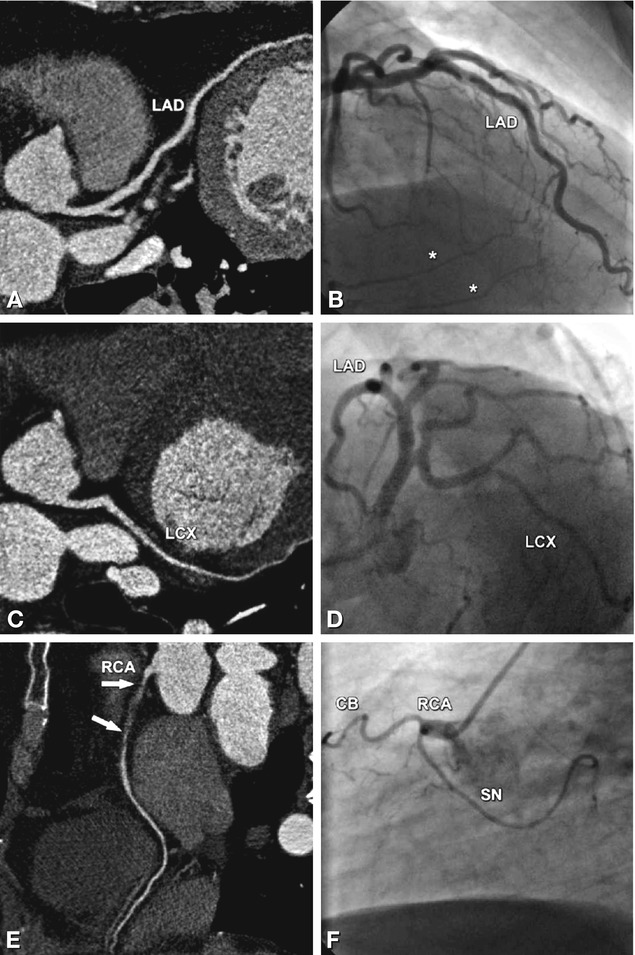
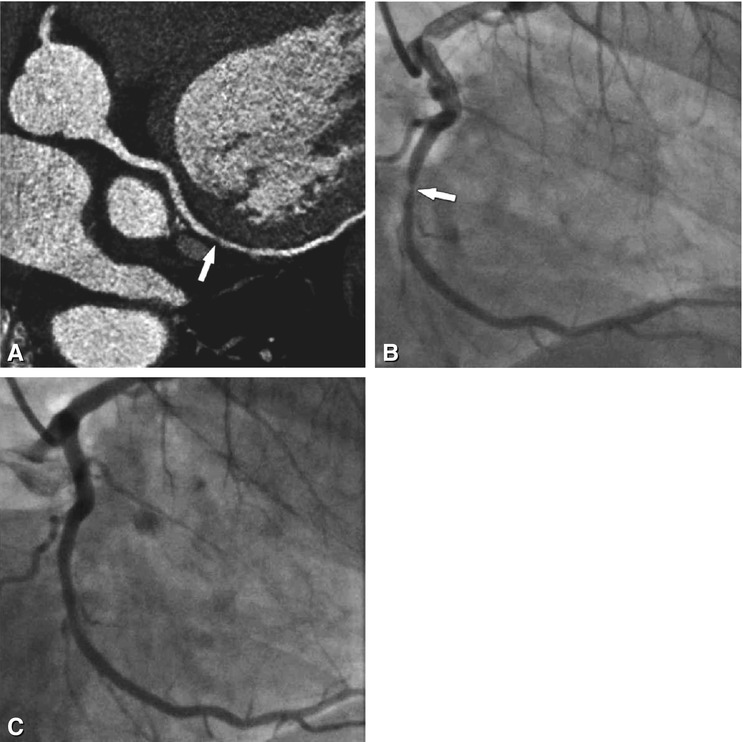
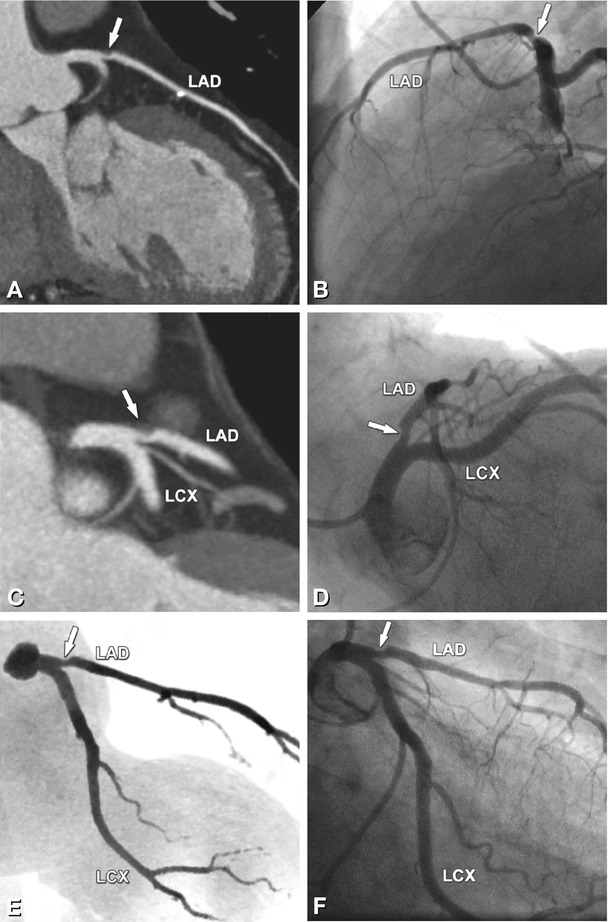
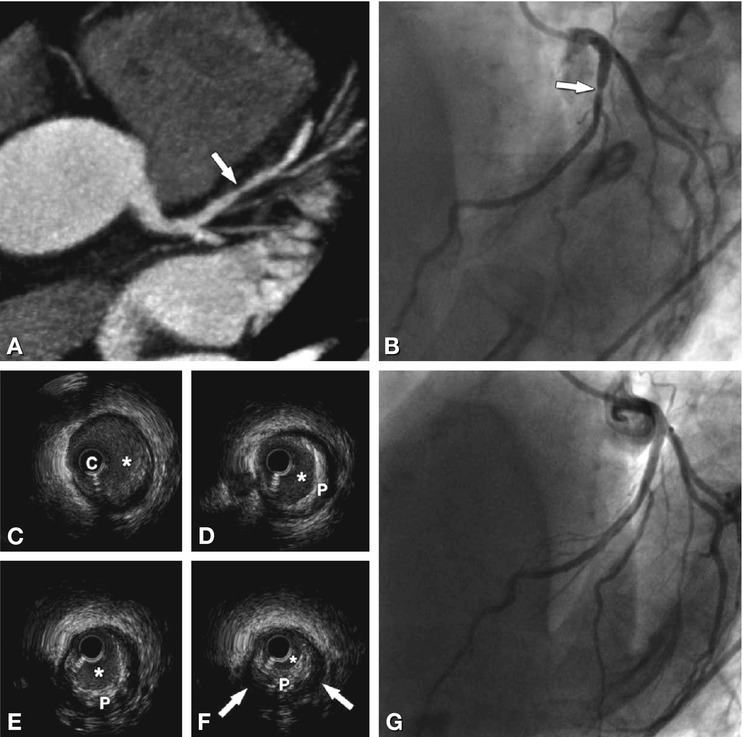
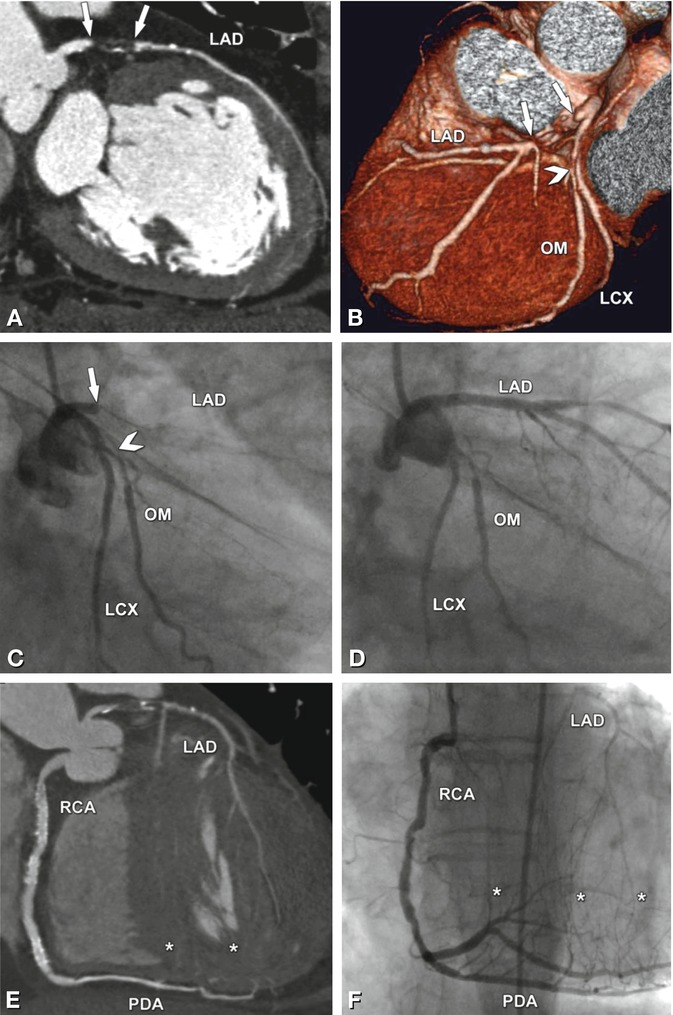


Fig. 24.8
Significant stenosis in the mid-segment of the right coronary artery (arrows) on different CT reconstructions (Panels A–D) in a 62-year-old male patient with typical angina pectoris but unremarkable exercise ECG. Reconstructions of CT include curved multiplanar reformation (Panel A, inset shows the stenosis (arrowhead) in a magnified view), volume-rendered three-dimensional reconstruction (Panel B), thin-slab maximum-intensity projection curved along the vessel path (so-called CATH view, Panel C), and angiographic emulation (Panel D). There was good correlation with the findings on subsequently performed conventional coronary angiography (arrow in Panel E). During the same invasive angiographic examination, this lesion was treated by stent placement with no residual stenosis (arrow in Panel F)


Fig. 24.9
Significant stenoses (arrows) in the four main coronary vessels in a 63-year-old male patient with typical angina pectoris and 0.2 mV (2 mm) ST segment depression on exercise ECG in II, III, and aVF indicating posterior ischemia. Coronary CT results are shown as curved multiplanar reformations along the vessels (left column) and are directly compared with conventional coronary angiography (right column, stenosis degrees obtained with quantitative analysis). There are two 80% diameter stenoses (arrows) in the proximal and mid-segment of the left anterior descending coronary artery (LAD, Panels A and B). These result mainly from noncalcified plaques in these two segments (Panel A). However, there are also severely calcified plaques that do not result in significant diameter reductions. An intermediate branch (IMB) is present in this patient and has a 65% diameter stenosis resulting from a calcified plaque (arrow in Panels C and D). There is another short significant coronary stenosis resulting from a noncalcified plaque in the first obtuse marginal branch (segment 12, Panels E and F), with a diameter stenosis on conventional coronary angiography of 75% that was clearly overestimated on CT (90–95%, Panel E). In contrast, the 80% diameter stenosis of the mid-right coronary artery (RCA, Panel H), as determined by quantitative coronary angiography, was underestimated by CT as only 65% (Panel G). Global left ventricular ejection fraction was 53% on CT (end-systolic two-chamber view, Panel I) and 50% on cineventriculography (end-systolic right anterior oblique view, Panel J). Thus, according to guidelines (Chap. 11) percutaneous stenting, rather than coronary bypass grafting, was initiated (beginning with the stenosis in the RCA responsible for the ischemic findings on exercise testing). Ao aorta


Fig. 24.10
Two-vessel coronary artery disease correctly identified on single-photon emission computed tomography (SPECT) myocardial perfusion imaging (Panels A and B) and coronary CT angiography (Panels C, F, G, I, and J) in a 65-year-old male patient with a 1-month history of atypical angina pectoris. SPECT shows ischemia in the apical and mid-inferior segments (arrows in Panel A, short-axis views) that correlates with less markedly reduced perfusion in the same segments at rest (asterisks in Panel B). In addition, SPECT shows ischemia in the basal inferolateral segment (arrowhead in Panel A). Coronary CT angiography shows no significant stenosis in the left anterior descending coronary artery, but only calcified plaques (LAD, Panel C). This finding is in agreement with conventional angiography (Panels D and E). However, there is a 10-mm-long occlusion of the mid-left circumflex coronary artery (LCX) caused by a mainly noncalcified plaque, as seen with CT (arrows in Panels F and G). Panel F is a curved multiplanar reformation along the vessel path, and Panel G is a maximum-intensity projection. Conventional coronary angiography confirms the presence of the occlusion but fails to exactly determine the length of the occlusion (arrows in Panels D, E, and H), while it nicely demonstrates the presence of right-to-left collaterals bridging the LCX occlusion (asterisks in Panel K). Both CT (Panels I and J) and conventional angiography (Panel K) depict a rather short significant 80% diameter stenosis (arrow) at the crux cordis in the right coronary artery (RCA). Since the occlusion was considered to be a long-standing process, the recent onset of symptoms was most likely due to the reduction in collateral flow to the LCX because of the RCA stenosis. Thus, the RCA stenosis was stented (arrowheads) in the same angiographic session, with good technical success (Panels I–N)

Fig. 24.11
Occlusion of the left circumflex coronary artery (LCX) in a 72-year-old male patient with atypical angina pectoris. There is basal and mid-cavity inferolateral and posterior ischemia (arrows) on single-photon emission computed tomography (SPECT) myocardial perfusion imaging (Panel A, stress exam). There was no perfusion deficit during the examination of SPECT at rest (Panel B). Coronary CT angiography shows a 12 mm-long occlusion (arrows and measurement) of the mid-LCX (segment 13) as a result of a noncalcified plaque just distal to the branching of a small obtuse marginal artery (segment 12, Panels C and D, maximum-intensity projections). Conventional coronary angiography nicely shows the occlusion (arrows in Panel E) and demonstrates right-to-left collaterals, with filling of the middle and distal left circumflex coronary segments (Panel F). Despite the purely noncalcified occlusion, percutaneous revascularization failed, most likely because of the location at a branching obtuse marginal artery. Note that during this angiographic session, the left anterior descending coronary artery (LAD) was successfully revascularized. RCA right coronary artery

Fig. 24.12
Diffuse atherosclerotic changes in the left anterior descending coronary artery in a 63-year-old male patient with typical angina pectoris (curved multiplanar reformation of CT in Panel A). For correlation, cross-sections orthogonal to the curved multiplanar reformation along the vessel obtained by CT (Panels B–F) and conventional coronary angiography (Panel G) are provided. The letters from B to F indicate matching sites on CT (Panel A) and conventional angiography (Panel G). The corresponding cross-sections are provided in Panels B–F using standard coronary artery settings (top row) and bone-window-like settings (bottom row). Interestingly, despite the diffuse changes, there is only one significant luminal narrowing (90% diameter stenosis) of the coronary artery (arrowhead in Panel E), which is caused by a noncalcified plaque (plus in Panel E) and calcified plaque (asterisk in Panel E). Note that the residual lumen at the site of this plaque is better appreciated using the standard coronary artery window-level settings (arrowhead in the upper row in Panel E). In contrast, the stenosis diameter at the sites of highly calcified coronary artery plaques (asterisks in the bottom row in Panels C and D) is more easily evaluated using bone-window settings (arrowheads in the bottom row in Panels C and D). The proximal vessel segments (B in Panel G) and distal vessel segments (F in Panel G) appear very similar on conventional coronary angiography (Panel G). However, CT shows a relevant difference, with a large noncalcified plaque (plus in Panel B) proximally without luminal narrowing (L in Panel B), but no such atherosclerotic changes in the distal vessel segment ( Panel F). This difference underscores the underestimation of the extent of atherosclerosis with conventional coronary angiography, which is well known from necropsy and intravascular ultrasound studies

Fig. 24.13
Occlusion of the right coronary artery (RCA) in a 53-year-old male patient with rather atypical presentation (see Chap. 6 for a description of angina types) and 0.05 mV (0.5 mm) ST segment depression during stress testing in II, III, and aVF indicating posterior ischemia. There are no significant stenoses in the left anterior descending (LAD in Panels A and B) and left circumflex coronary artery (LCX in Panels C and D) as seen with coronary CT (curved multiplanar reformations in Panels A and C) and conventional coronary angiography (Panels B and D). The occlusion in the proximal and middle segments of the RCA extends over a length of 4 cm and is not calcified (arrows in Panel E). Because of the short distance from the ostium of the RCA to the beginning of the occlusion (0.5 cm, Panel F), percutaneous revascularization was unsuccessful. Note that CT is superior to invasive angiography in identifying the exact length of the occlusion (arrows in Panel E). Coronary bypass surgery was not considered as an option in this patient because there was good left-to-right collateralization of the occlusion (asterisks in Panel B), and the patient had only mild symptoms. However, medical therapy was optimized. CB conus branch, SN sinus node artery

Fig. 24.14
Significant stenosis of the left circumflex coronary artery (arrows) in a 76-year-old male patient with typical angina pectoris, as seen with CT ( Panel A) and conventional coronary angiography (Panel B). Measurement of the percent diameter stenosis resulted in values of 70% for CT and 75% for conventional angiography (with quantitative analysis). The stenosis was caused by a noncalcified plaque (arrow in Panel A). The outcome of percutaneous coronary intervention is shown in Panel C

Fig. 24.15
Borderline stenosis (arrows) of the proximal left anterior descending coronary artery (LAD) in a 62-year-old male patient with typical angina pectoris, as seen with CT (left column) and conventional angiography (right column). Results of coronary CT angiography are shown as a curved multiplanar reformation (Panel A), thin-slab maximum-intensity projection (Panel C), and angiographic emulation (Panel E). There is good correlation with the corresponding invasive angiogram projections (Panels B, D, and F). Both CT and quantitative conventional coronary angiography estimated a percent diameter stenosis of 50%. Because there were no signs of ischemia on exercise ECG, no revascularization was attempted. With optimized medical management, the patient’s angina pectoris resolved. Note that there is a small calcified plaque in the mid-LAD (Panel A). LCX left circumflex coronary artery

Fig. 24.16
Coronary artery stenosis (arrow) in the left anterior descending coronary artery, graded differently by CT (Panel A) and invasive angiography (Panel B) in a 62-year-old female patient with typical angina pectoris and ST segment depression of 0.15 mV (1.5 mm) in V4-6 during stress testing (bicycle) indicating anterior ischemia. CT shows a short 70% diameter stenosis caused by a noncalcified plaque in the proximal vessel segment with positive remodeling (Panel A, maximum-intensity projection), whereas quantitative analysis of conventional angiography shows only a 40% diameter reduction. Because of worsening angina pectoris and the coronary CT findings, repeat angiography, including intravascular ultrasound (Panels C–F), was performed 6 months later. Intravascular ultrasound (cross-sections), located from proximal LAD to the stenosis, confirmed the presence of the plaque (P in Panels D–F) that caused a short 70% diameter stenosis (arrows in Panel F) of the lumen (asterisk in Panels C–F). On the basis of these findings, percutaneous coronary intervention was performed (Panel G). C intravascular ultrasound catheter

Fig. 24.17
Occlusion of the proximal left anterior descending coronary artery (LAD) in a 78-year-old female patient with a 2-week history of typical angina pectoris (arrows in Panels A–C). A curved multiplanar reformation of CT is shown in Panel A, while Panel B is a volume-rendered three-dimensional reconstruction. There is an excellent correlation with conventional coronary angiography, and the length (1.5 cm) of the occlusion, which was mainly caused by a noncalcified plaque, is better seen with CT (arrows in Panel A). Percutaneous coronary intervention was performed during the same angiographic session, and good revascularization was achieved (compare Panel D with Panel C). There was also a significant stenosis (arrowhead in Panels B and C) of the obtuse marginal artery (OM) of the left circumflex coronary artery (LCX). The LAD occlusion was collateralized via septal branches (asterisks in Panels E and F) arising from the posterior descending coronary artery (PDA). Panel E is a CATH view (curved thin-slab maximum-intensity projection) of coronary CT angiography along the right coronary artery (RCA). This CT reconstruction is superior in that it depicts both the RCA with the collaterals (asterisks) and the LAD (with the occlusion) in a single image
24.4 Coronary Artery Bypass Grafts
Arterial and venous coronary artery bypass grafts differ in diameter, but both and are usually evaluable by CT. Examples are shown in Figs. 24.18–24.26. See Chap. 25 for a summary of the diagnostic performance of coronary CT angiography in this application.
Get Clinical Tree app for offline access

Fig. 24.18
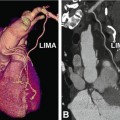
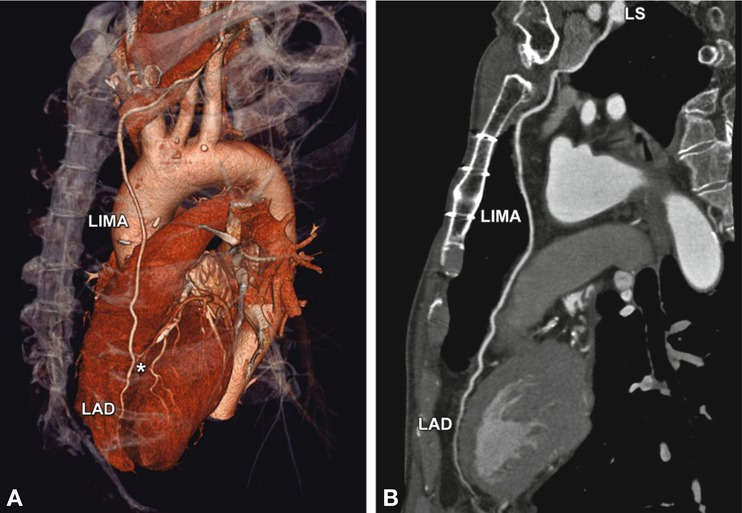
Normal left internal mammary artery (LIMA) coronary bypass graft to the left anterior descending coronary artery (LAD). The CT data are shown in a three-dimensional volume-rendered reconstruction (left anterosuperior view, Panel A), with the distal anastomosis indicated by an asterisk. The curved multiplanar reformation along the arterial graft (including its origin from the left subclavian artery, LS) is shown in Panel B

Fig. 24.19
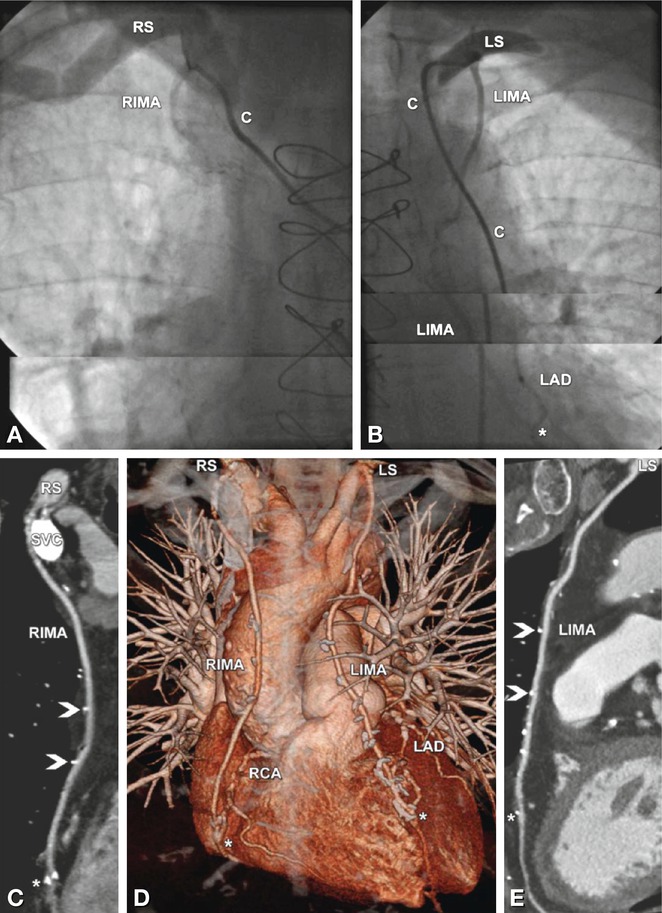
Advantages of coronary CT angiography in depicting coronary bypasses. Example of patent coronary arterial bypass grafts in a 68-year-old male patient with typical angina pectoris who underwent bypass grafting 7 years earlier. Conventional coronary angiography failed to demonstrate patency of the graft because it was not possible to selectively insert the catheter into the right internal mammary artery (RIMA, Panel A). C indicates the position of the catheter. The left internal mammary artery (LIMA) coronary bypass to the left anterior descending coronary artery (LAD) including the distal anastomosis (asterisk) was normal on conventional angiography (Panel B). CT was initiated, and in contrast to the conventional angiograms, it was able to demonstrate a normal RIMA graft to the right coronary artery (RCA) on both a curved multiplanar reformation (Panel C) and a three-dimensional volume-rendered reconstruction (anterior view, Panel D). Coronary CT angiography also confirmed the patency of the LIMA to the LAD (Panels D and E). Note the metallic surgical clips along the arterial bypass grafts (arrowheads in Panels C and E) and the distal anastomoses (asterisk in Panels C and E). Very dense contrast material is still present in the superior vena cava (SVC) because the injection was performed via a right cubital vein. Deviating from the standard procedure of contrast injection into the right arm veins and using left-sided injection instead might have been preferable in this patient. This way, LIMA assessment might have been limited, but CT was primarily performed because conventional angiography was nondiagnostic with regard to the RIMA graft. C catheter, LS left subclavian artery, RS right subclavian artery

Fig. 24.20
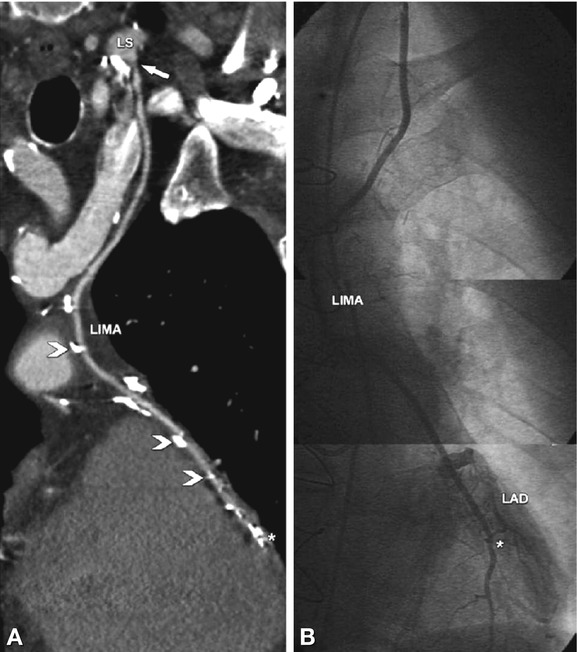
Advantages of conventional coronary angiography in depicting coronary bypasses. In this 74-year-old male patient with atypical angina pectoris who underwent left internal mammary artery (LIMA) coronary bypass grafting to the left anterior descending coronary artery (LAD) 4 years ago, CT was unable to rule out significant stenoses because of artifacts arising from nearby dense contrast material in the veins (arrow) and surgical clips (arrowheads in Panel A


Stay updated, free articles. Join our Telegram channel

Full access? Get Clinical Tree


