Introduction
The identification of carotid artery stenosis is the most common indication for cerebrovascular ultrasound. The majority of stenotic lesions occur in the proximal internal carotid artery (ICA); however, other sites of involvement in the carotid system may or may not contribute to significant neurologic events. Up to 30% of all major hemispheric events (stroke, transient ischemic attacks [TIA], or amaurosis fugax) are thought to originate from disease at the carotid bifurcation. However, stenoses in other carotid artery segments such as the distal ICA (an area not typically well seen on routine carotid ultrasound), the common carotid artery (CCA), or the innominate artery (IA) may be equally significant. Stenoses of the external carotid artery (ECA) are not considered clinically important but should be reported because they may explain the presence of a bruit on clinical examination and need to be considered by the surgeon at the time of carotid endarterectomy (CEA).
Clinical Background
In the 1990s, many large, well-controlled, multicenter trials both in North America and Europe confirmed the effectiveness of CEA in preventing stroke in patients with ICA stenoses as compared with optimized medical therapy. The NASCET (North American Symptomatic Carotid Endarterectomy Trial) demonstrated that CEA resulted in an absolute reduction of 17% in stroke at 2 years when compared with medical therapy in symptomatic patients with 70% or greater stenosis. Subsequent data from the NASCET reported improvement in outcome with CEA in patients with 50% to 69% stenosis, although the amount of improvement was far less than was the case with higher grade stenosis. The ACAS (Asymptomatic Carotid Atherosclerosis Study) also showed a reduction in incident stroke for asymptomatic patients with 60% or more stenotic lesions but, like the moderate range of stenoses in the NACSET, there was only a 5.8% reduction over 5 years. Other studies, both here and abroad, confirmed the benefit of CEA and validated the role of this procedure. The Asymptomatic Carotid Surgery Trial 1 (ACST-1) demonstrated a 10-year benefit in stroke reduction in asymptomatic patients who underwent CEA for severe stenosis between 70% and 89%.
With the advent of statin (HMG-CoA reductase inhibitors) therapy, studies demonstrated a decreased risk of major vascular events such as stroke and that more aggressive statin treatment further decreased that risk by an additional 16%. Trials combining CEA with statin therapy started on hospital admission for surgery showed a decrease in neurologic events such as ischemic stroke and decreased mortality after CEA. In addition, when statins were started on asymptomatic patients prior to CEA, the incidence of perioperative stroke and early cognitive decline also decreased.
Carotid artery stenting (CAS) is the alternative treatment for stenosis that became widely available after the year 2000. The Carotid Revascularization Endarterectomy versus Stenting Trial (CREST) comparing CAS with CEA demonstrated a similar reduction in stroke between the two procedures in symptomatic and asymptomatic patients. However, carotid stenting was associated with a higher incidence of periprocedural stroke, while CEA patients had a higher risk of perioperative myocardial infarction. In addition, results in symptomatic patients were conflicting with more studies arguing against CAS in patients with symptomatic stenosis and high medical risk.
Imaging of Stenosis
The ultrasound examination is the first line imaging study for patients undergoing evaluation for carotid stenosis. Ultrasound is the only imaging technique used in many facilities for selecting patients who might undergo carotid endarterectomy or stenting. In others, magnetic resonance angiography (MRA) or computed tomographic angiography (CTA) may be performed in combination with sonography in cases where significant luminal narrowing is identified on the ultrasound examination or when the sonographic results are equivocal. As a result of improved high-resolution ultrasound imaging of the carotid arteries with supplemental imaging from MRA or CTA, the role of conventional angiography as a diagnostic technique has significantly decreased.
This chapter emphasizes the Doppler evaluation of ICA stenosis because it has been extensively studied and is strongly associated with TIA and stroke. The diagnosis of stenotic disease affecting other parts of the carotid system may be clinically important and will also be discussed.
Methods of estimating internal carotid artery stenosis
The ultrasound criteria for estimating ICA stenosis severity are largely based on the results of the NASCET and European Carotid Surgery Trials (ECST). Most of the large carotid stenosis studies compared ultrasound with angiography as the gold standard while using the traditional non-NASCET method of grading carotid stenosis. The degree of carotid stenosis was characterized by measuring the size of the residual lumen and comparing it with the size of the original vessel lumen ( Fig. 7.1 ). Although this is an appropriate method in most vessels, there are several unique features of the proximal ICA that render this measurement technique problematic. To begin with, on all conventional angiographic studies, the original lumen is not actually seen. While this is not a major problem in peripheral arteries when the original lumen is visible on both sides of a stenosis, lesions at the origin of the ICA typically do not have a “normal” lumen on both sides. The estimation of the original lumen is further complicated by the presence of a normal, but highly variable, region of dilatation, the carotid bulb. The difficulty in estimating the exact location of the plaque-free lumen of the proximal ICA introduced a great degree of interobserver error in estimating the degree of ICA stenosis. To decrease interobserver error, the NASCET and ACAS investigators adopted a different method: comparing the smallest residual luminal diameter with the luminal diameter of the normal ICA distal to the stenosis ( Fig. 7.1 ).

Although the so-called NASCET method may not truly reflect the degree of luminal narrowing at the site of stenosis, this method has the advantage of minimizing interobserver error. It should be noted that the ECST continued to rely on the conventional method of stenosis measurement, and, although both the original NASCET and ECST confirmed the effectiveness of CEA, their methods of measuring ICA stenosis were quite different. In general, for a given diameter of a residual lumen, the calculation of percent stenosis tends to be significantly higher using the pre-NASCET measurement method when compared with the NASCET method ( Fig. 7.1 ). The NASCET technique is currently the standard on which the large clinical North American studies were based and should be used to make clinical decisions about which patients undergo CEA. As such, Doppler thresholds taken from studies that did not use the NASCET method of measurement should not be used.
- •
Large, multicenter trials both in North America and Europe confirmed the effectiveness of CEA in preventing stroke in patients with ICA stenoses compared with optimized medical therapy.
- •
The ultrasound criteria for estimating ICA stenosis severity are largely based on the results of the NASCET and ECST.
- •
Prior to the 1990s, the degree of carotid stenosis was measured by angiography and estimated where the artery wall should be so that the local or relative degree of stenosis can be estimated.
- •
With ACAS and NASCET, the degree of stenosis is measured by relating the residual lumen diameter at the stenosis to the diameter of the distal ICA.
Sonographic technique
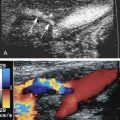
The carotid ultrasound examination begins with the patient supine and neck slightly extended with the head turned to the opposite side if needed ( Fig. 7.2 ). Typically, a 9-MHz linear transducer (or transducer range of 5 to 12 MHz) is used. The scan may begin with either the longitudinal or transverse imaging of the CCA. The CCA is imaged from the supraclavicular notch where the transducer is angled as inferiorly as possible to see its proximal extent. In the coronal plane, a heel-toe maneuver is used to image the CCA from the supraclavicular notch to the angle of the mandible. The ICA and the ECA are then imaged. The ICA is usually posterior and lateral to the ECA. The ICA and ECA can be distinguished by the low-resistance waveforms (higher diastolic flow) in the ICA as compared with the high-resistance waveforms in the ECA (lower diastolic flow) ( Fig. 7.3 ). Transversely, the CCA is imaged from its proximal to distal aspects with gray-scale and color Doppler imaging. The carotid bulb and bifurcation should be imaged with gray scale and color Doppler. If significant plaque is present in the ICA, the degree of luminal narrowing can be estimated in the transverse plane by comparing the main luminal diameter and residual lumen diameter (the diameter that excludes plaque) and using it as a qualitative adjunct to the measurement of stenosis severity based in the peak systolic velocity (PSV).


Doppler blood flow velocity measurements should be obtained from the proximal and distal CCA and the proximal, mid, and distal ICA. From these, the ICA/CCA ratio can be automatically calculated, typically with the PSV measurement from the distal CCA in the ratio, because velocity measurements in the proximal CCA may be slightly elevated because of the proximity of the thoracic aorta. In addition, the Doppler blood flow velocities should always be compared with the degree of plaque, if present. Blood flow velocities of the ECA are usually less clinically relevant; however, elevated ECA velocities may account for the presence of a bruit when there is no ICA stenosis.
The vertebral artery is typically identified in the longitudinal plane, between the transverse processes of the cervical spine. Documentation of direction of blood flow and appearance of the spectral waveform are important to ensure that blood flow direction is cephalad (toward the head) and maintained throughout the cardiac cycle.
- •
The ICA Doppler spectrum typically shows a low-resistance pattern.
- •
The ECA waveform has a higher resistance pattern than the ICA.
- •
Elevated blood flow velocities in the ECA are not considered clinically important except that they can explain the presence of a clinically detected carotid bruit.
Doppler parameters and thresholds
The current parameters used to grade the severity of ICA stenosis are based on the Society of Radiologists in Ultrasound (SRU) Consensus Statement in 2003. The SRU criteria were derived from multiple studies reflecting different velocity parameters including the PSV, the ratio of PSV in the ICA to that in the ipsilateral distal CCA (i.e., the ICA PSV/CCA PSV ratio), and end-diastolic velocity (EDV). The SRU panel concluded that elevated PSV in the ICA and the presence of flow-limiting plaque are the primary parameters determining the severity of ICA stenosis. Secondary parameters such as elevated EDV in the ICA and elevated ICA/CCA PSV ratios further support the diagnosis of ICA stenosis if present.
Several studies showed that the average PSV and ICA/CCA PSV ratio rise in direct proportion to the severity of stenosis as determined by angiography. The former study used the traditional method of grading stenosis, whereas the latter used the NASCET/ACAS approach. However, the standard deviations around each of these average velocity values are quite large, suggesting that Doppler velocity measurements cannot predict the exact degree of vessel narrowing ( Fig. 7.4 ). The diagnostic strata proposed by the Consensus Conference of the SRU (0% to 49%, 50% to 69%, and ≥70% but less than near occlusion) represent practical values that are clinically relevant and consistent with the NASCET.

The SRU consensus conference provided reasonable values that can be easily applied ( Table 7.1 ) and have been adopted by a large number of laboratories. Similar cut-points had also been validated against angiography and produced a sensitivity of 95.3% and specificity of 84.4%. The SRU consensus data represent a compromise between sensitivity and specificity and are based on cut points validated against ACAS/NASCET-based angiographic measurements of stenosis severity ( Table 7.2 ; Figs. 7.5 and 7.6 ).
| Degree of Stenosis | Primary Criteria | Secondary Criteria | ||
|---|---|---|---|---|
| Visual Assessment of Plaque | ICA PSV (cm/s) | ICA/CCA PSV Ratio | ICA EDV (cm/s) | |
| Normal | None | <125 | <2.0 | <40 |
| <50% | <50% | <125 | <2.0 | <40 |
| 50% | ≥50% | >125–230 | >2.0–4.0 | >40–100 |
| 70% | ≥50% | >230 | >4.0 | >100 |
| Near occlusion | Visible | High, low or undetectable | Variable | Variable |
| Total occlusion | Visible, no detectable lumen | Undetectable | N/A | N/A |
| Peak Systolic Velocity (cm/s) | Sensitivity (%) | Specificity (%) | Accuracy (%) |
|---|---|---|---|
| 100 | 100 | 82.8 | 85 |
| 125 | 100 | 87.6 | 89.2 |
| 150 | 96.1 | 90.5 | 91.2 |
| 175 | 96.1 | 92.5 | 93 |
| 200 | 92.2 | 95.1 | 94.7 |
| 225 | 86.3 | 95.7 | 94.5 |
| 250 | 70.6 | 96.8 | 93.5 |
| 275 | 66.7 | 97.1 | 93.2 |
| 300 | 60.8 | 97.4 | 92.7 |
| 350 | 41.2 | 98.6 | 91.2 |
| 400 | 33.3 | 99.4 | 91 |


PSV is by far the most commonly used parameter because it is easily obtained and highly reproducible. In one study, PSV and ICA/CCA PSV ratios performed almost identically with regard to the identification of ICA stenoses greater than 70% when compared with angiography ( Fig. 7.7 ). EDV was slightly less accurate.

When considering an individual patient, the great variation in the PSV and EDV in any population must be taken into consideration. For that reason, ICA/CCA PSV ratio measurements may identify patients who, for hemodynamic reasons (e.g., low cardiac output, tandem lesions), have velocities that fall outside the expected norm for either PSV or EDV. Low cardiac output, for example, may have lower than expected velocities for a given degree of stenosis, and a ratio may actually be more reflective of the true degree of vessel narrowing. Conversely, blood flow velocities in the ICA contralateral to a high-grade stenosis or occlusion may be higher than expected if the vessel is the major supplier of collateral blood flow around the circle of Willis. An important technical point to be made when calculating the ICA/CCA PSV ratio is that the denominator must be obtained from the distal CCA approximately 2 to 4 cm proximal to the bifurcation. A study by Lee et al. showed that, in most patients, the systolic velocity decreases in the CCA as one goes from proximal to distal within the vessel. Therefore, if the CCA velocity for the ratio is obtained from the proximal portion of the artery, the ratio may be low, potentially causing an underestimation of the degree of stenosis based on this parameter.
Hathout et al. revisited an interesting approach to ICA ratio measurements where the ratio of the highest PSV at the site of the stenosis was compared with the normalized velocity in the distal ICA. This approach mimics the method of measurement used in the NASCET. Given that the two velocity values are taken from the same vessel involved by the stenosis, Hathout et al. showed that this method produced superior results in characterizing the degree of ICA stenosis when compared with more commonly applied Doppler parameters. Although the commonly used PSV ratio (ICA PSV/CCA PSV) performs well, the denominator is obtained from the CCA, which can potentially be affected by extraneous factors such as disease in the CCAs and/or the ECAs.
The internal carotid PSV may be falsely elevated in tortuous vessels. This is probably related to both a true increase in velocity as blood accelerates around a curve and difficulty in assigning a correct Doppler angle. Hence, if the ICA is extremely tortuous, caution is required when making the diagnosis of a stenosis on the basis of increased Doppler velocities alone without observing narrowing of the vessel lumen on gray-scale and/or color flow imaging and showing poststenotic turbulence on the Doppler spectral tracing. Elevated velocities can also be found with entities other than significant stenosis such as in young athletes, in high cardiac output states, in vessels supplying arteriovenous fistulas or arterial venous malformations, and in patients with carotid stenting. Therefore one should always consider the gray-scale and color Doppler appearance of the carotid segment in question including the plaque burden and visual estimates of vessel narrowing to determine whether all diagnostic features (both visual and velocity data) of a suspected stenosis are concordant.
Diagnostic Criteria
- 1.
The SRU consensus conference proposed the following Doppler velocity cut points:
- •
For <50% ICA stenosis:
- i.
<125 cm/s PSV of the ICA
- ii.
An internal to common carotid peak systolic velocity ratio <2.0
- iii.
An end-diastolic ICA velocity <40 cm/s
- i.
- •
For 50% to 69% ICA stenosis:
- i.
≥125 cm/s but <230 cm/s peak systolic velocity of the ICA
- ii.
An internal to common carotid PSV ratio ≥2.0 but <4.0
- iii.
An end-diastolic ICA velocity ≥40 cm/s but <100 cm/s
- i.
- •
For 70% ICA stenosis or greater, but less than near occlusion:
- i.
≥230 cm/s PSV of the ICA
- ii.
An internal to common carotid PSV ratio ≥4.0
- iii.
An end-diastolic ICA velocity ≥100 cm/s
- i.
- •
- 2.
A historical end-diastolic cut-point PSV ≥140 cm/s derived from the University of Washington criteria is still used for the presence of 80% stenosis despite the fact that the threshold was measured on non-NASCET graded arteriograms.
- •
Specific cut-points based on the arteriographic correlative studies need to use the NASCET/ACAS measurement approach ( Fig. 7.1 ).
- •
The SRU consensus panel concluded that elevated PSV in the ICA and the presence of flow-limiting plaque are the primary parameters determining the severity of ICA stenosis. Secondary parameters such as elevated EDV in the ICA and elevated ICA/CCA PSV ratios further support the diagnosis of ICA stenosis.
- •
The velocity criteria apply when atherosclerotic plaque is present and their accuracy can be affected by:
- •
Contralateral stenosis
- •
Artery tortuosity
- •
Changes in cardiac output
- •
- •
ICA/CCA PSV ratio measurements may identify patients that for hemodynamic reasons (low cardiac output, tandem lesions, etc.), have velocities that fall outside the expected norm for either PSV or EDV.
Plaque Characterization
Previous studies have shown the importance of internal carotid plaque characterization (see Chapter 6 ). Homogeneous or echogenic plaques are believed to be stable and are unlikely to develop intraplaque hemorrhage or ulceration. Plaque that contains an anechoic or hypoechoic focus may represent intraplaque hemorrhage or deposits of lipid or cholesterol. Plaque with strong echolucent elements is generally termed heterogeneous plaque, which is considered unstable and more prone to embolize. In addition, ulcerated plaque that demonstrates a focal depression or break within the plaque is also more prone to plaque rupture and subsequent embolic event ( Fig. 7.8 ). Calcification can be seen with both homogeneous and heterogeneous plaques.

Related posts:
 Doppler Flow Imaging and Spectral Analysis
 Ultrasound Diagnosis of Lower Extremity Venous Thrombosis
 Evaluating Carotid Plaque and Carotid Intima-Media Thickness
 Assessment of Upper Extremity Arterial Disease
 Ultrasound Assessment Following Endovascular Aortic Aneurysm Repair
 Evaluation of Organ Transplants
Stay updated, free articles. Join our Telegram channel

Full access? Get Clinical Tree


