Introduction
Noninvasive testing for lower extremity arterial disease provides objective information that can be combined with the clinical history and physical examination to serve as the basis for decisions regarding further evaluation and treatment. One of the most critical decisions relates to whether a patient requires therapeutic intervention and should undergo additional imaging studies. Catheter contrast arteriography has historically been the definitive examination for lower extremity arterial disease, but this approach is invasive, expensive, and poorly suited for screening or long-term follow-up testing. In addition, catheter contrast arteriography provides anatomic rather than physiologic information and may be subject to variability at the time of interpretation. Magnetic resonance angiography (MRA) and computed tomographic angiography (CTA) can also provide an accurate anatomic assessment of lower extremity arterial disease without some of the risks associated with catheter arteriography. There is evidence that the application of these less-invasive approaches to arterial imaging has decreased the utilization of diagnostic catheter contrast arteriography.
As discussed in Chapter 12 , the nonimaging or indirect physiologic tests for lower extremity arterial disease, such as measurement of ankle-brachial index, segmental limb pressures and pulse volume recordings, provide valuable physiologic information, but they give relatively little anatomic detail. Ultrasound assessment with duplex scanning extends the capabilities of indirect testing by obtaining anatomic and physiologic information directly from sites of arterial disease. The initial application of duplex scanning concentrated on the clinically important problem of extracranial carotid artery disease. The focal nature of carotid atherosclerosis and the relatively superficial location of the carotid bifurcation contributed to the success of these early studies. Subsequent advances in technology made it possible to obtain ultrasound images and blood flow information from the more deeply located vessels in the abdomen and lower extremities. Ongoing clinical experience has shown that decisions regarding treatment of lower extremity arterial disease based on duplex scanning and CTA are similar. This chapter reviews the current status of duplex scanning for the initial evaluation of lower extremity arterial disease. The more specialized application of follow-up after arterial interventions is covered in Chapter 16 .
Instrumentation
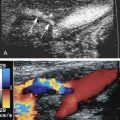
A standard duplex ultrasound system with high-resolution B-mode imaging, pulsed Doppler spectral waveform analysis, and color flow Doppler imaging is adequate for scanning lower extremity arteries. A variety of transducers are often needed for a complete lower extremity arterial duplex examination. Low-frequency (2 or 3 MHz) transducers are best for evaluating the aorta and iliac arteries, whereas a higher frequency (5 or 7.5 MHz) transducer is adequate in most patients for the infrainguinal vessels. In general, the highest frequency transducer that provides adequate depth penetration should be used. The color flow image helps to identify vessels and the blood flow abnormalities caused by arterial lesions ( Figs. 15.1 and 15.2 ). The ability to visualize blood flow abnormalities throughout a vessel improves the precision of pulsed Doppler sample volume placement for obtaining spectral waveforms. Thus use of color flow imaging probably reduces examination time for the lower extremity arteries, as it does in the carotid arteries, and improves overall accuracy for aortoiliac and femoropopliteal disease. Power Doppler is an alternative method for displaying flow information that is particularly sensitive to low flow rates. The power Doppler display is also less dependent on the direction of flow and the angle of the ultrasound beam than color Doppler, and it tends to produce a more arteriogram-like vessel image.


Duplex instruments are equipped with presets or combinations of ultrasound parameters for gray-scale and Doppler imaging that can be selected by the examiner for a particular application. These presets can be helpful, especially during the learning process, but these parameters may not be adequate for all patient examinations. A complete understanding of the ultrasound parameters that are under the examiner’s control (i.e., color gain, color Doppler velocity scale, pulse repetition frequency or scale for Doppler spectral waveforms, wall filter) is essential for optimizing arterial duplex scans.
Duplex Ultrasound Technique
Similar to the other arterial applications of duplex scanning, the lower extremity assessment relies on high-quality B-mode imaging to identify the artery of interest and to facilitate precise placement of the pulsed Doppler sample volume for spectral waveform analysis. Both color flow and power Doppler imaging provide important blood flow information to guide pulsed Doppler interrogation. These imaging modalities are also valuable for recognizing anatomic variations and for identifying arterial disease by showing plaque or calcification. However, it should be emphasized that color flow Doppler and power Doppler imaging are not substitutes for spectral waveform analysis, which is the primary method for classifying the severity of arterial stenosis.
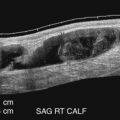
When examining an arterial segment, it is essential that the ultrasound probe be sequentially moved along the artery at closely spaced intervals in order to evaluate blood flow patterns in an overlapping fashion. This is necessary because the flow disturbances produced by arterial lesions are propagated along the vessel for a relatively short distance. Experimental work has shown that the high-velocity jets and turbulence associated with arterial stenoses are damped out over a distance of only a few vessel diameters. Consequently, failure to identify localized flow abnormalities could lead to underestimation of disease severity. Because local flow disturbances are usually apparent with color flow imaging (see Fig. 15.1 ), pulsed Doppler spectral waveforms may be obtained at more widely spaced intervals when color flow Doppler is used. Nonetheless, it is advisable to assess the flow characteristics with spectral waveform analysis at frequent intervals, especially in patients with diffuse arterial disease. Lengths of occluded arterial segments can be measured with a combination of B-mode, color flow, and power Doppler imaging by visualizing the point of occlusion proximally and the distal site where flow reconstitutes through collateral vessels. Because flow velocities distal to an occluded segment may be low, it is important to adjust the Doppler imaging parameters of the instrument to detect low flow rates.
For ultrasound examination of the aorta and iliac arteries, patients should fast for about 12 hours to reduce interference by bowel gas. This is facilitated by examining patients early in the morning after their overnight fast. The patient is initially positioned supine with the hips rotated externally. A left lateral decubitus position may also be advantageous for the abdominal portion of the examination. Increasing the room temperature or placing an electric blanket over the patient prevents vasoconstriction caused by low room temperatures.
For a complete lower extremity arterial evaluation, scanning begins with the proximal segment of the abdominal aorta. An anterior midline approach to the aorta is used, with the transducer placed just below the xyphoid process. Pulsed Doppler spectral waveforms are best obtained in a long-axis view (longitudinal plane of the aorta), but transverse B-mode image views are useful to define anatomic relationships, to identify branch vessels, to measure arterial diameters, and to assess the cross-sectional features of the aorta ( Fig. 15.3 ). If specifically indicated, the mesenteric and renal vessels can be examined at this time, although these do not need to be examined routinely when evaluating the lower extremity arteries. The aorta is followed distally to its bifurcation, which is visualized by placing the transducer at the level of the umbilicus and using an oblique approach ( Fig. 15.4 ). The iliac arteries are then examined separately to the level of the groin with the transducer placed at the level of the iliac crest to evaluate the middle to distal common iliac and proximal external iliac arteries ( Fig. 15.5 ). This may require applying considerable pressure with the transducer to displace overlying bowel loops. The origin of the internal iliac artery is used as a landmark to separate the common iliac artery from the external iliac artery.


Each lower extremity is examined beginning with the common femoral artery and working distally. After the common femoral and the proximal deep femoral arteries are evaluated, the superficial femoral artery is followed as it courses down the thigh. At the distal thigh, it is often helpful to turn the patient to the prone position to examine the popliteal artery. However, some examiners prefer to examine the popliteal segment with the patient supine and the leg externally rotated and flexed at the knee. As the popliteal artery is scanned in a longitudinal view, the first bifurcation encountered below the knee joint is usually the anterior tibial artery and the tibioperoneal trunk. The posterior tibial and peroneal arteries arise from the tibioperoneal trunk and can be difficult to examine completely, but they can usually be seen by using color flow or power Doppler imaging. Identification of these vessels is facilitated by visualization of the adjacent paired veins (see Fig. 15.2 ). These vessels are best evaluated by identifying their origins from the distal popliteal artery and scanning distally or by finding the arteries at the ankle and working proximally. Several large branches can often be seen originating from the distal superficial femoral artery and popliteal artery. These are readily visualized with color flow or power Doppler imaging and represent the geniculate and sural arteries (see Chapter 11 ).
Pulsed Doppler recordings should be taken at the following standard locations: (1) the proximal, middle, and distal abdominal aorta; (2) the common iliac, proximal internal iliac, and external iliac arteries; (3) the common femoral and proximal deep femoral arteries; (4) the proximal, middle, and distal superficial femoral artery; (5) the popliteal artery; and (6) the tibial/peroneal arteries at their origins and at the level of the ankle. Pulsed Doppler spectral waveforms are also recorded from any areas in which increased velocities or other flow disturbances are noted with color Doppler imaging.
Targeted duplex examinations may also be performed. These studies are usually guided by the indirect studies that identify a region of abnormality. Focused examination of abnormal segments is more efficient when single lesions are identified with the indirect tests. As with other applications of arterial duplex scanning, Doppler angle adjustment is required for accurate velocity measurements. Although an angle of 60 degrees is usually obtainable, angles of less than 60 degrees can be used to provide clinically useful information.
- •
For lower extremity duplex scanning, pulsed Doppler spectral waveforms should be obtained at closely spaced intervals because the flow disturbances produced by arterial lesions are propagated along the vessel for a relatively short distance (about 1 or 2 vessel diameters).
- •
Because flow velocities distal to an occluded segment may be low, it is important to adjust the Doppler imaging parameters of the instrument to detect low flow rates.
- •
Examination of the abdominal aorta and iliac arteries is facilitated by scanning the patient following an overnight fast to reduce interference by bowel gas.
- •
For the evaluation of the abdominal aorta and lower extremity arteries, pulsed Doppler measurements should include the following standard locations: (1) the proximal, middle, and distal abdominal aorta; (2) the common iliac, proximal internal iliac, and external iliac arteries; (3) the common femoral and proximal deep femoral arteries; (4) the proximal, middle, and distal superficial femoral artery; (5) the popliteal artery; and (6) the tibial/peroneal arteries at their origins and at the level of the ankle.
- •
Pulsed Doppler spectral waveforms are recorded from any areas with increased velocities or other flow disturbances seen on color Doppler imaging.
Classification of Disease
Normal flow characteristics
Jager and colleagues determined standard values for arterial diameter and peak systolic blood flow velocity in the lower extremity arteries of 55 healthy subjects (30 men, 25 women) ranging in age from 20 to 80 years ( Table 15.1 ). Although women had smaller arteries than men, peak systolic flow velocities did not differ significantly between men and women in this study. However, the peak systolic velocity (PSV) decreased steadily from the iliac artery to the popliteal artery. There was no significant difference in PSV in the three tibial/peroneal arteries in the healthy subjects.
| Artery | Peak Velocity ±SD (cm/s) | Diameter ±SD (cm) |
|---|---|---|
| External iliac | 119 ±22 | 0.79 ±0.13 |
| Common femoral | 114 ±25 | 0.82 ±0.14 |
| Superficial femoral (proximal) | 91 ±14 | 0.60 ±0.12 |
| Superficial femoral (distal) | 94 ±14 | 0.54 ±0.11 |
| Popliteal | 69 ±14 | 0.52 ±0.11 |
Spectral waveforms taken from normal lower extremity arteries show the characteristic triphasic velocity pattern that is associated with peripheral arterial flow ( Fig. 15.6 ). This flow pattern is also apparent on color flow imaging. The initial high-velocity, forward flow phase that results from cardiac systole is followed by a brief phase of reverse flow in early diastole and a final low-velocity, forward flow phase later in diastole. The reverse flow component is a consequence of the relatively high peripheral vascular resistance in the normal lower extremity arterial circulation. Reverse flow becomes less prominent when peripheral resistance decreases. Loss of the reverse flow component occurs in normal lower extremity arteries with the vasodilatation that accompanies exercise, reactive hyperemia, or limb warming.
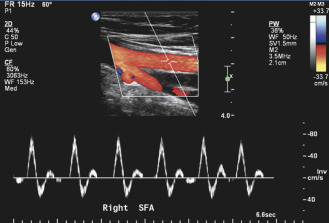
The flow pattern in the center stream of normal lower extremity arteries is relatively uniform, with the red blood cells all having nearly the same velocity. Therefore the flow is laminar, and the corresponding spectral waveform contains a narrow band of frequencies with a clear area under the systolic peak ( Figs. 15.6 and 15.7 ). Arterial lesions disrupt this normal laminar flow pattern and give rise to characteristic localized changes that include increases in PSV and a widening of the frequency band that is referred to as spectral broadening . This is seen as filling-in of the normal clear area under the systolic peak (see Fig. 15.7C–D ). The reverse flow component is also absent distal to severe occlusive lesions.


Abnormal flow patterns
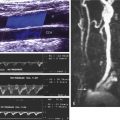
Based on the established normal and abnormal features of spectral waveforms, a set of criteria for classifying the severity of stenosis in lower extremity arteries was originally developed at the University of Washington. The current version of these criteria is summarized in Table 15.2 and Fig. 15.7 . Minimal disease (1% to 19% diameter reduction) is indicated by a slight increase in spectral width (spectral broadening), without a significant increase in PSV (<30% increase in PSV compared with the adjacent proximal segment). This minimal spectral broadening is usually found in late systole and early diastole. Moderate stenosis (20% to 49% diameter reduction) is characterized by more prominent spectral broadening and by an increase in PSV up to 100% compared with the adjacent proximal segment. High-grade stenosis (50% to 99% diameter reduction) produces the most severe flow disturbance, with markedly increased PSV (>100% compared with the adjacent proximal segment), extensive spectral broadening, and loss of the reverse flow component ( Fig. 15.8 ). Occlusion of an arterial segment is documented when no Doppler flow signals can be detected in the lumen of a clearly imaged vessel. Spectral waveforms obtained distal to a severe stenosis or occlusion are generally monophasic and damped with reduced PSV and a delayed systolic rise, resulting in a tardus-parvus flow pattern ( Fig. 15.9 ). The features of spectral waveforms taken proximal to a stenotic lesion are variable and depend primarily on the status of any intervening collateral circulation. Immediately proximal to a severe arterial stenosis or occlusion, the spectral waveforms typically show extremely low PSV and little or no flow in diastole, although the rapid systolic rise may be preserved if inflow is normal ( Fig. 15.10 ).
| Disease Severity | Spectral Waveform Features |
|---|---|
| Normal | Triphasic waveform No spectral broadening |
| 1%–19% diameter reduction | Triphasic waveform with minimal spectral broadening Peak systolic velocity is increased <30% relative to the adjacent proximal segment Proximal and distal waveforms remain normal |
| 20%–49% diameter reduction | Triphasic waveform usually maintained (although reverse flow component may be diminished) Spectral broadening is prominent with filling in of the clear area under the systolic peak Peak systolic velocity is increased 30%–100% relative to the adjacent proximal segment Proximal and distal waveforms remain normal |
| 50%–99% diameter reduction | Monophasic waveform with loss of the reverse flow component and forward flow throughout the cardiac cycle Extensive spectral broadening Peak systolic velocity is increased >100% relative to the adjacent proximal segment Distal waveform is monophasic with reduced systolic velocity |
| Occlusion | No flow is detected within the imaged arterial segment Preocclusive “thump” may be heard just proximal to the site of occlusion Distal (collateral) waveforms are monophasic with reduced systolic velocities |


The University of Washington criteria and other reported criteria for classification of arterial stenosis severity are based primarily on the PSV ratio or Vr, which is obtained by dividing the maximum PSV within a stenosis by the PSV in a normal (nonstenotic) arterial segment just proximal to the stenosis. Grading stenoses using the Vr has been found to be highly reproducible, whereas use of spectral broadening criteria have not. Hemodynamically significant stenoses in lower extremity arteries correlate with threshold Vr values ranging from 1.4 to 3.0. A Vr of 2.0 or greater is a reasonable compromise and is used by many vascular laboratories as a threshold for a peripheral artery stenosis of 50% or greater diameter reduction.
An important difference between spectral waveform analysis and color flow imaging is that spectral waveforms display the entire frequency and amplitude content of the pulsed Doppler signal at a specific site, whereas the color flow image provides a single estimate of the Doppler shift frequency or flow velocity for each site within the B-mode image. Consequently, spectral waveform analysis provides considerably more flow information from each individual site than color flow imaging. The main advantage of the color flow display is that it presents flow information over a larger portion of the B-mode image, although the actual amount of data for each site is reduced. A color flow image displays flow abnormalities as focal areas of aliasing or color bruit artifacts that enable the examiner to place the pulsed Doppler sample volume in the region of flow disturbance and obtain spectral waveforms. These spectral waveforms contain a range of frequencies and amplitudes that allow determination of flow direction and parameters such as mean and peak velocity. In contrast, color assignments are based on flow direction and a single mean or average frequency estimate. Therefore the peak or maximum velocities indicated on spectral waveforms are generally higher than those indicated by the color flow image.
- •
Normal lower extremity arterial spectral waveforms demonstrate a triphasic flow pattern, and the PSV decreases steadily from the iliac arteries to the calf arteries.
- •
Arterial lesions disrupt the normal laminar flow pattern and produce increases in PSV and filling-in of the clear systolic window described as spectral broadening .
- •
Loss of the reverse flow component is seen with severe (>50%) arterial stenoses and may also be seen in normal arteries with vigorous exercise, reactive hyperemia, or limb warming.
- •
Spectral waveforms obtained distal to a severe stenosis or occlusion are generally monophasic and damped with reduced PSV, resulting in a tardus-parvus flow pattern.
Related posts:

Stay updated, free articles. Join our Telegram channel

Full access? Get Clinical Tree


