Introduction
In 1965, Miyazaki and Kato first reported the use of continuous-wave Doppler ultrasound for the assessment of extracranial cerebral vessels. Despite its rapid development in other medical fields, this technique was not applied to the intracranial vessels until 1982. At that time, Aaslid and colleagues developed a transcranial Doppler (TCD) device with a pulsed-wave sound emission of 2 MHz that could successfully penetrate the skull and accurately measure blood flow velocities in the basal arteries and the circle of Willis. With the introduction of TCD, it became possible to record intracranial blood flow velocity directly, and TCD became an important noninvasive method for assessing cerebral hemodynamics and for evaluating intracranial cerebrovascular disease. The continuous development and refinement of ultrasonography during the past two decades led to a broad spectrum of clinical TCD applications. The introduction of transcranial color-coded duplex sonography (TCCS) into clinical use was an important technical refinement. TCCS combines B-mode imaging with frequency-based color flow imaging and Doppler sonography. By means of TCCS, direct online visualization of the basal cerebral arteries and their flow directions became possible, allowing for angle-corrected measurements of blood flow velocities at defined depths. Subsequently, power-based and three-dimensional TCCS were added, and ultrasound contrast agents were introduced, further enhancing the diagnostic capability of this innovative technique. Transcranial B-mode sonography also offers insights into alterations in the brain parenchyma seen in patients with movement disorders.
Ultrasound contrast agents have likewise provided the opportunity to detect right-to-left cardiac shunts and to perform perfusion studies of the brain parenchyma based on indicator dilution principles.
The detection of high intensity transient signals (HITS) or microembolic signals (MES) by means of TCD constitutes another developmental landmark by allowing the noninvasive estimation of microemboli reaching the intracranial arteries.
The therapeutic use of ultrasound-assisted thrombolysis (sonothrombolysis) offers an alternative to endovascular arterial recanalization during an evolving stroke.
This chapter provides an overview of the main technical and clinical aspects of intracranial ultrasonography and briefly introduces the latest technical and clinical developments.
Examination Techniques
General prerequisites
Two prerequisites should be fulfilled before performing a TCD examination: (1) the status of the extracranial arteries has to be known, and (2) the patient needs to rest comfortably to avoid major fluctuations in blood carbon dioxide levels and movement artifacts. In addition, two main anatomic considerations must be dealt with by the examiner: (1) the ultrasonic “windows” through which the ultrasound beam can penetrate the skull are often limited or difficult to identify, and (2) the arteries at the base of the skull vary greatly with respect to size, course, development, and site of access. The transmission of ultrasound signals through the cranium has been extensively studied. It depends on the skull structure, with each of the three layers influencing ultrasound transmission in different ways. Grolimund has performed a number of in vitro experiments showing that a wide range of energy loss occurs in different skull samples, and that the energy loss varies greatly between individuals and with skull location. In no case was the power measured behind the skull greater than 35% of the transmitted power. It was further shown that the skull can provide the effect of an acoustic lens, and that refraction or distortion of the beam depends more on the variation of bone thickness than on the angle of insonation.
Transcranial Doppler and transcranial color-coded duplex sonography devices
Transcranial ultrasound applications require a large signal-to-noise ratio. This is one of the reasons why the available transcranial instruments have a lower bandwidth, and therefore a larger and less-defined sample volume than most other pulsed Doppler devices. Commercial TCD systems mostly use a 2-MHz, pulsed, range-gated Doppler device with good directional resolution. TCCS is performed with 1.8- to 3.6-MHz phased-array sector transducers. Further instrumental requirements are (1) transmitting powers ranging between 10 and 100 mW/cm 2 , (2) adjustable Doppler gate depth, (3) pulse repetition frequency up to 20 kHz, (4) focusing of the ultrasonic beam at a distance of 40 to 60 mm from the probe, and (5) online display of the time-averaged velocity and peak systolic velocity (PSV) derived from the Doppler waveform contour generated following spectral analysis of the ultrasonic signals. Several commercially available TCD devices are equipped with special headbands or helmets to enable continuous monitoring.
Ultrasonic windows
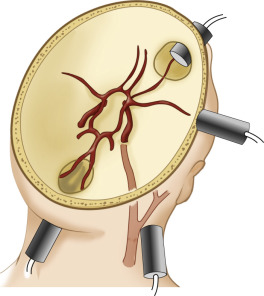
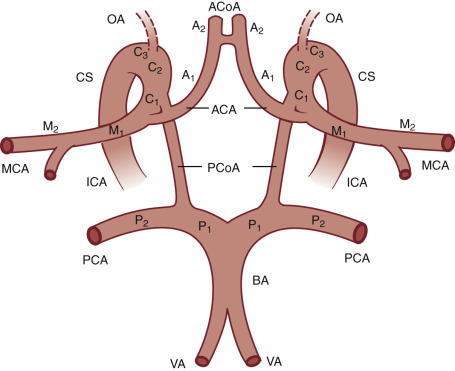
Four main ultrasound approaches ( Fig. 10.1 ) are used to examine the intracranial arteries: the transtemporal, transorbital, suboccipital (i.e., transforaminal), and submandibular approaches. An extensive nomenclature has been developed for describing the segments of the intracranial cerebral arteries and this terminology is used in this chapter. If you are unfamiliar with cerebral artery nomenclature, please refer to Fig. 10.2 .
Transtemporal approach
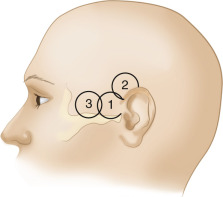
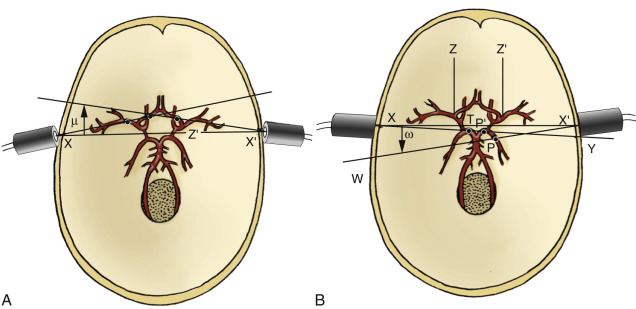
The probe is placed on the temporal aspect of the head, above the zygomatic arch and immediately anterior and slightly superior to the tragus of the ear conch ( Fig. 10.3 , position 1 ). This is usually the most promising examination site. A more posterior window immediately cephalad and slightly dorsal to the first one (see Fig. 10.3 , position 2 ) may be more appropriate in a minority of cases, especially for insonation of the P 2 segment of the posterior cerebral arteries (PCAs). In some patients, a more frontally located temporal window may be present (see Fig. 10.3 , position 3 ). Starting from these transtemporal windows, the ultrasound probe can be angulated anteriorly or posteriorly relative to the corresponding probe positions on the opposite side of the head. The anterior orientation of the ultrasound beam allows insonation of the M 1 and M 2 segments of the middle cerebral arteries (MCAs), the C 1 segment of the carotid siphon (CS), the A 1 segment of the anterior cerebral artery (ACA), and often the anterior communicating artery ( Fig. 10.4A ). Posterior angulation of the ultrasound beam allows examination of the P 1 and P 2 segments of the PCA, the top of the basilar artery (BA), and the posterior communicating arteries (see Fig. 10.4B ).
Transorbital approach
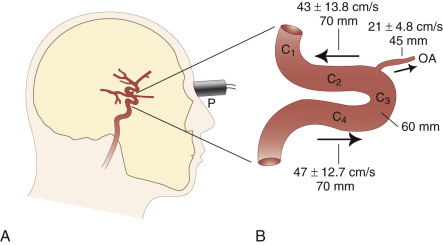
Components of the anterior cerebral circulation may be evaluated by placing the transducer against the closed eyelid. To avoid damage to the lenses of the eyes, the power of the ultrasound transmission has to be reduced. The ophthalmic artery can usually be insonated at depths of 45 to 50 mm, whereas the C 3 segment (anterior knee of the CS) is normally met at insonation depths of 60 to 65 mm ( Fig. 10.5A ). At slightly greater insonation depths of 70 to 75 mm, the C 2 segment shows flow away from the probe, and the C 4 segment shows flow toward the probe. These blood flow directions apply only when the beam is nearly sagittal (slight medial obliquity) and enters the skull through the supraorbital or infraorbital fissures. Typical insonation depths and velocities are shown in Fig. 10.5B . Measurements made through the transorbital approach are less well established and validated than those made through the transtemporal and suboccipital approaches.
Suboccipital (transforaminal) approach
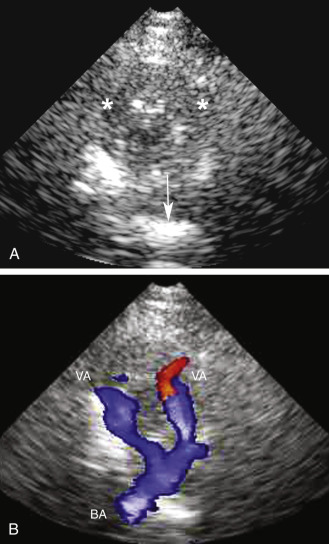
The suboccipital (transforaminal) approach is essential for screening the distal part of the vertebral artery (VA), the so-called V4-segment and the basilar artery (BA). The probe is placed exactly between the posterior margin of the foramen magnum and the palpable spinous process of the first cervical vertebra, with the beam aimed at the bridge of the nose ( Fig. 10.6A ). The insonation depth is set at 65 mm, and the right and left VAs are tracked individually from this (deepest) point back toward the foramen magnum, using progressively smaller insonation depths (from 65 down to 35 mm). As the depth decreases, the sound beam is angled increasingly sharply toward the side of the head. The extradural part of the VA, on the posterior arch of the atlas (V3 segment), can also be screened. Flow is toward the transducer in this segment. The BA can be tracked cephalad from the point at which the VAs join. The superior end of the BA is reached at a depth of approximately 95 to 125 mm. Blood flow in the intradural VAs and the BA is normally directed away from the probe. Typical insonation depths and blood flow velocities are shown in Fig. 10.6B .

Submandibular approach
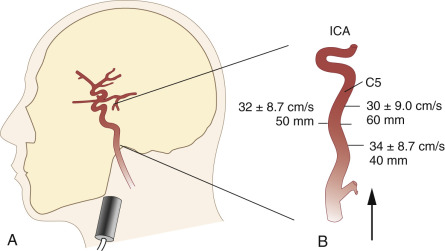
The submandibular approach complements the examination permitting the Doppler interrogation of the retromandibular and more distal extradural parts (C 5 to C 6 segments) of the internal carotid artery (ICA). This particular imaging window facilitates the detection of ICA dissection and chronic ICA occlusion with abundant collateralization through the external carotid artery. With the transducer positioned as shown in Fig. 10.7A , the beam is directed slightly medially and posteriorly. The ICA can regularly be tracked to a depth of 80 to 85 mm, at which point it bends medioanteriorly to form the CS. Typical insonation depths and blood flow velocities are shown in Fig. 10.7B .
- •
The transmitted ultrasound power penetrating the skull is at most 35%.
- •
TCD systems mostly use a 2-MHz, pulsed, range-gated Doppler device with good directional resolution, whereas TCCS uses 1.8- to 3.6-MHz phased-array sector transducers.
- •
The transtemporal window permits:
- •
Anterior orientation of the ultrasound beam and interrogation of the M 1 and M 2 segments of the MCAs, the C 1 segment of the CS, the A 1 segment of the ACA, and often the anterior communicating artery.
- •
Posterior angulation of the beam allows examination of the P 1 and P 2 segments of the PCA, the top of the BA, and the posterior communicating arteries.
- •
- •
The transorbital approach requires the application of less power and is used to insonate the ophthalmic artery and the C 2 and C 4 segments of the ICA.
- •
The suboccipital (foraminal) approach is used to evaluate the vertebral and basilar arteries.
Diagnostic approach
Basic transcranial Doppler examination
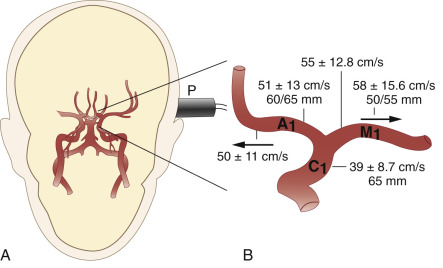
It is practical to start the examination at the transtemporal window, identify the MCA on either side at an insonation depth of 50 to 55 mm, and then track the ipsilateral arterial network, step by step, in various directions. Proof of traceability of the MCA is necessary for its unequivocal identification. This is also true for other arteries at the base of the brain. Traceability refers to the fact that the MCA (and usually other arteries) can be tracked in incremental steps from shallow insonation depths (35 mm) to deeper sites (55 mm) without showing changes in the character of the blood flow profile and direction. When tracking the MCA medially (65 to 70 mm), an abrupt change in flow direction (away from, rather than toward the probe) indicates insonation of the A 1 segment of the ACA. Blood flow signals toward the probe at this depth usually emanate from the CS at its junction with the MCA. Typical depths and blood flow velocities are shown in Fig. 10.8 .
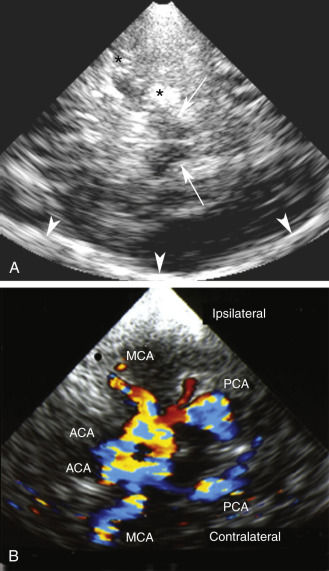
By angling the beam more posteriorly from the transtemporal approach, the P 1 segment of the PCA can be picked up most readily at an insonation depth of 65 to 70 mm. The PCA can then be tracked to the top of the BA (75 mm) and from there to the contralateral PCA (80 to 85 mm) (see Fig. 10.4B ). The two criteria of traceability (i.e., the display of bilateral blood flow at the junction with the BA and the change of flow direction within the contralateral PCA) are very important features for identifying the PCAs without compression tests.
After the completion of the examination from both temporal windows, additional information may be obtained through the orbital, suboccipital, or submandibular windows. The arterial segments that are accessible from these windows and insonation depths, as well as the techniques for identifying these vessels, have previously been described. A protocol for TCD examination is described in Table 10.1 .
| Position of Probe | Arterial Segment | Insonation Depth | Normal Flow Velocity (Mean ±SD) (cm/s) | Main Features for Identification of Vessel Segment | |
|---|---|---|---|---|---|
| Range (mm) | Reference Depth (mm) | ||||
| Transtemporal | MCA | 30–60 | 50 | 55 ± 12 | M 1 : Insonation depth 50 mm; traceability forward and backward; flow toward probe; slightly anterior angulation of beam |
| M 1 | 45–60 | 50 | 55 ± 12 | ||
| ACA | 60–75 | 70 | 50 ± 11 | Insonation depth; flow away from probe; traceability with slight anterior angulation of beam; for clear-cut differentiation from carotid siphon | |
| C 1 (C 2 ) (carotid siphon transtemporal approach) | 60–70 | 65 | 39 ± 9 | Insonation depth; relatively low flow velocity compared with M 1 segment; slightly anterior and caudal angulation of beam; flow toward probe | |
| P 1 (posterior cerebral artery) | 60 (55)–75 | 70 | 39 ± 10 | Insonation depth; flow toward probe (ipsilateral P 1 ); traceability to top of basilar and contralateral P 1 ; slightly posterior and caudal angulation of beam; relatively low flow velocity compared with M 1 segment | |
| P 1 and P 1 ‘ (top of basilar) | 70–80 | 75 | 40 ± 10 | Insonation depth; bidirectional flow; traceability backward and forward; angulation of beam | |
| P 2 (PCA) | 60–65 | 65 | 40 ± 10 | Flow away from probe; placement of probe; posterior angulation of probe; modulation by opening and closing eyes | |
| Suboccipital | Extradural distal vertebral artery | 40–55 | 50 | 34 ± 8 | Suboccipital placement of probe; insonation depth; strongly lateral angulation of beam; flow toward probe |
| Intradural distal vertebral artery | 60–95 (100) | 70 | 38 ± 10 | Insonation depth Beam aimed at bridge of nose or slightly laterally; traceability forward and backward | |
| Basilar trunk | 70 (65)–115 (120) | 95 (100, if possible) | 41 ± 10 | Insonation depth; flow away from probe; often slight increase of flow velocity compared with vertebral artery; traceability of vertebrobasilar axis | |
| Ophthalmic | C 2 (carotid siphon, transorbital approach) | 65–80 | 70 | 41 ± 11 | Sagittal or slightly oblique angulation of beam; flow away from beam; flow away from probe; insonation depth |
| C 3 (carotid siphon, transorbital approach) | 65 (60) | 65 | (Bidirectional, not measured) | Bidirectional signal; sagittal angulation of beam; insonation depth | |
| C 4 and distal part of C 5 (carotid siphon, transorbital approach) | 65–80 (85) | 70 | 47 ± 14 | Sagittal or slightly oblique and caudal angulation of beam; flow toward probe; insonation depth | |
| Ophthalmic artery | 35–55 | 45 | 21 ± 5 | Insonation depth; flow toward probe | |
| Contralateral A 1 (ACA; transorbital approach, ancillary approach if lack of temporal window) | 75–80 | Not defined | Measurements in a few cases only | Strongly oblique angulation of beam through optic canal; flow toward probe; compression test necessary for differentiation from carotid siphon and MCA | |
| Submandibular | C 6 and retromandibular segment of ICA extradural ICA; submandibular) | 35–80 (85) | 60 | 30 ±9 | Flow away from probe; medial angulation of beam; insonation depth |
Transcranial color-coded duplex sonography examination
TCCS is a well-established diagnostic method, allowing direct noninvasive imaging of intracranial vascular structures. This visual approach provides for more rapid and reliable vessel identification, permitting exact localization of the Doppler sample volume, and shortening the examination time. This technique has evolved rapidly and now includes not only vascular (i.e., arterial and venous) imaging but also imaging of the brain parenchyma. Usually the transtemporal and suboccipital approaches are used during TCCS examinations. No systematic data exist for the submandibular approach. The transorbital TCCS investigation now offers a means of monitoring intracranial pressures by measurement of the width of the sheath of the optical nerve (i.e., in intensive care units [intracranial pressure]), or in cases of suspected benign intracranial hypertension.
For transtemporal insonation, the probe is positioned axially along the orbitomeatal line and the hypoechoic, butterfly-shaped midbrain is visualized as an anatomic landmark at a depth of 6 to 8 cm. From this perspective, the circle of Willis can then easily be depicted ( Fig. 10.9 ). Other landmarks that can be seen as the beam is tilted more cranially are the third ventricle in the midline, the pineal gland and the choroidal plexus (both hyperechoic), and the cella media. For the suboccipital approach, the hypoechoic foramen magnum and the hyperechoic clivus serve as the anatomic landmarks, with both VAs located at their lateral edges ( Fig. 10.10 ). The origin of the BA can also be visually identified in most cases at a depth of 75 to 95 mm. Generally, the reference depths of the target vessels are similar to the values given previously for the TCD examination. TCCS also allows for the examination of cerebral venous sinuses and large basal cerebral veins, although this has not become part of the clinical routine. Transcranial B-mode ultrasound can be used to follow intracranial hemorrhages and to assess the brain parenchyma in movement disorders. The method is especially helpful in differentiating Parkinson syndromes.
Vessel identification
The primary TCD parameters for identifying the cerebral arteries are the following:
- 1.
Insonation depth
- 2.
Direction of blood flow at insonation depth
- 3.
Flow velocity (mean flow velocity and systolic or diastolic peak flow velocity)
- 4.
Probe position (e.g., temporal, orbital, suboccipital, submandibular)
- 5.
Direction of the ultrasonic beam (e.g., posterior, anterior, caudad, cephalad)
- 6.
Traceability of vessels
Blood flow velocity measurements
The mean blood flow velocities of various arterial segments, and their age dependency, are shown in Tables 10.2 and 10.3 . Normal blood flow velocity values in adults show little variation among different investigators. The highest velocities are almost always found in the MCA or the ACA. The PCAs and BAs have lower Doppler frequency shifts than the MCA in normal patients. This pattern has not been observed in cerebral blood flow studies where volume blood flow is measured in cubic centimeters per second. Two explanations have been offered for this discrepancy between velocity and volume flow: (1) the measurement sites may be different or (2) more likely, different velocities occur as a compensatory mechanism to keep volume flow constant in arteries of different sizes. Thus velocities are slower in large vessels and faster in small ones. Normal angle-corrected blood flow velocity values using TCCS have likewise been established and are only slightly higher than those obtained with TCD. The TCD documentation of decreasing flow velocities with increasing age correlates well with age-related changes in cerebral blood flow and underlines the validity and accuracy of TCD and TCCS for estimating cerebral blood flow.
| Age (Years) | Mean Blood Velocity (cm/s) | ||
|---|---|---|---|
| MCA (M 1 ) | ACA (A 1 ) | PCA (P 1 ) | |
| 10–29 | 70 ± 16.4 | 61 ± 14.7 | 55 ± 9.0 |
| 30–49 | 57 ± 11.2 | 48 ± 7.1 | 42 ± 8.9 |
| 50–59 | 51 ± 9.7 | 46 ± 9.4 | 9 ± 9.9 |
| 60–70 | 41 ± 7.0 | 38 ± 5.6 | 36 ± 7.9 |
| Insonated depth (mm) | 50–55 | 60–65 | 60–65 |
a Measurements for the middle (MCA), anterior (ACA), and posterior (PCA) cerebral arteries according to age.
| Age (Years) | Mean Blood Velocity (cm/s) | ||
|---|---|---|---|
| PCA (P 1 ) | BA | VA | |
| 10–29 | 54 ± 8.0 | 46 ± 11 | 45 ± 9.8 |
| 30–49 | 40 ± 8.5 | 38 ± 8.6 | 34 ± 8.2 |
| 50–59 | 39 ± 10.1 | 32 ± 7.0 | 37 ± 10.0 |
| 60–70 | 35 ± 11.1 | 32 ± 6.7 | 35 ± 7.0 |
| Insonated depth (mm) | 60–65 | 85–90 | 60–65 |
a Measurements for the posterior cerebral (PCA), basilar (BA), and vertebral (VA) arteries according to age.
Functional reserve testing
TCD is an ideal functional test for detecting rapid changes in cerebral perfusion because the technique provides excellent resolution of blood flow velocity changes occurring over time. Functional tests are predominantly aimed at the evaluation of the reserve mechanism of the cerebral vasculature, using various stimuli such as hypocapnia or hypercapnia, shift in the pH by acetazolamide, increased or reduced systemic arterial pressure, and hypoxia. The CO 2 (carbon dioxide) dilatory effect is mainly restricted to the peripheral arterial vascular bed, particularly the small cortical vessels. With changing CO 2 concentrations, the relationship between flow velocity and volume flow within a large cerebral artery is linear, provided that the CO 2 level does not directly affect the diameter of the large proximal arterial segment. Velocities measured from the MCA with changing CO 2 concentrations show a biasymptotic, S-shaped curve ( Fig. 10.11 ).
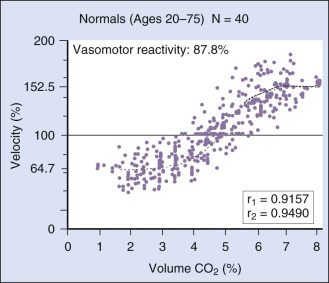
A “preserved” vasomotor reserve implies that a drop in perfusion pressure can be counterbalanced by vasodilatation of cortical arterioles to maintain sufficient cortical blood supply. The vasomotor reserve may become exhausted if the resistance vessels in brain areas with low perfusion pressure distal to a high-grade stenosis are already maximally dilated. In this state, the resistance vessels are refractory to any further vasodilatory stimuli, and hypercapnia cannot increase blood flow. This condition may be critical because ischemic brain injury can occur if the perfusion pressure is further reduced for any reason. Measurements of the vasomotor reserve capacity are useful in evaluating the hemodynamic impact of extracranial occlusive carotid disease or of a high-grade proximal middle cerebral artery stenosis.
The pulsatility index, as defined by Gosling (see Chapter 3 ), reflects the resistance in the peripheral vascular bed and has been suggested as a sensitive index of diastolic runoff, that is, with increased peripheral vasodilatation, diastolic runoff is expected to increase and the pulsatility index to decrease. However, in a large series of patients with carotid artery occlusion, the pulsatility index appeared to be much poorer for predicting the intracranial hemodynamic situation than the vasomotor reserve capacity.
Diagnostic Parameters for Specific Clinical Applications
Intracranial stenosis and occlusion
The detection of CS stenosis using TCD was first reported in 1986 by Spencer and Whisler, who used similar criteria to those used for carotid bifurcation disease. Since then, a number of authors have reported similar findings for the CS and have extended TCD applications to other brain arteries.
Definition of stenosis with transcranial Doppler
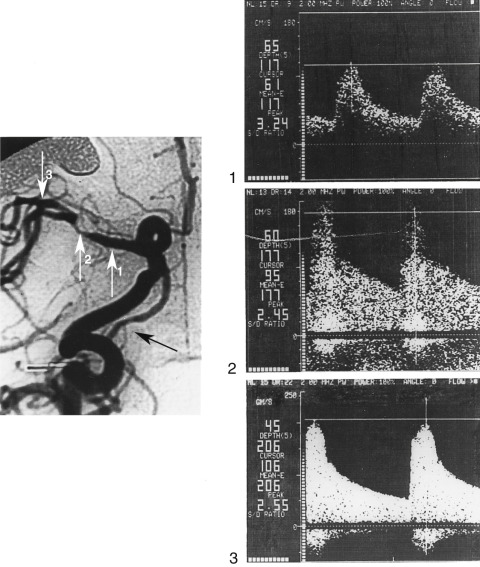
The following are typical TCD features of circumscribed stenosis of a large basal cerebral artery ( Fig. 10.12 ): (1) increased flow velocity; (2) disturbed flow (spectral broadening and enhanced systolic and low-frequency components); and (3) covibration phenomena (vibration of vessel wall and surrounding soft tissue). It is unclear whether the PSV (>120 to 160 cm/s) or the mean systolic velocity (>80 to 120 cm/s) should be used as a threshold value. When detecting intracranial stenoses with a diameter of 50% or more with a mean velocity value of 100 cm/s, a sensitivity of 100%, a specificity of 97.9%, as well as positive and negative predictive values of 88.8% and 94.9% were reported. For the vertebrobasilar system, a threshold of more than 2 kHz peak-systolic Doppler shift showed a sensitivity of 80% and a specificity of 97% in detecting stenoses of 50% or more. Most authors agree that, in comparison with the contralateral vessel segment, a relative increase in PSV of more than 30% is suspicious for hemodynamically significant stenosis and a relative increase of more than 50% indicates a definite intracranial artery stenosis.
Definition of occlusion with transcranial Doppler
Basal cerebral artery occlusion can be detected by three observations: (1) the absence of arterial signals at an expected depth; (2) the presence of signals in vessels that communicate with the occluded artery; and (3) altered flow in communicating vessels, indicating collateralization. For example, occlusion of the MCA is diagnosed from the lack of an MCA signal in the presence of Doppler signals from other vessels (i.e., the PCA, the ACA, or the distal CS). This combination of findings also confirms that the temporal window is satisfactory. TCD has shown a sensitivity of 83% and a specificity of 94.4%, with an overall accuracy of 91.6%, in the detection of intracranial vessel occlusion. Using coronary angiography-based Thrombolysis in Myocardial Infarction (TIMI) criteria as a model, Demchuk and colleagues have proposed Thrombolysis in Brain Ischemia (TIBI) criteria for the TCD-based classification of the MCA status during and after thrombolysis. The TIBI scale, ranging from 0 (MCA occlusion) to 5 (normal MCA), is given in Table 10.4 . The TIBI criteria were found to be accurate in the prediction of the clinical outcome in acute stroke patients undergoing thrombolytic therapy.
| TIBI Score | Status of the MCA Flow | TCD Criteria |
|---|---|---|
| 0 | Occlusion |
|
| 1 | Near occlusion or minimal residual flow |
|
| 2 | Strongly reduced |
|
| 3 | Moderately reduced |
|
| 4 | Stenotic signal |
|
| 5 | Normal signal |
|
Stay updated, free articles. Join our Telegram channel

Full access? Get Clinical Tree


