Introduction
The association of carotid atherosclerotic disease with symptomatic cerebrovascular disease (i.e., transient ischemic attacks), amaurosis fugax, and stroke, is well established. Carotid endarterectomy and stenting are also effective in managing symptomatic patients with high-grade carotid stenosis. However, the implications and management of vertebral artery disease are less well studied. There are no consistently successful diagnostic or management techniques for vertebral artery disease. Patients often present with nonlocalizing symptoms such as blurred vision, ataxia, vertigo, syncope, or generalized extremity weakness. Up to 20% to 30% of transient ischemic attacks and strokes may be due to disease of the posterior (vertebrobasilar) circulation.
It can be difficult to determine whether symptoms that arise from carotid artery thromboembolic disease are because of generalized decreased perfusion secondary to high-grade carotid artery or vertebrobasilar artery occlusive disease (or both) or come from other sources such as cardiac disease. Symptoms of posterior circulation ischemia are typically varied, making it difficult to determine the potential contribution of vertebral-basilar insufficiency ( Table 9.1 ). Although the surgical treatment of vertebral artery disease can be successful and relatively safe, patient selection may require consideration of internal carotid artery disease because symptoms of posterior circulation ischemia frequently improve following carotid artery endarterectomy or reconstruction. Results of a recent prospective study suggest that endovascular treatment of origin vertebral artery stenosis may not have clinical benefit.
| Dizziness or vertigo (accompanied by other symptoms) |
| Difficulty ambulating |
| Loss of balance |
| Ataxia |
| Inability to maintain erect posture |
| Upper extremity hypotonia |
| Blindness |
| Blurred vision |
| Diplopia |
| Hemianopia |
| Bilateral visual field defects |
| Nystagmus |
| Poorly reactive pupils |
| Difficulty focusing |
| Difficulty reading |
| Memory loss |
| Somnolence |
Angiography, performed on the basis of the patient’s clinical history, has been the definitive diagnostic procedure to identify significant vertebrobasilar obstructive lesions. Magnetic resonance angiography (MRA) and computed tomographic angiography (CTA) have shown high accuracy, with duplex ultrasound having moderate accuracy, for the diagnosis of vertebral-basilar disease. Although ultrasound evaluation of the vertebral arteries is recognized as a routine part of the extracranial cerebrovascular examination by various accrediting organizations, this assessment is typically limited to documenting the absence, presence, and direction of blood flow.
Duplex ultrasound has been shown to be an effective noninvasive technique for the evaluation of the extracranial segments of the vertebral arteries. Quantitative Doppler waveforms and velocity estimates can be obtained from the middle portion of the extracranial vertebral arteries in more than 98% of patients and vessels. It is also possible to collect imaging and Doppler waveforms from the origin of the right vertebral artery in more than 92% to 94% of patients and from the origin of the left vertebral artery in approximately 60% to 86% of patients. The following sections describe duplex ultrasound evaluation techniques, the qualitative and quantitative data that can be obtained, and the interpretation and possible clinical significance of these results.
- •
Symptoms associated with atherosclerotic disease of the vertebral-basilar arterial system are diverse and often vague.
- •
Up to 20% to 30% of ischemic events may be because of disease of the posterior circulation.
- •
Doppler waveforms can be consistently obtained at both vertebral artery intervertebral segments and the right vertebral origin. Technical success rates are lower at the origin of the left vertebral artery.
Examination Technique
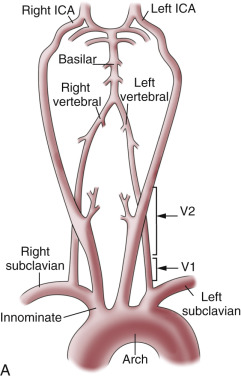
Most hemodynamic significant lesions of the vertebral arteries occur close to their origins (segment V0) and the segment extending from the subclavian artery to entry into the foramen of the transverse process at the sixth cervical body (segment V1) ( Fig. 9.1 ). It would therefore seem logical to begin the duplex ultrasound examination in this segment. However, this approach can be difficult, if not technically impossible, in as many as one-third of patients because the clavicle interferes with the probe position necessary to see the origin of the vertebral artery and the V1 segment in the longitudinal plane. Occasionally (in 3% to 5% of cases) the left vertebral artery has its origin from the aorta and not from the left subclavian artery. In addition, the course of the V1 segment of the vertebral artery can be markedly tortuous thereby limiting proper Doppler angle correction and velocity measurements. Finally, the origin and proximal segment of the vertebral artery may be confused with other large branches arising from the proximal subclavian artery, such as the thyrocervical trunk.
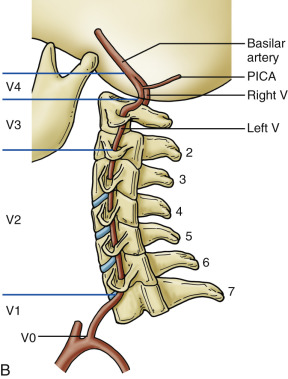
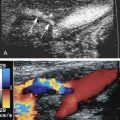
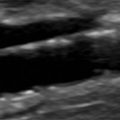
The more reliable approach to assessing the vertebral artery is to visualize it near the mid portion of the cervical spine, at the V2 segment of the vertebral artery, as it courses cranially through the foramina to the transverse processes of C 6 to C 2 ( Fig. 9.2 ). This artery segment is typically quite straight, with minimal tortuosity and does not have any significant diameter changes. This vertebral artery segment does not have any adjacent blood vessels except for the vertebral vein ( Fig. 9.3 ). It does not have any significant branching segments that would make blood flow velocity measurements unreliable. In addition, the V2 segment of the vertebral artery is rarely involved with atherosclerotic obstructive disease. Further cranially, the V4 vertebral artery segment (extending from the point of perforation of the dura to the origin of the basilar artery) may be interrogated using a suboccipital approach and transcranial Doppler techniques (see Chapter 10 ), but segment V3 (the segment that extends from the artery’s exit at C 2 to its entrance into the spinal canal) is generally inaccessible to duplex ultrasound during an extracranial cerebrovascular examination.


Imaging of segment V2 is most easily accomplished by first obtaining a good longitudinal view of the mid common carotid artery (CCA) at the approximate level of the third through fifth cervical vertebrae. Once this image has been obtained, a slight lateral rocking motion of the probe will bring the vertebral artery into view. The vertebral artery is readily identified by the prominent anatomic landmarks of the transverse processes of the cervical spine, which appear as bright echogenic lines that obscure imaging of deeper-lying tissues because of acoustic shadowing ( Fig. 9.2 ). Between these anechoic and rectangular-shaped regions of acoustic shadowing lies an acoustic window where the vertebral artery can be seen. Color Doppler imaging helps to identify the vertebral artery by showing color Doppler signals within this acoustic window. The color Doppler image also distinguishes the vertebral artery from the adjacent vertebral vein (see Fig. 9.3 ) on the basis of the direction of blood flow and the visualization of two vessels. However, the gray-scale image will typically show the walls of the vertebral artery. Once an image of the vertebral artery has been obtained, the Doppler sample volume can be placed in the artery segment ( Fig. 9.4 ) and a Doppler waveform is acquired. This Doppler waveform gives qualitative information and, once angle corrected, quantitative information on local hemodynamics. If these data appear abnormal, the vertebral artery can be followed back toward its origin as far as possible ( Fig. 9.5 ), using combined gray-scale and color Doppler imaging, to assess blood flow hemodynamics in the proximal artery segment.
- •
Visualization of the vertebral artery is easiest in the V2 segment, the segment that extends from vertebral bodies C 6 to C 2 .
- •
Adequate Doppler evaluation of the vertebral artery V1 segment may not be possible due to vessel tortuosity and proximity to the clavicle.
- •
The acoustic window between the transverse processes of the vertebral bodies can be used to visualize the vertebral arteries (segment V2) and to acquire color Doppler images and Doppler waveforms.
- •
Segment V3, from the C 2 level to the entry into the spinal canal and dura, may not be visualized.


Vertebral Artery Hemodynamics: Qualitative Assessment
Normal findings
Qualitatively, the vertebral artery Doppler waveform should be similar to that of the internal carotid artery (ICA) because both directly supply the low-resistance intracranial vascular system. The Doppler waveform should have a well-defined systolic peak with sustained blood flow signals throughout diastole as shown in Fig. 9.4 . There is wide variability in the peak systolic velocities seen in normal patients, with a range of 20 to 60 cm/s, with an even wider range noted at the vertebral artery origin (also called segment V0). However, the peak systolic velocity can vary between 41 and 64 cm/s ( Table 9.2 ). Up to 60% of patients have a dominant vertebral artery (i.e., with a larger diameter and higher blood flow velocity than the contralateral side [see Fig. 9.5 ]). This is more often seen on the left side.
- •
The range of vertebral artery peak systolic velocities varies between 41 and 64 cm/s.
- •
The left vertebral artery tends to be a dominant artery and would then have:
- •
increased diameter
- •
increased blood flow velocity
- •
| Peak Systolic Velocity | End-Diastolic Velocity | |
|---|---|---|
| Kuhl et al. | 63.6 ± 17.5 cm/s SD Range 30–100 cm/s | 16.1 ± 5.1 cm/s SD Range 10–35 cm/s |
| Koch et al. | 64.0 ± 28 cm/s SD | 14.0 ± 9 cm/s SD |
| Bartels et al. | Right: 43.0 ± 8.9 cm/s SD Left: 43.3 ± 9.6 cm/s SD | |
| Hallerstam et al. | Right: 46.0 ± 13.0 cm/s SD Left: 41.0 ± 9.0 cm/s SD | Right: 13.0 ± 4.0 cm/s SD Left: 12.0 ± 4.9 cm/s SD |
| Seidel et al. | Right: 45.9 ± 11.1 cm/s SD Left: 51.5 ± 13.3 cm/s SD | Right: 13.8 ± 4.6 cm/s SD Left: 16.1 ± 5.8 cm/s SD |
Elevated velocity and stenosis
Stenosis of the vertebral arteries produces hemodynamic abnormalities readily detected on Doppler waveforms. The few available studies on the prevalence and the natural history of vertebral artery atherosclerotic stenosis show that most lesions, 90% or more, occur at the vertebral artery origin. Visible narrowing on a color Doppler image accompanied by high-velocity color Doppler aliasing and poststenotic flow patterns are indicative of vertebral artery stenosis. This is confirmed by a high-velocity measurement made on an angle-corrected Doppler waveform. Few validated velocity criteria are available to define the severity of a vertebral artery stenosis, but based on our experience with peripheral arterial disease (see Chapter 15 ) reliance on a focal doubling of the peak systolic velocity implies a greater than 50% diameter reduction. This was confirmed by Yurdakul et al. where they found a ratio of 2.2 to have the best accuracy for stenosis of 50% or more. These authors also proposed an absolute peak systolic velocity above 108 cm/s as having good sensitivity and specificity. This is similar to a 114 cm/s cut point proposed by Koch et al. However, Hua et al. showed the best accuracy for a 50% stenosis using a cut point of 140 cm/s, but did confirm the high accuracy of a peak systolic velocity ratio of 2.0. Ultrasound diagnosis of vertebral artery origin stenosis is complicated by the frequent occurrence of considerable tortuosity in the proximal 1 to 2 cm of the vertebral artery ( Fig. 9.6 ). Because of tortuosity, nonlaminar blood flow is commonly seen in the proximal vertebral artery, and kinking of the vessel may occur, causing an elevated peak systolic velocity. Tortuosity also may render angle-corrected Doppler velocity measurements unreliable. Considering these technical issues, ultrasound assessment of vertebral artery origin stenosis should also rely on color Doppler and power Doppler imaging and analysis of the distal Doppler waveform alterations. A dampened Doppler waveform (parvus: low velocity and tardus: decreased upstroke ) indicates, with a reasonable degree of certainty, that the lesion is severe enough to have hemodynamic significance ( Fig. 9.7 ). Otherwise, the findings must be regarded as suggestive of hemodynamic significance, and confirmation must be sought with other imaging approaches. Correct diagnosis is important because endovascular techniques that make it possible to treat proximal vertebral artery lesions, although still being investigated as to their efficacy, may offer symptom relief to some patients.
- •
Significant stenosis of the vertebral arteries tends to occur at the vertebral artery origin.
- •
The following criteria are associated with at least a 50% diameter stenosis of the vertebral artery:
- •
peak systolic velocity above a threshold of between 108 and 140 cm/s, depending on the series
- •
more consistent criteria of peak systolic velocity ratio of 2.0 or more in a nontortuous segment
- •
- •
A tardus-parvus waveform is indicative of a significant proximal vertebral artery stenosis.


Other sources of elevated vertebral artery velocities
There are a number of other hemodynamic conditions that might lead to elevated vertebral peak systolic velocities. The most common, as mentioned earlier, is a dominant vertebral artery, more likely seen on the left side (see Fig. 9.5 ).
Significantly increased vertebral artery peak systolic velocities can also be seen when one or both vertebral arteries are the compensatory mechanism for occlusive disease elsewhere in the cerebrovascular system ( Fig. 9.8 ). This can reflect: (1) occlusion or near occlusion of the ICA; (2) contralateral vertebral artery occlusion; or (3) compensatory blood flow because of a subclavian steal in the contralateral vertebral artery. Uncommonly, increased peak systolic velocities can be seen in the vertebral artery V2 segment because of extrinsic compression by the spine or osteophytes in segment V2 and occasionally V3 ( Fig. 9.9 ). This is often associated with changes in head or neck position, frequently referred to as “bow hunter’s syndrome.” Other sources of luminal narrowing include vasculitis or a midvertebral artery atherosclerotic stenosis. Vertebral artery dissection is not commonly associated with elevated blood flow velocities in the absence of significant narrowing in either the true or the false lumen ( Fig. 9.10 ).
Related posts:
 Doppler Flow Imaging and Spectral Analysis
 Ultrasound Diagnosis of Lower Extremity Venous Thrombosis
 Evaluating Carotid Plaque and Carotid Intima-Media Thickness
 Assessment of Upper Extremity Arterial Disease
 Ultrasound Assessment Following Endovascular Aortic Aneurysm Repair
 Evaluation of Organ Transplants
Stay updated, free articles. Join our Telegram channel

Full access? Get Clinical Tree


