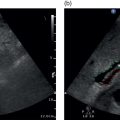
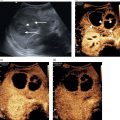
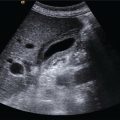
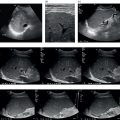
Matteo Rosselli1,2, Davide Roccarina2,3, and Ivica Grgurevic4 1 Department of Internal Medicine, San Giuseppe Hospital, USL Toscana Centro, Empoli, Italy 2 Division of Medicine, Institute for Liver and Digestive Health, University College London, Royal Free Hospital, London, UK 3 Department of Internal Medicine and Hepatology, Azienda Ospedaliero‐Universitaria di Careggi, Florence, Italy 4 Department of Gastroenterology, Hepatology and Clinical Nutrition, University Hospital Dubrava, University of Zagreb School of Medicine and Faculty of Pharmacy and Biochemistry, Zagreb, Croatia Chronic liver disease (CLD) is the consequence of persistent inflammation leading to fibrosis, cirrhosis, portal hypertension (PH), and eventually liver failure. The natural history varies according to aetiology, the site of inflammation, fibrosis progression rate and onset, and the severity of PH, which is in general considered the most important clinical endpoint. Ultrasound is the first imaging modality used to diagnose CLD as well as for hepatocellular carcinoma (HCC) screening, and is therefore one of the most important medical tools in clinical hepatology. This chapter aims to describe the sonographic hallmarks of cirrhosis and clinically significant portal hypertension (CSPH), as well as the differences that might be found among various aetiologies and examples of pathological conditions that mimic cirrhosis on ultrasound imaging. When evaluating patients with CLD, ultrasound assessment should include liver echotexture, echogenicity, capsule and margins, the relationship between the right and caudate lobes, and eventually the description of hypertrophy/hypotrophy of the right and left liver lobes. The presence or absence of focal lesions should be highlighted. The gallbladder and biliary ducts should also be evaluated. The portal venous system should be assessed, highlighting features compatible with PH including the description of porto‐systemic vascular collaterals and splenomegaly. The inferior vena cava (IVC) calibre and hepatic vein patency and flow are also important to exclude features compatible with cardiogenic cirrhosis or Budd–Chiari syndrome. Usually the hepatic artery is not described unless specific findings are seen, such as ectasia, aneurisms, pseudoaneurysms, and arterio‐venous communications. Finally, the presence of ascites, its aspect, and its amount should be reported. The measurement of liver diameters does not seem to be a significant parameter to specify and its use has been abandoned in general practice, as suggested by international guidelines (see also Chapter 3) [1]. It is preferable to give a general description of hepatic enlargement, and hypertrophy or hypotrophy/atrophy of segments/lobe that might influence the shape and general appearance of the liver. In general, although there might be some variability among different aetiologies, morphological signs of cirrhosis include hypotrophy/atrophy of the right liver lobe, and compensatory hypertrophy of the caudate and left lobe. At first glance the morphological appearance is sufficient usually to suggest cirrhosis, although a caudate to right liver lobe width ratio >0.65 using the main bifurcation of the portal vein (PV) as a landmark between the two lobes is more precise and has high accuracy in diagnosing an advanced fibrotic process (Figure 8.1) [2]. Other morphological signs are related to retraction and hypertrophy of different areas of the liver and include enlargement of the gallbladder fossa secondary to atrophy of the right liver lobe, medial segment of the left lobe, and hypertrophy of the caudate lobe; enlargement of the periportal space secondary to atrophy of the left lobe’s medial segments [3]; focal capsular retraction, which might be more pronounced in certain areas as it is observed eventually along the posterior margin of the liver adjacent to the right kidney and is known as ‘notch sign’ [4]; and areas of confluent fibrosis corresponding to wedge‐shaped areas with capsular retraction that might be seen in advanced cirrhosis. Figure 8.1 At a glance the morphological appearance of the liver shows hypertrophy of the caudate lobe and hypotrophy of the right lobe. The caudate to right liver lobe ratio is 0.82, which more specifically suggests chronic liver disease changes in keeping with cirrhosis. One of the most common findings in CLD is the heterogeneity of liver echotexture as an expression of the backscattering of the ultrasound beam on uneven surface, secondary to inflammatory changes, fibrosis, and nodular regeneration. The heterogenic echotexture can vary from mild to very pronounced (‘coarse echopattern’), usually according to the severity of CLD (Figure 8.2). However, it is also of note that the underlying aetiology has an impact on tissue damage, inflammatory response, and distribution of fibrosis, and hence can influence the echotexture heterogeneity, as will be described later in this chapter. In addition, the inappropriate regeneration of the hepatocytes in response to tissue damage is associated with nodularities, which can be very subtle, more obvious, or sometimes so pronounced as to be confounded with a lesion of a different nature, requiring contrast imaging for differential diagnosis. Figure 8.2 Examples of heterogenic echotexture of liver parenchyma of different grades of severity. (a) Mild; (b) moderate–severe; (c) severe; (d) severe with an extremely heterogenic echotexture and a mixed macronodular pattern. In normal conditions the margins of the liver are usually sharp, while in CLD and advanced cirrhosis they become rounded and the outline is typically irregular or even nodular (Figure 8.3). The hepatic veins and gallbladder contour irregularities are also very sensitive signs of CLD (Figure 8.4). It is of note that sometimes irregularities of the liver outline and parenchymal changes might be very subtle. The accuracy of ultrasound in detecting early stages and micronodular regeneration can be missed in about 30% of cases [5]. Along these lines, magnifying the liver surface with a high‐frequency transducer will highlight structural modifications and help to avoid false‐negative results (Figure 8.5) [1]. Figure 8.3 (a, b) In advanced liver disease the outline of the liver is irregular and nodular, with less distinct and rounded margins (arrows) owing to parenchymal and capsular retraction. Figure 8.4 (a, b) Parenchymal retraction and nodularities are also highlighted by exploring the contour of the hepatic veins and gallbladder. The echogenicity of liver parenchyma refers to its brightness, a feature that is most commonly found and used to describe steatosis. Although the most common cause of steatosis is nutrition‐related lipid dysmetabolism, steatosis can also be found in different hepatopathies such as alcohol‐related liver disease, viral hepatitis [6], hemochromatosis, or be drug induced [7]. According to its ultrasound appearance, steatosis can be classified as grade I or mild, when liver echogenicity is more pronounced than the renal cortex but there is no or very mild attenuation of the ultrasound beam through the liver parenchyma; grade II or moderate, where fat‐induced attenuation reduces the visibility of the posterior segments and the contour of the hepatic veins and portal venous system; or grade III or severe, when posterior attenuation is so severe that the posterior segments of the liver and the outline of the diaphragm cannot be seen or are barely visible (Figure 8.6) [8, 9]. Figure 8.5 (a, b) Parenchymal micronodularities and irregular outline are highlighted by magnifying the liver surface and parenchyma with a high‐frequency transducer (typically 8‐14 mHz), increasing ultrasound diagnostic accuracy. Hepatic steatosis can be diffuse, focal, multifocal, or have a very irregular and ill‐defined distribution named the ‘geographical’ pattern (Figure 8.7). Steatosis in some cases can be well defined as a single area or scattered throughout the liver and mimic neoplastic lesions, sometimes requiring second‐level imaging for diagnostic certainty. Nevertheless, a differential criterion between focal steatosis and a focal lesion is that steatosis never deforms the hepatic structures, in particular the liver capsule, bile ducts, and vasculature (Figure 8.8). Figure 8.6 Steatosis is graded according to parenchymal brightness and the degree of posterior attenuation. (a) Grade I; (b) grade II; (c) grade III. Note that this grading relies on the description of ultrasound features. More advanced applications are now available and can be used to accurately quantify steatosis (See chapter 15). Figure 8.7 (a, b) Diffuse ill‐defined hepatic steatosis with a geographical pattern of distribution. Figure 8.8 (a, b) A more focal but ill‐defined distribution of hepatic steatosis with no capsular or vascular distortion. In cases of diffuse steatosis, there might be fat‐sparing areas that can be located anywhere in the liver parenchyma, but most typically near the PV bifurcation, sub‐capsular regions, or around the gallbladder and hepatic veins (Figure 8.9). Figure 8.9 Different examples of focal fatty sparing (arrows) adjacent to the portal vein (a, b), hepatic vein (c), and gallbladder (d). It should be borne in mind that increased echogenicity can also be secondary to fibrotic changes, which can be more diffuse or localised according to the underlying liver pathology. As will be further described, periportal and peribiliary fibrosis is typically characterised by peribiliary and perivascular hyperechoic thickening that might extend to the adjacent liver parenchyma. Increased pressure in the portal venous system accompanies the structural changes of CLD, while haemodynamic factors subsequently contribute to its further progression. The gold standard for PH assessment in cirrhosis is measurement of the hepatic venous pressure gradient (HVPG) obtained by evaluating the difference between wedged hepatic venous pressure and free hepatic venous pressure by means of hepatic vein catheterisation. An HVPG ≥10 mmHg defines the threshold of CSPH, which is associated with the risk of clinical decompensation and onset of the most feared complications such as ascites, variceal bleeding, hepatic encephalopathy, and hepatorenal syndrome [10–12]. However, HVPG is invasive, costly, implies risks, and is not widely available. Although more innovative methods such as elastography have been validated to non‐invasively assess CLD in its different stages (see Chapter 9), ultrasound also has an important role in the diagnosis of PH. In fact, not only can ultrasound highlight the presence of signs of CLD, but it can distinguish features that are in keeping with other chronic conditions suggesting an alternative diagnosis, distinguish features that are more specific of certain aetiologies, and evaluate the presence of PV thrombosis, which can be a cause of non‐cirrhotic PH as well as a complication of cirrhosis [10]. Abundance of the accumulated fibrous tissue, nodular regeneration, and parenchymal distortion result in resistance to blood flow through the liver with increased pressure in the portal venous system and its tributaries. The portal venous flow velocity decreases proportionally with the severity of PH, while its calibre often becomes wider (>13 mm) (Figure 8.10) [13, 14] as well as for the splenic and superior mesenteric veins (>11mm) [10]. Figure 8.10 Dilated portal vein (calibre 14.9 mm) in a patient with advanced liver disease highlighted by contour irregularities, and ascites (arrow). Figure 8.11 Two examples of patients with advanced chronic liver disease highlighted by heterogenic echotexture, irregular outline and ascites, but with a relatively small (a, 9.6 mm) or even narrowed portal vein calibre (b, 5.2 mm), despite the clinical evidence of portal hypertension (both patients have ascites and oesophageal varices on endoscopy). It is of note that less commonly a normal or even slightly narrow PV can be found despite the severity of PH in cirrhosis (Figure 8.11). Increased pressure in the portal venous system leads to congestion of splanchnic organs such as stomach, bowel, gallbladder (Figure 8.12) and spleen (Figure 8.13) [15]. Figure 8.12 (a–c) Gallbladder (GB) thickening secondary to portal hypertension–related congestion. Advanced liver disease is revealed by parenchymal/capsular retraction, irregular outline, ascites, and GB thickening. Different acoustic windows are used to scan the GB on different planes. The arrow points to the GB fundus (transverse section) ‘sticking out’ from the retracted liver. Figure 8.13 (a) An example of homogeneous splenomegaly with a cranio‐caudal diameter of 14.4 cm and (b) a thick‐walled stomach (arrows) in longitudinal (left) and transverse section (right). Upper endoscopy revealed pronounced portal hypertensive gastropathy. Splenomegaly is one of the most common signs of PH and its increase in size over time is described as a marker of PH progression. It is defined by a bipolar cranio‐caudal diameter > 13 and an anteroposterior diameter > 4 cm. In some individuals spleen morphology might differ being longer but thinner or shorter but wider. Under these circumstances measuring the area with a cutoff of > 45cm2 to define splenomegaly might be of help. However, spleen size variability has been described among different CLD aetiologies and in 20–30% of cases it might be normal in size despite the presence of CSPH, especially in alcohol‐related liver disease [16, 17]. The presence of hyperechoic foci without acoustic shadowing, of a size of less than a millimetre, scattered throughout the splenic parenchyma can sometimes be seen in patients with both severe cirrhotic or non‐cirrhotic PH. These findings are remnants of focal splenic microhaemorrhages, histologically proven to be calcific‐fibrosiderotic nodules known as Gamna‐Gandy bodies. Magnetic resonance imaging (MRI) has been approved as the most sensitive imaging modality for the detection of these nodules due to their iron content (drop‐out signal in T1). Nevertheless, sonographic features are also quite typical (Figure 8.14) [18, 19]. Ascites can be one of the first signs of clinical decompensation in cirrhosis with severe PH (Figure 8.15). Nevertheless, in the presence of ascites other signs of advanced cirrhosis and PH should be looked for in patients with CLD, since intraperitoneal fluid might be the consequence of other pathologies such as heart failure, severe hypoalbuminemia, peritoneal carcinomatosis, renal failure, and serositis. Figure 8.14 Patient with cirrhosis and severe portal hypertension. (a) The spleen is surrounded by abundant ascites and hyperechoic spots are scattered throughout the splenic parenchyma, in keeping with Gamna‐Gandy bodies. (b) Magnification helps to improve their definition (arrows), also revealing subtle irregularities of the splenic profile and a fibrous capsular septa (red arrow). In normal physiological conditions portal blood has a constant monophasic or slightly biphasic hepatopetal flow. However, with the worsening of PH, portal vein velocity progressively and proportionally decreases (Figure 8.16a) and it might even become stagnant (Figure 8.16b), with a high risk of thrombosis, or be completely inverted to hepatofugal flow, representing one of the most specific signs of severe PH [13, 20]. Because of the reduced portal venous flow, arterial buffering takes place leading to hepatic parenchymal arterialisation (Figure 8.17). With severe PH, there is an increase in arterial peak systolic velocity and diminished hepatic artery end‐diastolic velocity (EDV), resulting in an increased hepatic artery resistive index (RI >0.7) (Figure 8.18a). However, in cases where a shunt between hepatic artery and hepatic vein has been formed, the RI diminishes due to the drop in the peripheral resistance to arterial blood flow, and the resultant waveform in the hepatic artery changes with both high PSV and EDV (Figure 8.18b). Figure 8.15 Examples of small‐volume ascites surrounding the liver (a, b, arrows) and large‐volume ascites in which oedematous small bowel loops are seen floating (c). Figure 8.16 Two cases of advanced chronic liver disease with severe portal hypertension. The liver has a retracted appearance and is surrounded by ascites. (a) Colour Doppler reveals a very slow hepatopetal flow (max velocity 13.4 cm/s). (b) There is no detectable colour signal. Doppler analysis depicts an extremely low flow with a max velocity of 6.8 cm/s, which is in keeping with almost stagnant flow and high risk of portal vein thrombosis. Figure 8.17 (a, b) Two examples of portal blood flow inversion as an expression of severe portal hypertension. There is pronounced hepatic artery (HA) hypertrophy since liver perfusion, in this phase, relies on arterial supply. PV, portal vein. Figure 8.18 (a) Increased hepatic resistive index (RI) in a patient with advanced cirrhosis. (b) High peak systolic velocity and end‐diastolic velocity with a low hepatic artery RI in a patient with cirrhosis and intrahepatic arteriovenous shunt. The hepatic veins are typically narrowed and compressed by collagen deposition and nodular regeneration, therefore the Doppler waveform loses its triphasic appearance and becomes progressively flattened and linear [20]. The flattening of the hepatic vein waveform has been found to correlate with the severity of CLD [21]. Owing to congestion, but also to the hypertrophy and hyperplasia of some tissue elements, resistance to arterial blood flow in the spleen increases together with portal pressure. Therefore, the intrasplenic arterial waveform becomes stretched, with increased PSV and diminished EDV, resulting in a high RI and pulsatility index (PI). The splenic artery PI is easily obtained, automatically calculated by the ultrasound software, and has been demonstrated as a reliable parameter for PH with a cut‐off value for significant PH when ≥1 (Figure 8.19) [22]. Owing to splanchnic vasodilation, the RI of the superior mesenteric artery diminishes during fasting. On the other hand, systemic vasodilation results in diminished renal perfusion, leading to intrarenal vasoconstriction and increased intrarenal RI (>0.7). An increase in renal RI in cirrhosis might be one of the first indicators of imminent hepato‐renal syndrome [23]. The congestive index is a quite complex Doppler‐related measurement obtained by the ratio between the cross‐sectional area of the PV and its mean flow velocity (cut‐off value of 0.1 cm/s) [24]. Although resistance and pulsatility indexes together with the congestion index are described and have been used in the past, they are considered ancillary findings to be eventually used as integration and not independently for PH diagnosis. Figure 8.19 (a) Normal portal flow velocity, splenomegaly, and normal splenic pulsatility index (PI) in a patient with parasitic infection and a history of hepatitis C virus, but with no sign of chronic liver disease. Splenomegaly was not secondary to portal hypertension (PH). (b) Cirrhosis with reduced portal flow velocity and splenomegaly with an increased splenic PI. (c) Another case with cirrhosis, ascites, very slow portal venous flow, no sign of splenomegaly, but the PI is very high, suggesting severe PH.
8
Ultrasound in Chronic Liver Disease
General Ultrasonic Features of Chronic Liver Disease
Size, Shape, Echotexture, and Contour


Echogenicity


Ultrasound Features of Portal Hypertension
B‐Mode Signs of Portal Hypertension


Colour Doppler Signs of Portal Hypertension


Vascular Modifications as a Sign of Portal Hypertension
Stay updated, free articles. Join our Telegram channel

Full access? Get Clinical Tree


